Educational inequality in the
occurrence of abdominal
obesity:
Pró-Saúde
Study
I Programa de Pós-Graduação em Saúde
Coletiva. Instituto de Medicina Social. Universidade do Estado do Rio de Janeiro. Rio de Janeiro, RJ, Brasil
II Departamento de Epidemiologia. Instituto
de Medicina Social. Universidade do Estado do Rio de Janeiro. Rio de Janeiro, RJ, Brasil Correspondence:
Ronaldo Fernandes Santos Alves
Rua São Francisco Xavier, 524 Pavilhão João Lyra Filho 7º andar Blocos D e E
20550-013 Rio de Janeiro, RJ, Brasil E-mail: [email protected] Received: 8/6/2014
Approved: 1/31/2015
ABSTRACT
OBJECTIVE: To estimate the degree of educational inequality in the occurrence of abdominal obesity in a population of non-faculty civil servants at university campi.
METHODS: In this cross-sectional study, we used data from 3,117 subjects of both genders aged 24 to 65-years old, regarding the baseline of Pró-Saúde Study, 1999-2001. Abdominal obesity was deined according to abdominal
circumference thresholds of 88 cm for women and 102 cm for men. A multi-dimensional, self-administered questionnaire was used to evaluate education levels and demographic variables. Slope and relative indices of inequality, and Chi-squared test for linear trend were used in the data analysis.
All analyses were stratiied by genders, and the indices of inequality were
standardized by age.
RESULTS: Abdominal obesity was the most prevalent among women (43.5%; 95%CI 41.2;45.9), as compared to men (24.3%; 95%CI 22.1;26.7), in all educational strata and age ranges. The association between education levels and abdominal obesity was an inverse one among women (p < 0.001); it
was not statistically signiicant among men (p = 0.436). The educational
inequality regarding abdominal obesity in the female population, in absolute terms (slope index of inequality), was 24.0% (95%CI 15.5;32.6). In relative terms (relative index of inequality), it was 2.8 (95%CI 1.9;4.1), after the age adjustment.
CONCLUSIONS: Gender inequality in the prevalence of abdominal obesity increases with older age and lower education. The slope and relative indices of inequality summarize the strictly monotonous trend between education levels and abdominal obesity, and it described educational inequality regarding abdominal obesity among women. Such indices provide relevant quantitative estimates for monitoring abdominal obesity and dealing with health inequalities.
DESCRIPTORS: Obesity, Abdominal, epidemiology. Socioeconomic Factors. Health Status Disparities. Gender and Health.
Ronaldo Fernandes Santos AlvesI
Obesity is an important global public health problem, with rising trends in several development contexts.28 Obese people have increased risks of adverse outcomes in the long run, and that even holds true for people with no metabolic abnormalities, as compared to individuals of normal weight and metabolically healthy.17 In Brazil, around 50.0% of the adult population is overweight, and 15.0% of it is obese.a
According to the World Health Organization, obesity regards to abnormal or excessive body fat accumula-tion.28 Even though body mass index has been the classic anthropometric measurement in population studies, abdominal circumference has been observed to have better predictive abilities for certain obesity-related morbidities.29 Besides that, as it measures abdominal
obesity, it is a key element in the deinition of metabolic
syndrome19 and in the analysis of risks for cardiovas-cular diseases, diabetes, cancer, and death.4,24
The relationship between socioeconomic position and obesity is consistent, but it is observed to have varia-tions according to genders and levels of economic development.5,21,23 In low-income countries, a higher probability for obesity is observed among groups of high socioeconomic positions in both genders. In medium and high-income countries, the associa-tion between socioeconomic posiassocia-tion and obesity is frequently shown to be inverse among women, espe-cially regarding education, whereas it is observed to
be both direct and not statistically signiicant among
men. Those changes in the association pattern between socioeconomic position and obesity take place in early economic development stages, thus revealing the importance of studies and preventive interventions in that context.5,7,21,23
Measures which are based on the contrasts between comparison groups are commonly used analytic strat-egies to report the extent and direction of the asso-ciation between socioeconomic position and obesity. However, they have the simultaneous interpretation of different partial inequality estimates as a disadvan-tage, as polytomous variables are often used as socio-economic position indicators.30 Alternate methods have been proposed to measure and monitor health-related socioeconomic inequalities, considering only one quan-titative estimate of inequalities;14,30 however, they are not very disseminated in the epidemiological practice.
Even though the relationship between socioeconomic position and obesity is well documented in the epidemio-logical literature, its association with abdominal obesity, especially, is not yet very understood. Furthermore,
INTRODUCTION
no publications were found reporting socioeconomic inequality regarding abdominal obesity in adults in Brazil. Exploring the inequality regarding abdominal obesity may be important to enhance actions to prevent obesity and its consequences.This study intended to esti-mate the degree of educational inequality in the occur-rence of abdominal obesity in a population of non-faculty civil servants at university campi.
METHODS
In this cross-sectional study, we used data from
Pró-Saúde Study baseline (EPS – 1999-2001). EPS
is a longitudinal investigation program of non-faculty civil servants at a university campi in Rio de Janeiro, Southeastern Brazil, mainly focusing on social determi-nants of health.9 So far, four data collection stages were conducted (1999, 2001, 2006, and 2012) by trained
teams comprising ield researchers, supervisors, and
coordinators. The EPS baseline was simultaneously
composed of eligible subjects in the irst two stages.
We included all employees in the permanent staff of the university who accepted to take part in stages 1 and 2 (baseline) of EPS. Pregnant women and people older than 65 years of age were excluded. A pilot study, pre-testing of research instruments and procedures, independent entering of data by two professionals, and monitoring of the collection and data processing ensure the quality of analyzed information.8,9 Covariates were obtained from 1999 census; independent and dependent variables, from 2001 census.
The concentration of fat in the abdominal region was evaluated by a double measurement of abdominal circumference at the level of the navel, through the use of a 180-meter measuring tape. Subjects, in order to be taken measurements, kept their arms folded over their chests, their feet close together, their weights equally distributed between their legs, their abdomens relaxed, and their breathing at regular paces. Abdominal obesity
was deined according to abdominal circumference
thresholds of 88 cm for women and 102 cm for men, as suggested by the World Health Organization.29
A multidimensional, self-administered questionnaire was used to collect the information on genders (male, female), age in years (24 to 34, 35 to 44, 45 to 54, 55 to 65), and education levels (incomplete elementary education, complete elementary education, incomplete high school education, complete high school education, incomplete university education, complete university education, graduate studies).
a Instituto Brasileiro de Geografia e Estatística. Pesquisa de Orçamentos Familiares 2008-2009: antropometria e estado nutricional de crianças,
Preliminary statistical analyses included: absolute and relative frequencies, prevalence of abdominal
obesity, and respective 95% conidence intervals and
Chi-squared test for the linear trend among ordinal variables and dichotomous outcome. Slope (SII) and relative (RII) indices of inequality were used to esti-mate the degree of educational inequality in the occur-rence of abdominal obesity. Those indices may produce absolute and relative estimates of the socioeconomic gradient in health, and they are based on weighted regression analysis.14,30 Linear and logistic regression was used to respectively calculate SII and RII, as well
as the respective 95% conidence intervals. The depen -dent variable was abdominal obesity (dichotomous). The independent variable was a numerical score that
was deined from the median of the cumulative interval
in each category of the social polytomous variable in the horizontal scale of the population (Table 1). Thus, instead of attributing ordinal values (e.g., 1, 2, 3,..., k, for a series of k categories) to subjects from the respec-tive educational categories, numerical values were attributed – they considered: (a) the information from all simultaneously ordered categories; (b) the propor-tional size of those categories; and (c) their relative positions within the population scale. Finally, such numerical values were employed in the related regres-sion models by the numerical score. SII and RII were standardized by ages.
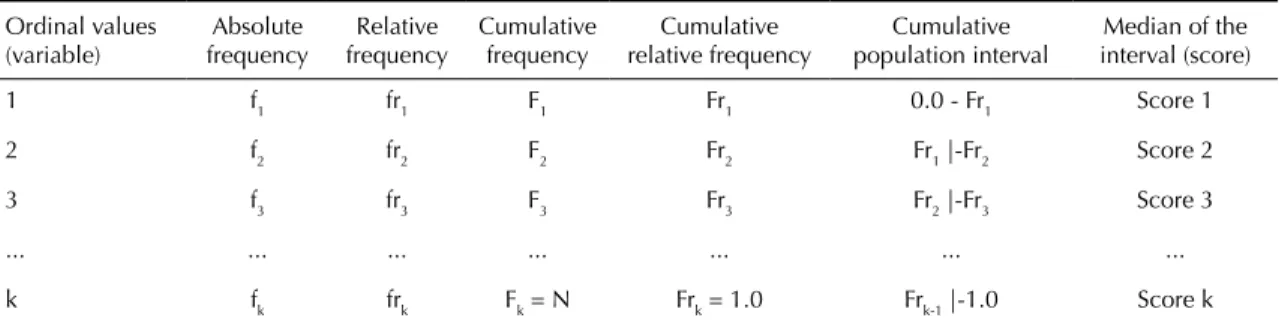
Below is an algebraic proposition to clarify the numerical score. In Table 1, a logic arrangement of used frequency measurements is shown in matrix format, in order to support reading of the numerical score formulation.
Score 1:0 + [Fr1 – 0] ÷ 2 = (F1 ÷ N) ÷ 2 = (f1/N) ÷ 2
Score 2: Fr1 + [(Fr2 – Fr1) ÷ 2] = F1/N + [(F2/N – F1/N) ÷ 2]
= f1/N + {[(f1 + f2 – f1)/N)] ÷ 2]} = f1/N + [(f2/N) ÷ 2]
= f1/N + (f2/2N)
= [(f1 + f2/2) ÷ N]
Score 3: Fr2 + [(Fr3 – Fr2) ÷ 2] = F2/N + [(F3/N – F2/N) ÷ 2]
= F2/N + {[(F2 + f3 – F2)/N)] ÷ 2]}
= (f1 + f2)/N + [(f3/N) ÷ 2]
= (f1 + f2)/N + (f3/2N)
= [(f1 + f2 + f3/2) ÷ N]
Hence,
Score k: [(f1 + f2 + f3 + f4 + ... + fk/2) ÷ N]
= [(Fk - 1 + fk/2) ÷ N]
= [(Σi k - 1= 1i + fk/2) ÷ N]
All analyses were stratiied by genders and processed
in R 3.1.0 software.
The EPS 1999 and 2001 protocols were approved by the Research Ethics Committee of Pedro Ernesto University Hospital, of Universidade do Estado do Rio de Janeiro (Record 224/1999; Record 461/2001). All subjects signed informed consent forms. Data were analyzed in a way to ensure subjects total anonymity.
RESULTS
The study population comprised subjects who were
eligible in the two irst stages of EPS 1999 and 2001. During ield work, 9.6% of subjects skipped partici -pation in stage 1 – and 16.5% in stage two, which totaled 3,253 subjects in both stages (77.9% of eligible ones), who regard to the baseline of the investiga-tion program. The abdominal perimeters of 52 people could not be measured (1.6%); 21 subjects (0.7%) were excluded the data analysis as they were older than 65 years; 63 subjects (1.9%) did not answer the question regarding education level variable. Finally, a sample of 3,117 adults was obtained (95.8% of subjects).
The women in the sample slightly outnumbered the men (Table 2). The average age was 42.7 (95%CI 42.3;43.1) years for women and 41.2 (95%CI 40.8;41.6) for men. The women were observed to have high educational
levels, and 47.0% of them had at least inished univer -sity, whereas for men, a share of 36.0% was observed regarding that. The average age was higher in the cate-gories with the lowest education levels, ranging from 53 to 40 years among women, and from 48 to 50 years among men.
The prevalence of abdominal obesity in the baseline population of EPS was 35.0% (95%CI 33.3;36.7).
It was signiicantly higher among women (43.5%;
95%CI 41.2;45.9) as compared to men (24.3%; 95%CI 22.1;26.7), in all educational strata and age ranges (Table 3). Among the women, the probability for being obese increased with the age, and it was notably higher in the group of 55 to 65-year olds (73.0%; 95%CI 65.2;79,9). Decreased prevalence of abdominal obesity was observed among 55 to 65-year old men, but the small population size of that subgroup may have
inluenced that speciic estimate.
prevalence was found among the women with complete high school education (50.3%; 95%CI 57.1;77.2) than the one from women with incomplete university educa-tion (42.5%; 95%CI 45.6;63.2). In the male populaeduca-tion, Chi-squared test for linear trend did not rule out the null hypothesis for homogeneity among educational
categories (p = 0.436).
SII and RII were only applied to the female popula-tion, which is information implying linearity between the polytomous social factor and the health-related outcome.14,16,30 In this sense, the indices of inequality provided a quantitative synthesis of the strictly monot-onous trend that is observed between education levels and abdominal obesity (Figure). The numerical score considered the female population as a whole, by making the estimates for inequality regarding abdom-inal obesity sensitive to population size variations in educational subgroups at different times.
The analyses indicated that the consistent and inverse relationship between education levels and abdominal
obesity was inluenced by the ages; however, it was
observed to keep a noticeable pattern (Table 3). The absolute and relative degree of inequality regarding abdominal obesity among multiple educational groups was, respectively, 24.0% (SII; 95%CI 15.5;32.6) and 2.8 (RII; 95%CI 1.9;4.1), after the age adjustment.
The indices of inequality are cross-sectionally corre-lated in time,16 pointing towards the same conclusion about inequality: the probability for being obese was “gradually” higher among the women of lower educa-tion levels. However, those indices may describe contradicting results in regards to the degree and direc-tion of educadirec-tional inequality regarding abdominal obesity throughout time, which comes to highlight the importance of using both measurements.2,14
Table 1. Frequency measurements used in the algebraic proposition of the numerical score.
Ordinal values (variable)
Absolute frequency
Relative frequency
Cumulative frequency
Cumulative relative frequency
Cumulative population interval
Median of the interval (score)
1 f1 fr1 F1 Fr1 0.0 - Fr1 Score 1
2 f2 fr2 F2 Fr2 Fr1 |-Fr2 Score 2
3 f3 fr3 F3 Fr3 Fr2 |-Fr3 Score 3
... ... ... ... ... ... ...
k fk frk Fk = N Frk = 1.0 Frk-1 |-1.0 Score k k: (ordinal) index of the social polytomous variable; fk: absolute frequency; frk: relative frequency (commonly expressed as %); Fk: cumulative frequency; Frk: cumulative relative frequency; N: total of subjects in the population
Note: [frk = fk ÷ N] e [Frk = Fk ÷ N]; [f1 = F1] e [fr1 = Fr1].
Table 2. Sociodemographic characteristics in Pró-Saúde Study baseline, 1999-2001.
Variable Women Men Total
n % n % N %
Gender 1,739 55.8 1,378 44.2 3,117 100
Age (years)
24 to 34 281 16.2 307 22.3 588 18.9
35 to 44 765 44.0 623 45.2 1,388 44.5
45 to 54 541 31.1 367 26.6 908 29.1
55 to 65 152 8.7 81 5.9 233 7.5
Education level
Incomplete elementary schooling 102 5.9 125 9.1 227 7.3
Complete elementary schooling 90 5.2 97 7.0 187 6.0
Incomplete high school education 132 7.6 151 11.0 283 9.1
Complete high school education 358 20.6 311 22.6 669 21.5
Incomplete university education 235 13.5 204 14.8 439 14.1 Complete university education 478 27.5 321 23.3 799 25.6
DISCUSSION
The baseline population of EPS was observed to have a high prevalence of abdominal obesity, with an important difference when genders are compared. It was higher among women in all educational strata and age ranges. Gender inequality in the prevalence of abdominal obesity increases with older age and lower education levels, given its steeper direct association with older age in the female population, its inverse one with education levels among women, and not
statistically signiicant association among the men. SII
and RII summarized a uniform trend between educa-tion levels and abdominal obesity, and they described educational inequality in the occurrence of abdominal obesity among women.
Excess intra-abdominal fat has been particularly important to understand the consequences of obesity. Hypertrophy and hyperplasia of visceral adipocytes increase the risk of hypertriglyceridemia, insulin resis-tance, and atherosclerosis, regardless of body compo-sitions.19 In this sense, abdominal circumference has been observed to have a higher correlation with visceral adipose tissue, as compared to other anthropometric assessments for abdominal adiposity,4,24 being shown to be more informational when based on an under-lying biological argument. Nevertheless, differences regarding measuring techniques and thresholds may
inluence estimates for prevalence and association with
abdominal obesity. A limitation in this study regards to measuring abdominal circumference at the navel level, once the employed thresholds concern measurement at the midpoint between the last rib and the iliac crest.29
Socioeconomic position is a complex and
multidimen-sional construct, in which individuals are classiied by
being compared to other individuals, based on mate-rial and non-matemate-rial attributes.18 Frequently used socioeconomic position indicators: education, occu-pation, and income – each with its advantages and constraints.11,18 Even though they concern different epidemiological aspects, such indicators have generally pointed towards the same direction in the association with obesity.1,5,21 Notwithstanding, education repre-sents the assets regarding the knowledge of a person,11
which assumedly inluence ways of living and life
styles linked to obesity,26 and they also determine other socioeconomic position attributes, such as occupation and income.11,18
Frequent ways to operationalize education include years of schooling and education attainment. The continuous measurement assumes that each year of schooling similarly contributes to the socioeconomic position, and the categorical measurement assumes that formal education attainment are more relevant for the socioeconomic position than the time one spends with education.11
This study considered intermediate levels within a same educational attainment, based on the hypoth-esis that more time spent with education is relatively important for the association between socioeconomic position and abdominal obesity, which depends on the educational attainment that was reached. That distinc-tion was shown to be important in the distribudistinc-tion of female abdominal obesity in the variation spectrum of education levels.
The indices of inequality provided information that was opportune for longitudinal analyses regarding EPS, as well as for meta-analysis studies and comparisons of the degree of educational inequalities regarding
Figure. Educational inequality regarding abdominal obesity among multiple educational groups in the female population.
Pró-Saúde Study, 1999-2001.
Numerical score values
Strictly monotonous tren
d
Prevalence = 43.5 (95%CI 41.2;45.9) SII (%) = 40.8 (95%CI 32.8;48.8)
RII = 5.5 (95%CI 3.9;7.9) y = 1.2314 + 0.4079x
Population size Observed value Expected value
Cumulative relative frequency of the educational subgroups 0.00
0.099 0.335 0.540 0.711 0.852 0.916 0.971
0.198 0.473 0.608 0.814 0.890 0.942 1.00
Abdominal obesity (%)
100
80.0
60.0
40.0
20.0
0
= [(∑ fi + fk/2) ÷ N] k - 1
abdominal obesity among populations, geographical areas, and health indicators.16 Furthermore, ascribing ordinal values to the categories of polytomous vari-ables may produce quantitatively meaningless dosage-response curves, especially when those categories are internally heterogeneous.13
The indings in this research are shown to be in agree -ment with different cross-sectional and longitudinal studies in distinct populations.1,5,21,23 From early socioeconomic development stages, the association between socioeconomic position and obesity becomes predominantly inverse among women, but not among
men.5,21,23 In Brazil, time series analyses showed
increased prevalence and incidence of obesity, which is associated with lower education only in the female population,3,12 mainly in urban contexts and the most developed regions in the country.22,a A particularly consistent and inverse association between female socioeconomic position and abdominal obesity was found in population-based studies in Rio de Janeiro,15 Minas Gerais,10 Rio Grande do Sul,20 and Maranhao,27 especially regarding education, which thus reinforces
the proposition of social determination of general and abdominal obesity.
Socioeconomic position influences the individual access to goods and services regarding nutrition, physical activity, and other healthy practices,26 as well as environmental conditions which may influence the association between socioeconomic position and abdominal obesity. Groups of higher socioeconomic position tend to eat most nutritious foods, at least partly
due to their buying those foods more easily.6 They
also have higher access to weight-losing methods than
groups of lower socioeconomic position.25 Besides
that, socioeconomic position may cause an impact in attitudes towards one’s own body and in weight-losing practices, especially among women of higher socioeco-nomic position. They may be more inclined to making efforts towards leaner bodies, whereas obesogenic envi-ronments make it harder for women of lower socioeco-nomic position to do the same.21
Among men, the relationship between socioeconomic position and obesity is less clearly observed in medium Table 3. Prevalence (%) of abdominal obesity, slope index of inequality, and relative index of inequality of the female population. Pró-Saúde Study, 1999-2001.
Variable
Women Men Total
Abdominal
obesity (%) 95%CI pa
Abdominal
obesity (%) 95%CI pa
Abdominal
obesity (%) 95%CI pa Gender 43.5 41.2;45.9 24.3 22.1;26.7 35.0 33.3;36.7
Age (years) < 0.001 < 0.001 < 0.001
24 to 34 26.0 20.9;31.5 16.9 12.9;21.6 21.3 18.0;24.8 35 to 44 36.3 32.9;39.9 24.1 20.8;27.6 30.8 28.4;33.3 45 to 54 54.5 50.2;58.8 30.2 25.6;35.2 44.7 41.4;48.0 55 to 65 73.0 65.2;79.9 27.2 17.9;38.2 57.1 50.4;63.5
Education level < 0.001 0.436 < 0.001
Incomplete elementary schooling
72.5 62.8;80.9 24.0 16.8;32.5 45.8 39.2;52.5
Complete elementary schooling
67.8 57.1;77.2 23.7 15.7;33.4 44.9 37.6;52.3
Incomplete high school education
54.5 45.6;63.2 25.8 19.0;33.6 39.2 33.5;45.2
Complete high school education
50.3 45.0;55.6 26.0 21.2;31.3 39.0 35.3;42.8
Incomplete university education
42.5 36.1;49.1 27.9 21.9;34.6 35.8 31.3;40.4
Complete university education
33.3 29.0;37.7 18.4 14.3;23.1 27.3 24.2;30.5
Graduate studies 32.3 27.3;37.5 27.2 20.7;34.6 30.6 26.6;34.8 SII (%) 40.8 (32.8;48.8)b 24.0 (15.5;32.6)c – – – – – –
RII 5.5 (3.9;7.9)b 2.8 (1.9;4.1)c – – – – – –
SII: Slope Index of Inequality; RII: Relative Index of Inequality
a Chi-squared test for linear trend. b Crude SII and RII.
and high-income contexts. Most studies report not
statistically signiicant associations, the second most
frequent result of them being the direct association with income and other indicators of material assets.5,21 Heavier bodies may be valued differently among genders, and they may represent force and domination for men of higher socioeconomic position.21
A rising trend for obesity in association with low socioeconomic position among women in medium and high-income regions will increasingly drive rele-vant iniquities in different health conditions related to obesity.5,7,23 According to Ezzati et al,7 the ‘diseases of
afluence’ paradigm must be reconsidered. According
to Monteiro et al,23 food insecurity and high physical activity patterns became less common after a certain stage of economic development, even for more socially underprivileged segments.
The low percentage of non-respondents (< 5.0%) considerably contributed to the sample representa-tiveness. Regarding the inferential scope, the results in this study do not support generalization to the
general population, but they can properly relect the
current patterns in average urban layers of reason-able heterogeneity, as those are an economically active, regularly employed population. No important differences were found when the sociodemographic
characteristics of the studied population were compared with the adult population of employed workers in the municipality of Rio de Janeiro.8
So far, few studies aimed to examine the relation-ship between socioeconomic position and abdominal obesity, and not studies were found to describe the degree of educational inequality regarding abdom-inal obesity by applying indices of inequality in an
adult population in Brazil. Potential mediators of
that relationship, such as race/ethnicity, area of resi-dence, birth-related cohort, parity, and marital status, need yet to be explored in order to better understand educational inequality regarding abdominal obesity. In conclusion, the indices of inequality provided quantitative estimates that are indispensable for the monitoring of abdominal obesity and for the drafting of public policies.
ACKNOWLEDGMENTS
To professors Célia Landmann Szwarcwald, PhD, Gulnar Azevedo e Silva, PhD, and to Yara Hahr Marques Hökerberg, PhD, for the important comments
in the irst draft of the manuscript. To the members of Pró-Saúde Study team for their strong dedication in the
production of the data we used in our analyses.
1. Ball K, Crawford D. Socioeconomic status and weight change in adults: a review. Soc Sci Med. 2005;60(9):1987-2010. DOI:10.1016/j.socscimed.2004.08.056
2. Barros AJD, Victora CG. Measuring coverage in MNCH: determining and interpreting inequalities in coverage of maternal, newborn, and child health interventions. PLoS Med. 2013;10:e1001390. DOI:10.1371/journal.pmed.1001390
3. Conde WL, Borges C. O risco de incidência e persistência de obesidade entre adultos brasileiros segundo seu estado nutricional ao final da
adolescência. Rev Bras Epidemiol. 2011;14 Supl 1:71-9. DOI:10.1590/S1415-790X2011000500008
4. Després JP, Lemieux I, Prud’homme D. Treatment of obesity: need to focus on high risk abdominally obese patients. BMJ. 2001;322(7288):716-20. DOI:10.1136/bmj.322.7288.716
5. Dinsa GD, Goryakin Y, Fumagalli E, Suhrcke M. Obesity and socioeconomic status in developing countries: a systematic review. Obes Rev. 2012;13(11):1067-79. DOI:10.1111/j.1467-789X.2012.01017.x
6. Drewnowski A. Obesity, diets, and social inequalities. Nutr Rev. 2009;67 Suppl 1:S36-9. DOI:10.1111/j.1753-4887.2009.00157.x
7. Ezzati M, Vander Hoorn S, Lawes CMM, Leach R, James WPT, Lopez AD, et al. Rethinking the
“disease of affluence” paradigm: global patterns of nutritional risk in relation to economic development. PLoS Med. 2005;2(5):e133. DOI:10.1371/journal.pmed.0020133
8. Faerstein E, Lopes CS, Valente K, Solé-Plá MA, Ferreira MB. Pré-testes de um questionário multidimensional autopreenchível: a experiência do Estudo Pró-Saúde UERJ. Physis Rev Saude Coletiva. 1999;9(2):117-30. DOI:10.1590/S0103-73311999000200007
9. Faerstein E, Chor D, Lopes CS, Werneck GL. Estudo Pró-Saúde: características gerais e aspectos metodológicos. Rev Bras Epidemiol. 2005;8(4):454-66. DOI:10.1590/S1415-790X2005000400014
10. Freitas SN, Caiaffa WT, César CC, Faria VA, Nascimento RM, Coelho GLLM. Risco nutricional na população urbana de Ouro Preto, sudeste do Brasil: estudo de corações de Ouro Preto. Arq Bras Cardiol. 2007;88(2):191-9. DOI:10.1590/S0066-782X2007000200010
11. Galobardes B, Shaw M, Lawlor DA, Lynch JW, Smith GD. Indicators of socioeconomic position (part 1). J Epidemiol Community Health. 2006;60(1):7-12. DOI:10.1136/jech.2004.023531
12. Gigante DP, França GVA, Sardinha LMV, Iser BPM, Meléndez GV. Variação temporal na prevalência do excesso de peso e obesidade em adultos: Brasil, 2006 a 2009. Rev Bras Epidemiol. 2011;14 Supl 1:157-65. DOI:10.1590/S1415-790X2011000500016
13. Greenland S. Analysis of polytomous exposures and outcomes. In: Rothman KJ, Greenland S, Lash TL, editors. Modern epidemiolgy. 3.ed. Philadelphia: Lippincott Williams and Wilkins; 2008. p.303-27.
14. Harper S, Lynch J. Methods for measuring cancer disparities: using data relevant to Health People 2010 cancer-related objectives. Bethesda: National Cancer Institute; 2005.
15. Kac G, Velásquez-Meléndez G, Coelho MASC. Fatores associados à obesidade abdominal em mulheres em idade reprodutiva. Rev Saude Publica. 2001;35(1):46-51. DOI:10.1590/S0034-89102001000100007
16. Keppel K, Pamuk E, Lynch J, Carter-Pokras O, Kim I, Mays V, et al. Methodological issues in measuring health disparities. Vital Health Stat Series 2. 2005;(141):1-16.
17. Kramer CK, Zinman B, Retnakaran R. Are metabolically healthy overweight and obesity benign conditions?: a systematic review and
meta-analysis. Ann Intern Med. 2013;159(11):758-69. DOI:10.7326/0003-4819-159-11-201312030-00008
18. Krieger N, Williams DR, Moss NE. Measuring social class in US public health research: concepts, methodologies, and guidelines. Annu Rev Public Health. 1997;18:341-78. DOI:10.1146/annurev.publhealth.18.1.341
19. Lim S, Meigs JB. Ectopic fat and cardiometabolic and vascular risk. Int J Cardiol. 2013;169(3):166-76. DOI:10.1016/j.ijcard.2013.08.077
20. Linhares RS, Horta BL, Gigante DP, Dias-da-Costa JS, Olinto MTA. Distribuição de obesidade geral e abdominal em adultos de uma cidade no sul do Brasil. Cad Saude Publica.2012;28(3):438-48. DOI:10.1590/S0102-311X2012000300004
21. McLaren L. Socioeconomic status and obesity. Epidemiol Rev. 2007;29(1):29-48. DOI:10.1093/epirev/mxm001
22. Monteiro CA, Conde WL, Popkin BM. Independent effects of income and education on the risk of
obesity in the Brazilian adult population. J Nutr. 2001;13(3):881S-886S.
23. Monteiro CA, Moura EC, Conde WL, Popkin BM. Socioeconomic status and obesity in adult population of developing countries: a review. Bull World Health Organ. 2004;82(12):940-6. DOI:10.1590/S0042-96862004001200011
24. Neamat-Allah J, Wald D, Hüsing A, Teucher B, Wendt A, Delorme S, et al. Validation of anthropometric indices of adiposity against whole-body magnetic resonance imaging: a study within the German European Prospective Investigation into Cancer and Nutrition (EPIC) cohorts. PLoS One. 2014;9(3):e91586. DOI:10.1371/journal.pone.0091586. eCollection 2014
25. Salles-Costa R, Werneck GL, Lopes CS, Faerstein E. Associação entre fatores sócio-demográficos e prática de atividade física de lazer no Estudo Pró-Saúde. Cad Saude Publica. 2003;19(4):1095-105. DOI:10.1590/S0102-311X2003000400031
26. Sobal J. Obesity and socioeconomic status: a framework for examining relationships between physical and social variables. Med Anthropol. 1991;13(3):231-47. DOI:10.1080/01459740.1991.9966050
27. Veloso HJF, Silva AAM. Prevalência e fatores associados à obesidade abdominal e ao excesso de peso em adultos maranhenses. Rev Bras Epidemiol. 2010;13(3):400-12. DOI:10.1590/S1415-790X2010000300004
28. World Health Organization. Obesity: preventing and managing the global epidemic: report of a WHO Consultation. Geneva; 2000. (WHO Technical Report Series, 894).
29. World Health Organization. Waist circumference and waist-hip ratio: report of a WHO expert consultation. Geneva; 2011.
30. World Health Organization. Handbook on health inequality monitoring: with a special focus on low- and middle-income countries. Geneva; 2013.
This study was supported by Conselho Nacional de Desenvolvimento Científico e Tecnológico (CNPq – Process 484636/2013-8) and Fundação de Amparo à Pesquisa do Estado do Rio de Janeiro (FAPERJ – Grade 10 research grant, Master’s – Process 100,489/2013). Based on the master’s essay by Ronaldo Fernandes Santos Alves, titled: “Desigualdade socioeconômica e obesidade abdominal: uma apreciação crítica e pragmática em epidemiologia”, which was presented in the Graduate Program in Collective Health of the Instituto de Medicina Social of the Universidade do Rio de Janeiro, in 2014.
This study was presented at the 9th Edition of Brazilian Epidemiology Congress, in Vitória, Espírito Santo state, in 2014.