ABSTRACT: Objective: To quantify the antioxidant consumption (vitamins A, C and E and minerals selenium and zinc) and to identify factors associated to low consumption of these nutrients. Methods: Cross-sectional study with 14,660 participants (35 to 74 years-old) investigated in the Brazilian Longitudinal Study of Adult Health (ELSA-Brasil) baseline. Consumption of antioxidants and energy was determined by a Food Frequency Questionnaire and analyzed using the NDSR software. Antioxidant consumption was adjusted to total energy and divided in quintiles. A logistic regression analysis was used to identify socioeconomic factors associated with low intake of these nutrients. Results: Consumption of energy (kcal/day) was higher in men (3,152 ±
1,026 versus 2,613 ± 905; p < 0.001) whereas the consumption of all antioxidants (mainly vitamins A and E and selenium) was higher in females. Low antioxidant consumption was associated to male sex (OR = 3.5; 95%CI 3.11 – 4.0) and to lower education (OR = 3.1; 95%CI 2.42 – 3.87), income (OR = 4.4; 95%CI 3.67 – 5.36) and age (OR = 5.5; 95%CI 4.27 – 7.16), as well as to thinness (OR = 2.7; 95%CI 1.36 – 5.18) and when participants did not reported the use of supplements (OR = 1.95; 95%CI 1.6 – 2.38) or change of eating habits in the last six months (OR = 2.0; 95%CI 1.75 – 2.29). Conclusion: The greater intake of fruits and vegetables is likely to be involved in the higher consumption of antioxidants in females. General policies to increase the consumption of such nutrients should be directed to groups of lower income, education and age.
Keywords: Antioxidants. Nutrients. Food consumption. Socioeconomic factors. Longitudinal studies. Logistic models.
Dietary intake of antioxidant in ELSA-Brasil
population: baseline results
Consumo de antioxidantes em participantes do ELSA-Brasil:
resultados da linha de base
Marina Galvão TeixeiraI, José Geraldo MillI,Alexandre Costa PereiraII, Maria del Carmen Bisi MolinaI
IUniversidade Federal do Espírito Santo – Vitória (ES), Brazil. IIUniversidade de São Paulo – São Paulo (SP), Brazil.
Corresponding author: Maria del Carmen Bisi Molina. Avenida Marechal Campos, 1468, Maruípe, CEP: 29040-090, Vitória, ES, Brasil. E-mail: [email protected]
Conlict of interests: nothing to declare – Financial support: Ministry of Health (Decit – Science and Techonology Department)
and Ministry of Science and Techonology (Finep – Financier of Studies and Projects and CNPq – National Council for Scientiic
and Techonological Development, Processes Nos. 01 06 0010.00 RS, 01 06 0212.00 BA, 01 06 0300.00 ES, 01 06 0278.00 MG, 01 06 0115.00 SP, 01 06 0071.00 RJ).
INTRODUCTION
Free radicals are produced continuously in the body, being kept within the normal limits by inactivation and removal procedures. Imbalance in these procedures may be generated either by an increase in production and by insuicient removal. An imbalance in the proo-xidant/antioxidant balance results in the increase of oxidative stress, in which the excess of oxygen reactive species may determine cell damage1. In turn, the increased oxidative stress
is related to the development and worsening of many chronic diseases, such as diabetes, cardiovascular diseases, obesity, and cancer2, which have great impact in the current
stan-dard of Brazilian morbidity and mortality3.
The dietary intake of antioxidant nutrients, specially through the consumption of fruit and vegetable, may reduce the oxidative stress, once they are able to eliminate free radicals in a direct way, as is the case of vitamins, or in an indirect way, through minerals, which acts as cofactors of antioxidant enzymes4,5.
A diet rich in fruit and vegetable and, consequently, in antioxidant nutrients is recommended as a part of a healthy diet; however, more than 90% of the Brazilian population has lower con-sumption of daily servings than the recommended one for those foods. Besides, the frequency of intake of fruit and vegetable is positively associated with income, and school education positively inluences the percentage of individuals who reach the recommended intake of these foods6.
The Brazilian Longitudinal Study of Adult Health (ELSA-Brasil) has the objective of identifying the determinants of incidence of chronic disease in the Brazilian population,
RESUMO:Objetivo: Avaliar o consumo habitual de antioxidantes (vitaminas A, E e C, selênio e zinco) e identiicar fatores associados ao baixo consumo em adultos. Métodos: Estudo transversal com 14.660 participantes (35 a 74 anos) da linha de base do Estudo Longitudinal de Saúde do Adulto (ELSA-Brasil). O consumo de antioxidantes e energia total foi determinado por Questionário de Frequência Alimentar e analisado com auxílio do software NDSR. O consumo dos antioxidantes foi ajustado pela energia total e dividido em quintis. Variáveis socioeconômicas foram analisadas e incluídas no modelo de regressão logística para identiicar fatores associados ao baixo consumo.
Resultados: O consumo energético (kcal/dia) foi maior em homens (3.152 ± 1.026 versus 2.613 ± 905; p < 0,001) enquanto que o consumo de todos os antioxidantes (principalmente as vitaminas A e C e o selênio) foi maior em mulheres. O baixo consumo de antioxidantes se associou signiicativamente ao sexo masculino (OR = 3,5; IC95% 3,11 – 4,0), à menor escolaridade (OR = 3,1; IC95% 2,42 – 3,87), à menor renda (OR = 4,4; IC95% 3,67 – 5,36), à menor faixa etária (OR = 5,5; IC95% 4,27 – 7,16), ao estado de magreza (OR = 2,7; IC95% 1,36 – 5,18), ao relato do não uso de suplemento (OR = 1,95; IC95% 1,6 – 2,38) como polivitamínicos e minerais e a não alteração de hábitos alimentares nos últimos seis meses (OR = 2,0; IC95% 1,75 – 2,29). Conclusão: O maior consumo de frutas e legumes está envolvido no maior consumo de antioxidantes em mulheres. As políticas para aumento do consumo desses nutrientes precisam ser dirigidas para os segmentos de menores renda, escolaridade e faixa etária.
focusing mainly on diabetes and cardiovascular diseases7. Considering that the dietary pattern
has a strong inluence on the development of many chronic diseases8,9 and that
the oxida-tive stress seems to mediate part of this inluence, our objecthe oxida-tive was to quantify the intake of antioxidant nutrients (vitamins A, E, and C and the minerals selenium and zinc) and to identify the factors associated with this intake in the baseline of ELSA-Brasil.
METHODS
It is a data analysis of participants included in the baseline of ELSA-Brasil, in the period from 2008 to 2010. The cohort consisted of 15,105 adults of both genders and aged between 35 and 74 years, all active workers or retired persons from 6 higher education and research institutions located in 6 Brazilian states (Rio Grande do Sul, São Paulo, Rio de Janeiro, Minas Gerais, Espírito Santo, and Bahia). The overall data collection and the general description of the cohort were published previously7,10. The data regarding school education, income,
use of supplements, and change of dietary habits within the last 12 months were obtained in an interview. The per capita income was estimated by the information of the approxi-mate net family income in the month before the interview and the number of people who depend on it. Weight and height were measures during clinical tests7, and the nutritional
status of the patient was determined by the body mass index (BMI; kg/m2) and classiied
according to the recommendations by the World Health Organization11. The categories of
overweight and obesity (excess of weight) were grouped together.
The usual dietary intake of participants was obtained by the Food Frequency Questionnaire (FFQ) developed and validated for this purpose12,13. The FFQ ELSA-Brasil is a
semiquanti-tative questionnaire consisting of 114 items, whose objective is to evaluate the usual intake within the last 12 months. The daily intake of nutrients and calories was estimated with the help of the Nutrition Data System for Research(NDSR) software. The extreme values of consumption (over 99%) were substituted by the exact value of 99%. In addition to that, when the participant, voluntarily, reported the seasonal consumption of any item/food or drink, the total value of daily consumption of this food was multiplied by 0.25.
This study excluded individuals who did not have all dietary data or who did not reveal plausible daily caloric intake (< 500 or > 6,000 kcal)14. The daily intake of antioxidant
nutri-ents was adjusted by energy according to the method proposed by Willett15 and categorized
into quintiles. A variable representing the total antioxidant consumption was also created, given by the sum of intake quintiles of ive nutrients (Total antioxidant intake = Quintile Vit A + Quintile Vit C + Quintile Vit E + Quintile Zn + Quintile Se). Thus, this variable took over values between 5 and 25, also being analyzed according to the distribution of quintiles.
The statistical analysis was performed by the SPSS 19.0 software. The Kolmogorov– Smirnov test was used to verify the normality of the quantitative variables. Parametric or nonparametric bicaudal tests were applied when necessary. The signiicance level was established for p < 0.05. The χ2 test was used to compare the categorical variables.
Kruskal–Wallis in the comparison of means of three or more groups. The logistic regres-sion was used to test the hypothesis of association between the consumption of antioxidants and the socioeconomic variables and BMI.
The ELSA-Brasil was approved by the Research Ethics Committee of each institution where the project is being carried out. All participants signed the informed consent before data collection.
RESULTS
The analysis excluded 445 participants (2.9% of the sample) owing to the absence of com-plete data. Table 1 shows the sociodemographic and BMI variables, according to gender. The sample consisted of 44.8% of men and 55.2% of women (mean age = 52 ± 9 years). As for race/color, 53% subjects were self-reported as Caucasian/white; 8.1% of participants were retired at the moment of the collection (data not presented in the table). Regarding school education, 12.3% were educated up to full elementary school education, 34.1% up to com-plete high school education, and 53.6% up to full high education. The mean per capita income was R$ 1,768 ± 1,448. In the studied sample, the male gender showed higher percentage in the category of lower school education, lower percentage among the eutrophics, as those who reported use of supplements, and among those who reported changes in their eating habits. About 31% of the studied population reported changes in their eating habits; of those, 61% were women, approximately 72% of them were overweight, and 55% of them were educated up to full college degree. The change of habits was related to the per capita income (p = 0.029) (data not presented in the table).
Even though the data of nutrient intake used in this study refer only to dietary intake, it is important to highlight that there was a reference on the use of multivitamins or minerals, which may interfere in the available organic quantity of nutrients. The regular use was reported by 13.1% and the nonregular use by 9.7% of the sample, totaling 3,302 participants (22.5% of the sample). The mean daily caloric intake of the sample was 2,855 ± 998 kcal, with signiicant difer-ence between the genders. When compared with the energetic consumption of antioxidant nutrients between men and women, a higher energy intake and lower means of antioxi-dant intake among men (Table 2) were observed. The intake of all antioxiantioxi-dants was higher among women than among men, with the largest diferences observed for vitamins A and C, 18 and 25% and more among women, respectively.
*Mann–Whitney test; SD: standard deviation.
Table 2. Mean and standard deviation of energy and antioxidant nutrietns adjusted by energy, according to gender (ELSA-Brasil, 2008 – 2010).
Energy and nutrients
Gender
p-value*
Male Female
Mean (SD) Mean (SD)
Energy (kcal) 3,152 (1,026) 2,613 (905) <0.001
Vitamin A (μcg) 973 (421) 1,152 (465) <0.001
Vitamin C (mg) 283 (169) 353 (187) <0.001
Vitamin E (mg) 11.3 (5.3) 12.2 (5.5) <0.001
Selenium (μg) 217 (109) 227 (121) <0.001
Zinc (mg) 15.6 (3.9) 15.8 (4.0) <0.001
Variable
Gender
Total p-value*
Male Female
n (%) n (%)
Age range (years) < 0.001
35 – 45 1,769 (46.2) 2,058 (53.8) 3,827
46 – 55 2,489 (43.5) 3,233 (56.5) 5,722
56 – 65 1,651(43.4) 2,154 (56.6) 2,154
66 – 74 665 (50.9) 641 (49.1) 1,306
School education < 0.001
Up to complete elementary school 1,054 (58.4) 750 (41.6) 1,804
Up to complete high school 2,105 (42.1) 2,894 (57.9) 4,999
College degree 3,415 (43.5) 4,442 (56.5) 7,857
Change in eating habits** < 0.001
Yes 1,769 (39.0) 2,765 (61.0) 4,534
No 4,799 (47.5) 5,312 (52.5) 10,111
Use of supplements < 0.001
Yes 614 (32.4) 1,281 (67.6) 1,895
No 5,869 (46.7) 6,704 (53.3) 12,573
Per capita income < 0.001
1st quintile 2,245 (47.7) 2,465 (52.3) 4,710 2nd quintile 2,001 (42.8) 2,677 (57.2) 4,678 3rd quintile 2,306 (44.2) 2,914 (55.8) 5,220 Nutritional status
Underweight 60 (45.1) 73 (54.9) 133 < 0.001
Eutrophic 2,171 (41.3) 3,088 (58.7) 5,259
Excess of weight 4,340 (46.9) 4,922 (53.1) 9,262
*Regarding the χ2 test; **reporting of change of eating habits within the last 6 months. The total values of the groups
may vary owing to missing data.
Nutrient Quintiles of intake p-value*
1 2 3 4 5
Vitamin A
Age (years) 50 (8.6) 51 (8.9) 52 (9.0) 53 (9.2) 54 (9.1) < 0.001
Mean intake (µg) 550 (125) 813 (56) 1004 (57) 1229 (77) 1762 (400) < 0.001
Male gender (%) 61 50 44 37 31 < 0.001
Per capita income (R$) 1,432 (1,232) 1,709 (1439) 1,786 (1411) 1,903 (1472) 2,009 (1593) < 0.001
High education** (%) 42 53 55 60 58 < 0.001
Use of supplement (%) 8.4 11 13 14 18 < 0.001
Vitamin C
Age 50 (8.6) 51 (8.9) 52 (9.2) 53 (9.0) 55 (9.0) < 0.001
Mean intake (mg) 114 (37.0) 207 (22.6) 288 (24.6) 389 (35.1) 608 (138) < 0.001
Male gender (%) 61 51 43 37 32 < 0.001
Per capita income (R$) 1,523 (1,296) 1,707 (1,407) 1,849 (1,486) 1,889 (1,488) 1,874 (1,518) < 0.001
High education** (%) 47 54 57 57 52 < 0.001
Use of supplement (%) 9.8 11 14 15 15 < 0.001
Vitamin E
Age 50 (8.8) 51 (8.7) 52 (9.1) 53 (9.1) 54 (9.2) < 0.001
Mean intake (mg) 7.0 (0.8) 8.9 (0.4) 10 (0.5) 13 (0.8) 20 (7.0) < 0.001
Male gender (%) 57 49 41 40 38 < 0.001
Per capita income (R$) 1,391 (1,209) 1,578 (1,292) 1,803 (1,442) 1,985 (1,550) 2,083 (1,594) < 0.001
High education** (%) 42 51 55 60 60 < 0.001
Use of supplement (%) 7.6 10.7 13.6 15.6 18 < 0.001
Quintile of total intake of antioxidants
p-value*
1 2 3 4 5
Age (years) 50 (8.4) 51 (8.8) 52 (9.1) 53 (9.2) 55 (9.0) < 0.001
Per capita income (R$) 1,244 (1,065) 1,471 (1,205) 1,771 (1,449) 2,012 (1,552) 2,331 (1,627) < 0.001
Male gender (%) 61 50 46 37 31 < 0.001
High education** (%) 36 46 53 62 70 < 0.001
Excess of weight (%) 60 64 64 64 62 < 0.001
Use of supplements (%) 6.5 10 11 17 20 < 0.001
Change in eating habits (%) 22 29 31 35 37 < 0.001
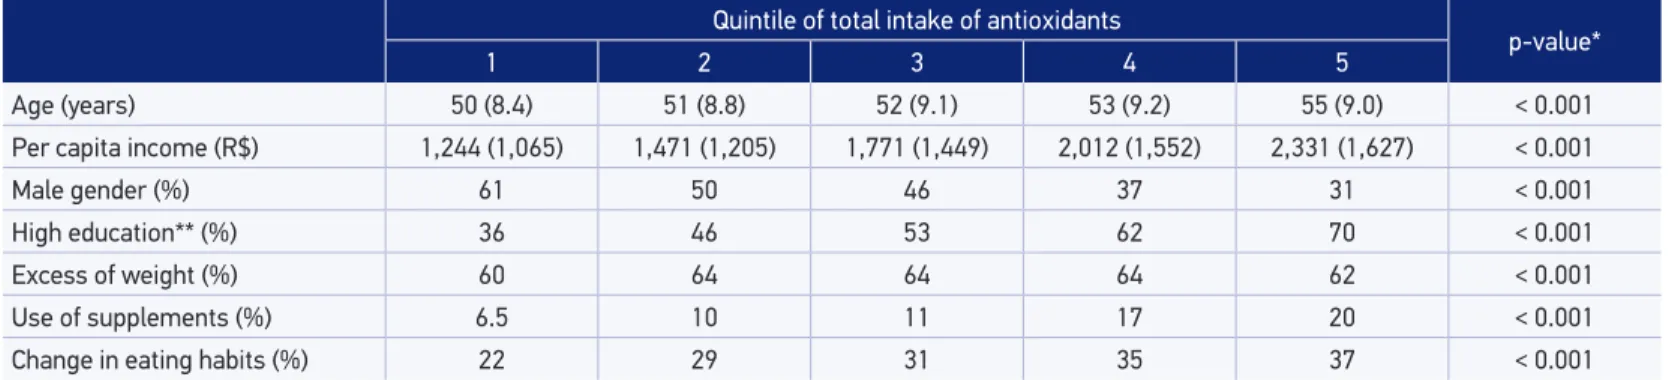
*Regarding the Kruskal–Wallis and χ2 tests; **regarding the category: college + graduate degrees. The continuous values are related to the means and standard deviations of the quintiles. Table 4. Socioeconomic and health variables according to the quintiles of intake of antioxidant nutrients (ELSA-Brasil, 2008 – 2010).
*Kruskal–Wallis and χ2 test; **regarding the category: college + graduate degree. The continuous values are related to the means in the quintiles.
Table 3. Continuation.
Nutrient Quintiles of intake p-value*
1 2 3 4 5
Selenium
Age 52 (8.9) 51 (8.8) 51 (9.0) 52 (9.2) 54 (9.3) < 0.001
Mean intake (µg) 136 (14.5) 166 (6.6) 190 (7.5) 224 (13.3) 397 (158) < 0.001
Male gender (%) 38 46 47 42 41 < 0.001
Per capita income (R$) 1,269 (1,087) 1,460 (1,252) 1,661 (1,343) 1,969 (1,485) 2,481 (1,679) < 0.001
High education** (%) 32 44 52 63 77 < 0.001
Use of supplement (%) 8.2 10.2 11.4 14.8 20.8 < 0.001
Zinc
Age 52 (9.0) 52 (9.0) 52 (9.0) 52 (9.3) 52 (9.2) 0.074
Mean consumption (mg) 12 (1.1) 14 (0.4) 15 (0.4) 17 (0.6) 22 (4.4) < 0.001
Male gender (%) 47 48 44 41 42 < 0.001
Per capita income (R$) 1,442 (1,277) 1,714 (1,402) 1,810 (1,476) 1,923 (1,492) 1,949 (1,519) < 0.001
High education** (%) 40 51 58 61 30 < 0.001
growing when comparing each quintile with the previous one in the case of selenium, and there was no inluence in relation to zinc intake.
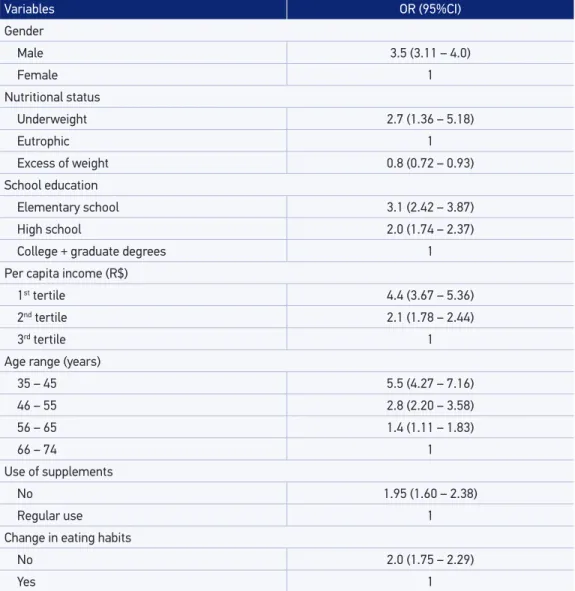
Table 4 shows the socioeconomic and health variables according to the quintiles of the vari-able “total intake of antioxidants.” A clear increased intake according to age, income, education, use of supplements, and the reporting of changed eating habits was observed. The participa-tion of men decreases with the increasing consumpThe participa-tion quintile. Table 5 shows the results of the logistic regressions, in which the ifth quintile of antioxidant intake was the reference cat-egory, and the results presented are for the irst quintile (low intake). Men have 3.5 times more chances of belonging to the lowest antioxidant intake category, similar to individuals with low
Variables OR (95%CI)
Gender
Male 3.5 (3.11 – 4.0)
Female 1
Nutritional status
Underweight 2.7 (1.36 – 5.18)
Eutrophic 1
Excess of weight 0.8 (0.72 – 0.93)
School education
Elementary school 3.1 (2.42 – 3.87)
High school 2.0 (1.74 – 2.37)
College + graduate degrees 1
Per capita income (R$)
1st tertile 4.4 (3.67 – 5.36)
2nd tertile 2.1 (1.78 – 2.44)
3rd tertile 1
Age range (years)
35 – 45 5.5 (4.27 – 7.16)
46 – 55 2.8 (2.20 – 3.58)
56 – 65 1.4 (1.11 – 1.83)
66 – 74 1
Use of supplements
No 1.95 (1.60 – 2.38)
Regular use 1
Change in eating habits
No 2.0 (1.75 – 2.29)
Yes 1
*Reference category: ith quintile (high intake of antioxidants).
education (3.1 times) and to those classiied in the irst income tertile (4.4 times). The low anti-oxidant intake was also associated with the youngest age ranges and low weight. Those who did not report using supplements or having changed their eating habits also revealed higher chances of belonging to the group with the lowest antioxidant intake.
DISCUSSION
The consumption of antioxidant nutrients was higher among women, among individuals of higher age range, and among those with higher education and income. In addition to that, there was a positive relation with the use of supplements and with changes in the eating habits.
Xun et al.16 found a positive relation between education and the concentrations of
sele-nium in the ingernails of African Americans; a similar result was found in this study regarding selenium intake, for a mixed/multiracial population. In relation to the consumption of zinc, the ELSA-Brasil population showed a mean above the one veriied by Sun et al.17 in a
longitudinal study (data from the Nurse’s Health Study). There, the irst quintile revealed mean dietary intake of zinc of 2.7 mg/day and the ifth quintile of 10.7 mg/day, while in this study, the means of the irst and the ifth quintile were 12 and 22 mg/day, respectively. In a study investigating the intake of antioxidants in the American population18,
research-ers found means of daily dietary intake of vitamins C and E and selenium lower compared with those found in this study. In the same study, the nutritional state (BMI) showed a direct relation to the consumption of selenium and an inverse relation to the dietary intake of vita-mins C and E. In this study, the BMI category “underweight” showed an inverse association with the total consumption of antioxidants; however, the “excess weight” (overweight and obesity) showed a positive association with the total consumption of antioxidants. Similar to the indings in the ELSA-Brasil cohort, the highest intake of antioxidants from diet belonged to the highest age range and income.
The diference found between the Brazilian and the American studies may be related to the dietary composition of the cultures investigated, as the instrument used in the studies was the same (QFA), although each of them adapted to the eating habits of each group. Besides, the characteristics of the populations chosen in each study may justify these difer-ences, including age range, education, and income, because that, as shown in these works, these characteristics are associated with a broad variation of antioxidant intake. ELSA-Brasil reveals a wide age range, beginning with adults from 35 years of age and onward; on the other hand, in the study by Chun et al.18, the lowest age was 19 years.
An association between low antioxidant intake and the BMI categories (underweight and excess weight) occurred, possibly, owing to the characteristic association of caloric consumption of these groups. The positive relation of the use of supplements and the reports of changed eat-ing habits with the consumption of antioxidants may relect in behavior of greater health care.
relation of intake of these food with income21 and age22. Wyndels et al.23 found in a sample
of French population a direct relation of the income tax rate with the joining to the national nutrition program of the country, regardless of geographical factors.
In a literature review on the socioeconomic status (which considered education, income, and occupation) and the intake and/or nutritional status of micronutrients in the European popu-lation, it was found that the lowest intake values were in the category of low socioeconomic levels. Education presented greater efect in the relation of socioeconomic status and intake, which may be owing to the education level determining income and occupation and, more-over, it may interfere in the understanding and carrying out of eating behaviors to reduce risk24.
The design used in this study showed limitation characteristics of cross-sectional studies, owing to nontemporal monitoring of the individuals, limiting the control of the behavioral variables25. The use of the instrument for dietary data collection (QFA) also revealed
lim-itations, as the collection included what the researcher wished to cover for the measuring and the time of collection, up to the conversion into “nutrient intake” per gram, may over-estimate the individual consumption26,27.
However, some procedures were carried out in order to minimize the possible mistakes in answers: there were previous and periodic trainings of the interviewers for the correct approach; during the interview, a kit of tools in order to facilitate the identiication of por-tion sizes was used; a response card with the oppor-tions on frequency of intake was handed to the patients in order to facilitate choice, without need for memorization.
In this study, the low intake of antioxidants was associated with the following condi-tions: male gender, low education, higher income, younger age ranges, underweight BMI, absence of use of supplement, or change in eating habits within the last 6 months. It may be concluded that the actions of nutritional education focused on the increase of food rich in antioxidant nutrients intake must be directed speciically to the groups with the speciic characteristics of low antioxidant intake.
CONCLUSION
The total antioxidant intake was positively associated with the female gender, higher age range, income, and education, a higher prevalence of excess of weight, use of supplements, and change in eating habits within the last 6 months.
REFERENCES
1. Ferrari CK, Torres EA. Biochemical pharmacology of functional foods and prevention of chronic diseases of aging. Biomed Pharmacother 2003; 57(5-6): 251-60.
3. Schmidt MI, Duncan BB, Silva GA, Menezes AM, Monteiro CA, Barreto SM, et al. Doenças crônicas não transmissíveis no Brasil: carga e desaios atuais. Lancet 2011; 377(9781): 1949-61.
4. Alissa EM, Ferns GA. Functional foods and nutraceuticals in the primary prevention of cardiovascular diseases. J Nutr Metab 2012; article ID 569486.
5. Vasconcelos SML, Goulart MOF, Silva MAM, Gomes ACM. Hipótese oxidativa da hipertensão arterial: uma minirrevisão. Rev Bras Hipertens 2007; 14(4): 269-74.
6. Instituto Brasileiro de Geograia e Estatística. Pesquisa de Orçamentos Familiares 2008-2009: análise do consumo alimentar pessoal no Brasil. Rio de Janeiro: IBGE; 2011.
7. Aquino EM, Barreto SM, Bensenor IM, Carvalho MS, Chor D, Duncan BB, et al. Brazilian Longitudinal Study of Adult Health (ELSA-Brasil): objectives and design. Am J Epidemiol 2012; 175(4): 315-24.
8. Millen BE, Quatromoni PA, Pencina M, Kimokoti R, Nam BHO, Kozak W, et al. Unique dietary patterns and chronic disease risk proiles of adult men: the Framingham Nutrition Studies. J Am Diet Assoc 2005; 105(11): 1723-34.
9. Neumann AICP, Martins IS, Marcopito LF, Araujo EAC. Padrões alimentares associados a fatores de risco para doenças cardiovasculares entre residentes de um município brasileiro. Rev Panam Salud Publica 2007; 22(5): 329-39.
10. Schmidt MI, Duncan BB, Mill JG, Lotufo PA, Chor D, Barreto SM, et al. Cohort proile: Longitudinal Study of Adult Health (ELSA-Brasil). Int J Epidemiol 2015; 44(1): 68-75.
11. World Health Organization. Physical status: the use and interpretation of anthropometry. Report of a WHO Expert Committee. WHO Technical Report Series 854. Geneva: WHO; 1995. Disponível em: http://whqlibdoc.who.int/trs/WHO_TRS_854.pdf (Acessado em: 11 de dezembro de 2013).
12. Molina MCB, Faria CP, Cardoso LO, Drehmer M, Velasquez-Meléndez JG, Gomes ALC, et al. Avaliação da dieta no Estudo Longitudinal de Saúde do Adulto (ELSA-Brasil): desenvolvimento do Questionário de Frequência Alimentar. Rev Nutr 2013; 26(2): 167-76.
13. Molina MCB, Bonseñor IM, Cardoso LO, Velasquez-Melendez G, Drehmer M, Pereira TSS, et al. Reprodutibilidade e validade relativa do questionário de frequência alimentar do ELSA-Brasil. Cad Saúde Pública 2013: 29(2): 379-89.
14. Andrade RG, Pereira RA, Sichieri R. Consumo alimentar de adolescentes com e sem sobrepeso do município do Rio de Janeiro. Cad Saúde Pública 2003; 19(5): 1485-95.
15. Willett WC, Howe GR, Kushi LH. Adjustment for total energy intake in epidemiologic studies. Am J Clin Nutr 1997; 65(Suppl 4): 1220S-8S.
16. Xun P, Bujnowski D, Liu K, Morris JS, Guo Z, He K. Distribution of toenail selenium levels in young adult Caucasians and African Americans in the United States: the CARDIA Trace Element Study. Environ Res 2011; 111(4): 514-9.
17. Sun Q, van Dam RMV, Willett WC, Hu FB. Prospective study of zinc intake and risk of type 2 diabetes in women. Diabetes Care 2009; 32(4): 629-34.
18. Chun OK, Floegel A, Chung SJ, Chung CE, Song WO, Koo SI. Estimation of antioxidant intakes from diet and supplements in U.S. Adults. J Nutr 2010; 140(2): 317- 24.
19. Estaquio C, Druesne-Pecollo N, Latino-Martel P, Dauchet L, Hercberg S, Bertrais S. Socioeconomic diferences in fruit and vegetable consumption among middle-aged French adults: adherence to the 5 A Day recommendation. J Am Diet Assoc 2008; 108(12): 2021-30.
20. Hulshof KFAM, Brussaard JH, Kruizinga AG, Telman J, Löwik MRH. Socio-economic status, dietary intake and 10 y trends: the Dutch National Food Consumption Survey. Eur J Clin Nutr. 2003; 57(1): 128-37.
21. Giskes K, Turrell G, Patterson C, Newman, B. Socioeconomic diferences among Australian adults in consumption of fruit and vegetables and intakes of vitamins A, C and folate. J Hum Nutr Diet 2002; 15(5): 375-85.
22. Strain JJ, Elwood PC, Davis A, Kennedy O, Coulter J, Fehily A, et al. Frequency of fruit and vegetable consumption and blood antioxidants in the Caerphilly cohort of older men. Eur J Clin Nutr 2000; 54(11): 828-33.
23. Wyndels K, Dallangeville J, Simon C, Bongard V, Wagner A, Ruidavets JB, et al. Regional factors interact with educational and income tax levels to inluence food intake in France. Eur J Clin Nutr 2011; 65(9): 1067-75.
24. Navakovic R, Cavelaars A, Geelen A, Nikolic M, Altaba II, Viñas BR, et al. Socio-economic determinants of micronutrient intake and status in Europe: a systematic review. Public Health Nutr 2014; 17(5): 1031-45.
25. Klein CH, Bloch KV. Estudos seccionais. In: Medronho RA, Bloch KV, Luiz RR, Werneck GL. Epidemiologia. São Paulo: Atheneu; 2004. p. 125-9.
26. Pereira RA, Sichieri R. Métodos de avaliação do consumo de alimentos. In: Kac G, Sichieri R, Gigante DP. Epidemiologia nutricional. Rio de Janeiro: Editora Fiocruz/Atheneu; 2007. p. 181-200.
27. Willett WC. Nutritional epidemiology. 2 ed. Oxford: OUP; 1998. p. 74-147.
Received on: 01/08/2015