286 Sao Paulo Med J. 2015; 133(4):286-9
EDITORIAL
DOI: 10.1590/1516-3180.2015.13340308Lifestyles and chronic non-transmissible diseases of the
Brazilian population according to the National Health
Survey: balance of the main results
Estilos de vida e doenças crônicas não transmissíveis da população brasileira
segundo a Pesquisa Nacional de Saúde: um balanço dos principais resultados
Deborah Carvalho Malta
I, Célia Landmann Szwarcwald
IIMinistério da Saúde, Brasília, Brazil
he National Health Survey (Pesquisa Nacional de Saúde, PNS) involved a partnership between the Ministry of Health and the Brazilian Institute for Geography and Statistics (Instituto Brasileiro de Geograia e Estatística, IBGE) and forms the most extensive health survey ever con-ducted in Brazil.1 Preparation of the PNS began in 2009, with participation from researchers and
representatives of the technical sectors of the Ministry of Health, in a wide-ranging consultation process. Over subsequent years, the survey was prepared and managed, including implementation of measures such as ensuring resources from the Ministry of Health, creation of the partnership with the IBGE to conduct the PNS, deinition of the scope of the research, sampling, reviewing the literature, deinition of questionnaires and purchasing of equipment, among other activities.1-4
In 2012, tests were applied to the questionnaire and a pilot study was conducted. In 2013, the study was approved by the National Research Ethics Committee (CONEP). In July 2013, training for ield personnel was conducted. In August 2013, the ieldwork started, with a duration of six months. he PNS involved more than 1000 IBGE technicians, who gathered data in 1600 Brazilian municipalities. he irst results were released in December 2014, and these related to lifestyle, self-perceived health, and chronic diseases. his led to production of the irst thematic edition of the “Revista Epidemiologia e Serviços de Saúde” (volume 24, number 2, Brasília, June 2015); and an article currently underway will seek to make a synthesis of these irst analyses in the irst thematic edition of that journal on the PNS.2-4
he PNS is a household-based cross-sectional study, with sampling stratiied into three clus-ter stages. Census tracts formed the primary sampling units; households were the second-stage units, and the adults in these households (18 years of age and over) were the third-stage units. Information on 64,348 households was gathered, and 60,202 people living in these households were drawn and then interviewed. he sample size took into consideration the level of precision desired for the estimates of some indicators at diferent levels of group subdivision and popu-lation groups. Sampling weights were deined. he interviews were conducted using personal digital assistance (PDA) devices, which are handheld computers containing sotware appropri-ate for critically assessing the variables.1-3
he PNS questionnaire on lifestyles encompassed questions on the following two topics: dietary pattern and physical activity and tobacco and alcoholic drink consumption. he ques-tionnaire on chronic diseases included topics such as hypertension, diabetes, cardiovascular diseases, respiratory diseases, mental diseases, depression, chronic kidney disease and cancer, among others. Anthropometric data and arterial blood pressure measurements were also gath-ered from all the adults selected. Biochemical tests were performed on a subsample.4
In relation to lifestyles among the Brazilian population, the markers of a healthy diet5 were
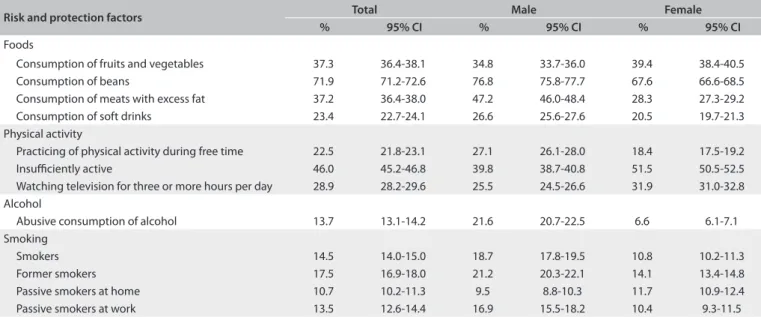
regular consumption of beans (ive or more times a week), which was reported by 71.9% (95% conidence interval, 95% CI: 71.2-72.6); consumption of fruit and vegetables ive times a day, reported by 37.3% (95% CI: 36.4-38.1); and consumption of ish once a week, reported by 54.6%
IMD, PhD. Director, Department of
Non-transmissible Disease and Disorder Surveillance, Department of Health Surveillance, Ministry of Health, Brasília, Federal District; and Professor and Researcher, Universidade Federal de Minas Gerais, Belo Horizonte, Minas Gerais, Brazil.
IIPhD. Professor and Researcher, Institute of
Lifestyles and chronic non-transmissible diseases of the Brazilian population according to the National Health Survey: balance of the main results | EDITORIAL
Sao Paulo Med J. 2015; 133(4):286-9 287
(95% CI: 53.7-55.5). he distribution of the dietary markers was inluenced by the age, sex, educational level, race/skin color and place of residence of the interviewees (Table 1).6
Investigation of the prevalence of non-healthy food mark-ers consumed ive or more times a week showed that there was excessive consumption of fats (37.2%; 95% CI: 36.4%-38.0%), sot drinks (23.4%; 95% CI: 22.7%-24.1%) and whole milk (60.6%; 95% CI: 59.8-61.4) and excessive regular consumption of sweets (21.7%; 95% CI: 21.0-22.3). hese factors were seen more frequently among men, young adults and people with
lower educational levels.7 According to the PNS, there was a
high consumption of salt among 14.2% (95% CI: 13.6%-14.7%) of the adults, with greater prevalence among men (16.1%; 95% CI: 15.3-16.9), individuals aged 18-29 years (17.7%; 95% CI: 16.2-19.2), individuals with completed higher education (17.3%; 95% CI: 15.6-19.0) and people living in urban areas (14.8%; 95% CI: 13.6-14.7).8
Practicing physical activity during free time was observed among 22.5% of the adults (95% CI: 21.8%-23.1%), and this per-centage was higher among men and people living in urban areas; 31.9% (95% CI: 31.0-32.7) were active in moving around, while 46.0% (95% CI: 45.2-46.8) were insuiciently active; the propor-tion of adults who watched television for three or more hours per day was 28.9% (95% CI: 28.2-29.6).6,9
he prevalence of current use of tobacco was 15.0% (95% CI: 14.4%-15.5%), and most of this was smoked (14.7%; 95% CI: 14.2%-15.2%). Over the 12-month period preceding the inter-view, 51% (95% CI: 49.3%-52.9%) of the current smokers had tried to stop smoking. he prevalence of former smokers was 17.5% (95% CI: 16.9%-18.0%), i.e. 19.2% (95% CI: 18.3%-20.1%)
among men and 11.2% (95% CI: 10.6%-11.8%) among women. he prevalence of exposure to tobacco smoke at home was 10.7% (95% CI: 10.2%-11.3%) and in closed work locations it was 13.5% (95% CI: 12.6%-14.4%). It should be noted that the prevalence of tobacco use in 2008 had been 18%, and, therefore, a 20% reduc-tion took place over the subsequent ive years.10
The prevalence of abusive alcohol consumption was 13.7% (95% CI: 13.1%-14.2%), and this was greater among men (21.6%; 95% CI: 20.7-22.5%) than among women (6.6%; 95% CI: 6.1-7.1%). Higher prevalence was observed among young adults, i.e. 18 to 29 years of age (18,8%; 95% CI: 17.5-20.0%), individuals with black skin color (16.6%; 95% CI: 14.9-18.4%), occasional smokers (35.2%; 95% CI: 30.4-40.0%), individuals who assessed their own health as good or very good (15.6%; 95% CI: 14.9-16.3%) and individuals
without any reported morbidity.11
Regarding chronic non-transmissible diseases (CNTDs), 36.9% reported having at least one. It has been estimated that more than 53 million Brazilians have prior diagnoses of some form of CNTD. he most prevalent CNTD was self-reported arterial hypertension (21.4%), followed by chronic spinal prob-lems (18.5%), depression (7.6%), arthritis (6.4%), diabetes (6.2%), asthma (4.4%), heart disease (4.2%), cancer (1.8%), stroke (1.5%), kidney failure (1.4%) and lung disease (1.8%) (Table 2).12
he prevalence of reported hypertension was greater among women (24.2%; 95% CI: 23.4-24.9), individuals over the age of 75 years (55.0%; 95% CI: 51.8-58.3), individuals with lower school-ing levels (31.1%; 95% CI: 30.1-32.2), individuals of black skin color/race (24.2%; 95% CI: 22.2-26.3) and people living in urban zones (21.7%; 95% CI: 21.0-22.3).13
Risk and protection factors Total Male Female
% 95% CI % 95% CI % 95% CI
Foods
Consumption of fruits and vegetables 37.3 36.4-38.1 34.8 33.7-36.0 39.4 38.4-40.5 Consumption of beans 71.9 71.2-72.6 76.8 75.8-77.7 67.6 66.6-68.5 Consumption of meats with excess fat 37.2 36.4-38.0 47.2 46.0-48.4 28.3 27.3-29.2 Consumption of soft drinks 23.4 22.7-24.1 26.6 25.6-27.6 20.5 19.7-21.3 Physical activity
Practicing of physical activity during free time 22.5 21.8-23.1 27.1 26.1-28.0 18.4 17.5-19.2 Insuiciently active 46.0 45.2-46.8 39.8 38.7-40.8 51.5 50.5-52.5 Watching television for three or more hours per day 28.9 28.2-29.6 25.5 24.5-26.6 31.9 31.0-32.8 Alcohol
Abusive consumption of alcohol 13.7 13.1-14.2 21.6 20.7-22.5 6.6 6.1-7.1 Smoking
Smokers 14.5 14.0-15.0 18.7 17.8-19.5 10.8 10.2-11.3 Former smokers 17.5 16.9-18.0 21.2 20.3-22.1 14.1 13.4-14.8 Passive smokers at home 10.7 10.2-11.3 9.5 8.8-10.3 11.7 10.9-12.4 Passive smokers at work 13.5 12.6-14.4 16.9 15.5-18.2 10.4 9.3-11.5
Table 1. Risk factors for and protection against chronic non-transmissible diseases (CNTDs) according to sex, with 95% confidence
EDITORIAL | Malta DC, Szwarcwald CL
288 Sao Paulo Med J. 2015; 133(4):286-9
Self-reported diabetes was registered more frequently among women (7.0%; 95% CI: 6.5-7.5) than among men (5.4%; 95% CI: 4.8-5.9); and more frequently among people living in urban areas (6.5%; 95% CI: 6.1-6.9) than in rural areas (4.6%; 95% CI: 4.0-5.2). It has been estimated that a total of approximately 9 million Brazilians have diabetes, and around 3.5 million of them are 65 years of age or older.14
he self-reported prevalence of chronic spinal problems was 18.5% (95% CI: 17.8-19.1) and this was greater among women (21.1%; 95% CI: 20.2-21.9) and individuals with low schooling levels (24.6%; 95% CI: 23.5-25.6). Among the individuals who reported having spinal problems, 16.4% (95% CI: 15.2-17.6) said that they had a high or very high degree of limitations in relation to their habitual activities, especially those in rural areas (20.3%; 95% CI: 17.5-23.0). he prevalence of work-related musculoskel-etal disorders (WRMD) was 2.4% (95% CI: 2.2-2.7), and this was greater among women (3.3%; 95% CI: 2.9-3.7) and individuals with higher education (3.8; 95% CI: 3.0-4.7).15
Out of the total number of hypertensive individuals, 81.4% (95% CI: 80.1-82.7) were using medications to treat CNTDs, with greatest use in the southern region (83.6%; 95% CI: 80.8-86.4), by women (84.6%; 95% CI: 83.2-86.5) and by individuals over the age of 75 years (92.2%; 95% CI: 89.7-94.6). Among those who reported having diabetes and depression, 80.2% (95% CI: 78.0-82.5) and 52.0% (95% CI: 49.1-54.9) were using medica-tions, respectively, with greatest use in the southeastern region for both of these diseases (84.6% and 55.0%). Out of the total number of patients who reported having asthma, 81.5% (95% CI: 77.4-85.6) were using medications, and there were no diferences in this regard between the Brazilian macroregions. he role of the Brazilian National Health System (Sistema Único de Saúde, SUS) with regard to access to healthcare services and medications can
be highlighted, both through primary healthcare units and at public-service pharmacies. SUS facilitates access to medications precisely for the population of lower schooling and income levels and black skin color.16
In conclusion, PNS is the most extensive such survey ever car-ried out in Brazil, with good quality and reliability, and it provides a wealth of information for healthcare in this country. Its data are of inestimable value for planning and evaluating healthcare ser-vices, both in the public and in the private sector. Summarizing its indings, the Brazilian population presented high prevalence rates of risk factors for CNTDs in adults.17 he prevalence of
consump-tion of unhealthy foods, which are considered to be risk factors for CNTDs, was high. On the other hand, the survey also showed that there was high prevalence of consumption of beans, ish and fruits and vegetables in the diet of the adult population of Brazil.6
Tobacco consumption presented a reduction of 20% in compari-son with the indings of the National Household Sampling Survey (PNAD) of 2008, thus showing that important advances in com-bating smoking have been achieved in Brazil.10
Regarding CNTDs, the results from the PNS are consistent with those of other surveys that have been conducted. They show that that a large group within the Brazilian population has been diagnosed with these diseases, especially in urban areas. The results also show that there is high use of medica-tions for treating the chronic diseases investigated, which may indicate that access to treatment for these diseases has been increasing, with a prominent role played by SUS in facilitating access to diagnosis and treatment among large portions of the Brazilian population.
Data relating to access and use of healthcare services have also been released, and information on life cycles, anthropom-etry, arterial blood pressure measurements and laboratory tests will shortly be available. here is no doubt that these results are going to support healthcare management and research and will improve Brazilians’ health.
REFERENCES
1. Brasil. Ministério do Planejamento, Orçamento e Gestão. Instituto
Brasileiro de Geograia e Estatística - IBGE (Brasil). Pesquisa Nacional
de Saúde: Percepção do estado de saúde, estilos de vida e doenças
crônicas: 2013. Rio de Janeiro: IBGE; 2014.
2. Damacena GN, Szwarcwald CL, Malta DC, et al. O processo de
desenvolvimento da Pesquisa Nacional de Saúde no Brasil, 2013
[The Development of the National Health Survey in Brazil, 2013].
Epidemiol Serv Saúde. 2015;24(2):197-206.
3. Souza-Júnior PRB, Freitas MPS, Antonaci GA, Szwarcwald CL.
Desenho da amostra da Pesquisa Nacional de Saúde 2013 [Sampling
Design for the National Health Survey, 2013]. Epidemiol Serv Saúde.
2015;24(2)207-16.
Morbidity Total Male Female
Arterial hypertension 21.4 18.3 24.2
Diabetes 6.2 5.4 7.0
Asthma 4.4 3.6 5.1
Depression 7.6 3.9 10.9
Other mental disease 0.9 0.9 1.0 Heart disease 4.2 3.9 4.4
Stroke 1.5 1.6 1.4
Arthritis 6.4 3.5 9.0
Spinal problems 18.5 15.5 21.1
WRMD 2.4 1.5 3.3
Cancer 1.8 1.6 2.0
Chronic kidney failure 1.4 1.4 1.5 Lung disease 1.8 1.7 1.8
Table 2. Total number of individuals who reported having morbidities,
according to sex, National Health Survey, 201312
Lifestyles and chronic non-transmissible diseases of the Brazilian population according to the National Health Survey: balance of the main results | EDITORIAL
Sao Paulo Med J. 2015; 133(4):286-9 289
4. Szwarcwald CL, Malta DC, Pereira CA, et al. Pesquisa Nacional de
Saúde no Brasil: concepção e metodologia de aplicação [National
Health Survey in Brazil: design and methodology of application].
Ciênc Saúde Coletiva. 2014;19(2):333-42.
5. Jaime PC, Stopa SR, Oliveira TP, et al. Prevalência e distribuição
socidemográica de marcadores de alimentação saudável, Pesquisa
Nacional de Saúde, Brasil 2013 [Prevalence and sociodemographic
distribution of healthy eating markers, National Health Survey, Brazil
2013]. Epidemiol Serv Saúde. 2015;24(2)267-76.
6. Malta DC, Andrade SSCA, Stopa SR, et al. Estilos de vida da população
brasileira: resultados da Pesquisa Nacional de Saúde, 2013 [Brazilian
lifestyles: National Health Survey results, 2013] Epidemiol Serv Saúde.
2015;24(2):217-26.
7. Claro RM, Santos MAS, Oliveira TP, et al. Consumo de alimentos
não saudáveis relacionados a doenças crônicas não transmissíveis
no Brasil: Pesquisa Nacional de Saúde, 2013 [Unhealthy food
consumption related to chronic non-communicable diseases
in Brazil: National Health Survey, 2013]. Epidemiol Serv Saúde.
2015;24(2):257-65.
8. Oliveira MM, Malta DC, Santos MAS, et al. Consumo elevado de
sal autorreferido em adultos: dados da Pesquisa Nacional de
Saúde, 2013 [Self-reported high salt intake in adults: data from
the National Health Survey, Brazil, 2013]. Epidemiol Serv Saúde.
2015;24(2):249-56.
9. Mielke GI, Hallal PC, Rodrigues GBA, et al. Prática de atividade física
e hábito de assistir à televisão entre adultos no Brasil: Pesquisa
Nacional de Saúde 2013 [Physical activity and television viewing
among Brazilian adults: National Health Survey 2013]. Epidemiol Serv
Saúde. 2015;24(2):277-86.
10. Malta DC, Oliveira TP, Vieira ML, Almeida L, Szwarcwald CL. Uso e
exposição à fumaça do tabaco no Brasil: resultados da Pesquisa
Nacional de Saúde 2013 [Use of tobacco and exposure to tobacco
smoke in Brazil: results from the National Health Survey 2013].
Epidemiol Serv Saúde. 2015;24(2):239-48.
11. Garcia LP, Freitas LRS. Consumo abusivo de álcool no Brasil: resultados
da Pesquisa Nacional de Saúde 2013 [Heavy drinking in Brazil: results
from the 2013 National Health Survey]. Epidemiol Serv Saúde.
2015;24(2):227-37.
12. Malta DC, Stopa SR, Barbosa, J et al. A Vigilância e o Monitoramento
das Principais Doenças Crônicas Não Transmissíveis no Brasil -
Pesquisa Nacional de Saúde, 2013. Rev Brasileira de Epidemiologia.
2015. Prelo.
13. Andrade SSA, Stopa SR, Brito AS, et al. Prevalência de hipertensão
arterial autorreferida na população brasileira: análise da Pesquisa
Nacional de Saúde, 2013 [Self-reported hypertension prevalence
in the Brazilian population: analysis of the National Health Survey,
2013]. Epidemiol Serv Saúde. 2015;24(2):297-304.
14. Iser BPM, Stopa SR, Chueiri PS, et al. Prevalência de diabetes
autorreferido no Brasil: resultados da Pesquisa Nacional de Saúde
2013 [Self-reported diabetes prevalence in Brazil: results from National
Health Survey 2013]. Epidemiol Serv Saúde. 2015;24(2):305-14.
15. Oliveira MM, Andrade SSCA, Souza CAV, et al. Problema crônico de
coluna e diagnóstico de distúrbios osteomusculares relacionados ao
trabalho (DORT) autorreferidos no Brasil: Pesquisa Nacional de Saúde,
2013 [Chronic back complaints and diagnosis of self-reported
work-related musculoskeletal disorders (WMSDs) in Brazil: National Health
Survey, 2013]. Epidemiol Serv Saúde. 2015;24(2):287-96.
16. Tavares NUL, Costa KS, Mengue SS, et al. Uso de medicamentos
para tratamento de doenças crônicas não transmissíveis no Brasil:
resultados da Pesquisa Nacional de Saúde, 2013 [Use of medication
for treatment of noncommunicable chronic diseases in Brazil: results
from the National Health Survey, 2013]. Epidemiol Serv Saúde.
2015;24(2):315-23.
17. Garcia LP. Primeiros resultados da Pesquisa Nacional de Saúde,
big data e relato de revisões sistemáticas. Epidemiol Serv Saúde.
2015;24(2):195-6.
Sources of funding: None
Conlict of interest: None
Date of submission: July 28, 2015
Last received: August 3, 2015
Accepted: August 3, 2015
Address for correspondence:
Deborah Carvalho Malta
Departamento de Vigilância de Doenças e Agravos Não Transmissíveis e
Promoção da Saúde
Secretaria de Vigilância em Saúde, Ministério da Saúde
SAF Sul, Trecho 2, Lote 5/6, Torre I, Edifício Premium, Sala 16, Térreo
Brasília (DF) — Brasil
CEP 70070-600
Tel. (+55 61) 3315-7701