ABSTRACT:Objective:To describe risk and protective factors for chronic diseases, in Brazilian capitals and the Federal District, collected by the National Health Survey (PNS) and by the Surveillance System for Protective and Risk Factors for Chronic Diseases by Telephone Survey (Vigitel) in 2013. Methods:Data analysis of the studies conducted by the PNS and Vigitel in 2013 was performed. Indicators analyzed were: smoking, alcohol consumption, diet, and physical activity, according to sex, with a 95% conidence interval. Results: The prevalences found were: current cigarette smokers: PNS, 12.5% and Vigitel, 11.3%; abuse of alcoholic beverages: PNS, 14.9% and Vigitel, 16.4%; recommended intake of fruits and vegetables: PNS, 41.8% and Vigitel, 23.6%; and physical activity in leisure time: PNS, 26.6% and Vigitel, 35.8%. Conclusion: In the majority of indicators, the results were similar, especially when the questions and response options were equal. Surveys are useful for the monitoring of risk and protective factors of noncommunicable diseases and can support health promotion programs.
Keywords:Health surveys. Chronic disease. Life style. Risk factors. Smoking. Epidemiological surveillance.
Lifestyles in Brazilian capitals according to the
National Health Survey and the Surveillance
System for Protective and Risk Factors for Chronic
Diseases by Telephone Survey (Vigitel), 2013
Estilos de vida nas capitais brasileiras segundo a Pesquisa Nacional de
Saúde e o Sistema de Vigilância de Fatores de Risco e Proteção para Doenças
Crônicas Não Transmissíveis por Inquérito Telefônico (Vigitel), 2013
Deborah Carvalho MaltaI,II, Betine Pinto Moehlecke IserII,IV, Maria Aline Siqueira SantosI,
Silvânia Suely de Araújo AndradeI,III, Sheila Rizzato StopaI,III, Regina Tomie Ivata BernalIII,
Rafael Moreira ClaroII
IDepartment of Health Surveillance, Ministry of Health – Brasília (DF), Brazil. IISchool of Nursing, Universidade Federal de Minas Gerais – Belo Horizonte (MG), Brazil. IIISchool of Public Health, Universidade de São Paulo – São Paulo (SP), Brazil. IVSchool of Medicine, Universidade do Sul de Santa Catarina – Tubarão (SC), Brazil.
Corresponding author: Deborah Carvalho Malta. Departamento de Vigilância de Doenças e Agravos Não Transmissíveis e Promoção da Saúde – DEVDANTPS SAF Sul, Trecho 02, Lotes 05/06, Bloco “F”, Torre 1, Edifício Premium, Térreo, Sala 16. CEP: 70070-600. Brasília, DF, Brasil. E-mail: [email protected]
Conlict of interests: nothing to declare – Financial support: none.
69
INTRODUCTION
Population-based health surveys have been widely used as instruments to produce knowl-edge for public health, guiding the elaboration and evaluation of the policies in the sector1-3.
These surveys generate information that enable the construction of indicators about the proile and social determinants of health and the morbidity and the lifestyle of the popu-lation studied, indicating the distribution of exposures and risk conditions and protection for speciic diseases or injuries4,5.
The World Health Organization (WHO) recommends that surveillance of chronic noncommunicable diseases (NCDs) and their risk and protective factors is accomplished through population-based surveys whose level of complexity can be increased with the inclusion of anthropometric measurements and laboratory tests, according to the spe-ciic nature of NCDs: long asymptomatic course of disease, lack of mandatory notii-cation of cases, high cost for monitoring of population cohorts, and the possibility of action on risk factors6-9.
In Brazil, aiming to build a surveillance system for NCDs, the Secretary of Health Surveillance (SVS) of the Ministry of Health (MS) has implemented a monitoring sys-tem that includes household surveys for every 5 years. In 2003, a survey was conducted on risk factors for NCDs in 17 capitals, as a result of a partnership between the National Cancer Institute (INCA) and the SVS2. In 2006, the Surveillance System for Protective
and Risk Factors for Chronic Diseases by Telephone Survey — Vigitel — was developed, aiming to annually monitor the frequency and distribution of risk and protective factors for NCDs in adults residing in Brazilian capitals and in the Federal District2,10. In 2008, a
speciic module on physical activity, smoking, and morbidity by NCDs was included in
RESUMO:Objetivo: Descrever os principais resultados dos fatores de risco e proteção de doenças crônicas não transmissíveis (DCNT), nas capitais brasileiras e no Distrito Federal, coletados pela Pesquisa Nacional de Saúde (PNS) e pelo Sistema de Vigilância de Fatores de Risco e Proteção para Doenças Crônicas Não Transmissíveis por Inquérito Telefônico (Vigitel) no ano de 2013. Métodos: Análise de dados advindos da PNS e do Vigitel, pesquisas
realizadas no ano de 2013. Foram analisados indicadores sobre tabagismo, consumo de álcool, alimentação e atividade física, segundo sexo, com intervalo de coniança de 95% (IC95%). Resultados: As prevalências encontradas foram: fumantes atuais de cigarro — PNS 12,5% e Vigitel 11,3%; consumo abusivo de bebida alcoólica — PNS 14,9% e Vigitel 16,4%; consumo recomendado de frutas e hortaliças — PNS 41,8% e Vigitel 23,6%; prática de atividade física no tempo livre — PNS 26,6% e Vigitel 33,8%. Conclusão: Os resultados dos indicadores foram semelhantes, em especial quando as perguntas e opções de resposta também eram. As pesquisas são úteis para o monitoramento dos fatores de risco e proteção das DCNT, podendo apoiar programas de promoção da saúde.
Palavras-chave:Inquéritos epidemiológicos. Doença crônica. Estilo de vida. Tabagismo. Fatores de risco. Vigilância
the questionnaire from the National Household Sample Survey (PNAD)11,12. The 5-year
monitoring was continued in 2013, further delving in the themes, through the National Health Survey (PNS)4.
PNS brought improvements through its approach, with face-to-face interviews in house-hold environments. However, this type of study cannot be performed continuously owing to its high cost and logistical complexity; so, the annual monitoring of the main indicators used in NCD surveillance has been carried out by Vigitel.
This study aimed to describe the main results of the risk and protective factors for NCDs in Brazilian capitals and in the Federal District, collected by PNS and Vigitel in 2013.
METHODS
We conducted an analysis of the data on risk and protective factors for NCDs from PNS and Vigitel, 2013. PNS is a household survey whose sampling process was performed by cluster sampling, carried out in three stages: census tracts (primary units), households (sec-ondary units), and one 18-year resident or older (tertiary unit). The minimum sample size was 1,800 households per federal unit (UF), with a total of 64,348 households, where inter-views were conducted.
The interviews were conducted using handheld computers—personal digital assistants (PDAs). Estimates provided by PNS were weighted considering the weight of the house-hold, adjustment for nonresponse by sex and total population by sex and age, and count-ing the number per household. More details on the process of samplcount-ing and weightcount-ing are available in the publication on the results of the PNS13.
Vigitel is a survey conducted with the adult population (≥18 years) living in Brazilian state capitals and in the Federal District. The sample size of this survey is probabilistic, from the records of landline telephones of the studied locations. The sample consists of 5,000 telephone lines divided into 200 subsamples for each city, in order to identify eligible lines (active households). Then, the residents to be interviewed were drawn10.
Estimates of Vigitel were weighted through the raking method of poststratiication14,15,
using the estimates of age, sex, and education of the population projected for the year of the survey. The aim of Vigitel’s weighting is to equalize the distribution of the population interviewed with the distribution of the population estimated by the Census. Details on sampling and weighting are given in other publications14,15.
Chart 1. Comparison of the questionnaires and indicators of the National Health Survey and the Surveillance System for Protective and Risk Factors for Chronic Diseases by Telephone Survey, 2013.
Indicators PNS (2013)
Questions
PNS (2013) Vigitel (2013) Similarities and diferences found between PNS e Vigitel
Smoking
Current cigarette smokers
Currently, do you smoke any tobacco product? On average, how many of the following items do you currently smoke per day or per week? ... a) factory-made cigarettes?;
b) straw or hand-rolled cigarettes?; c)
clove cigarettes or kreteks?
Are you a smoker?
Comparable questions, with
minor diferences. PNS is more
detailed, listing the types of tobacco products.
Passive smokers at home
Currently, do you smoke any tobacco product?
How oten does someone smoke
inside your household?
Are you a smoker? Do any of the people who live with
you have the habit of smoking inside your household?
Comparable questions,
with minor diferences.
Passive smokers in the workplace
Currently, do you smoke any tobacco product?
Thinking about all your jobs over the past 30 days, did someone smoke in a closed
environment where you work?
Are you a smoker? Do any work colleague
oten smoke in the same
room where you work?
Comparable questions.
PNS speciies smoking
in a closed environment.
Former smokers
Currently, do you smoke any tobacco products? And in the past, did you smoke any tobacco products?
Are you a smoker? Have you ever been
a smoker?
Comparable questions,
with minor diferences.
Alcohol consumption
Alcohol abuse
Over the past 30 days, have you
consumed ive/four (for men/women,
respectively) or more alcoholic drinks on one occasion?
Over the past 30 days, have you
consumed ive/four (for men/women,
respectively) or more alcoholic drinks on one occasion?
Identical questions.
The PNS applied a ilter to question
relating to alcoholic beverage consumption. Thus, the respondents who referred drinking less than once
per month were excluded. Vigitel questions all who claim they
drink, regardless of the amount.
Indicators PNS (2013)
Questions
PNS (2013) Vigitel (2013) Similarities and diferences found between PNS e Vigitel
Food consumption
Recommended consumption of fruits and vegetables (FV)
In how many days of the week do you usually eat green salad or
tomato salad, or any other raw vegetables?
In general, how many times a day do you eat this kind of salad? In how many days of the week do you usually eat cooked vegetables,
such as kale, carrot, chayote, eggplant, zucchini?
In general, how many times a day do you eat cooked vegetables? In general, how many times a day do
you eat fruit?
In general, how many glasses of natural fruit juice do you
drink a day?
In how many days of the week do you usually eat green salad or tomato salad or
any other raw vegetables? On an average day, do you eat this type of
salad ... at lunch, dinner or both? In how many days of the week do you usually eat cooked vegetables with your
food or soup, for example, kale, carrot, chayote, eggplant, zucchini (not counting
potatoes, cassava or yam)? On an average day, do you eat cooked vegetable ... at lunch, dinner or both? On an average day, how many cups of
natural fruit juice do you drink? On an average day, how many times do
you eat fruit?
The questions are similar. In general, PNS questions eating
behavior on a typical day, and Vigitel questions the behavior during most days of the week. Different concepts have been
applied: Vigitel measures the consumption of five servings of FV five or more days a week.
The PNS measures five servings of FV on a typical day,
assuming the same regularity for FV consumption on other
days of the week.
Regular consumption of beans
In how many days of the week do you usually eat beans?
In how many days of the week do you
usually eat beans? Identical questions.
Fatty meats
When you eat red meat, do you usually ... b) eat it with fat?
When you eat chicken/poultry,
do you usually ... b) eat it with the skin?
When you eat red meat, do you usually ... b) eat it with fat?
When you eat chicken/poultry, do you
usually ... b) eat it with the skin?
Identical questions.
Chart 1. Continuation.
Indicators PNS (2013)
Questions
PNS (2013) Vigitel (2013) Similarities and diferences found between PNS e Vigitel
Regular consumption of soft drinks or artificial juice
In how many days of the week do you consume soft drinks (or
artificial juice)?
In how many days of the week do you
consume soft drinks or artificial juice? Identical questions.
Physical activity*
Practice of the recommended level of physical activity during free time
In the last three months, did practice some form of physical
exercise or sport? In how many days per week do you usually practice a physical
exercise or sport? What physical exercise or sport
do you practice more oten?
In general, in the day you practice a physical exercise or sport, how
long is this activity?
In the last three months, did you practice some form of physical exercise or sport? What is the main type of physical exercise or sport that you practiced?
Do you practice physical exercise at least once a week? In how many days per week do you usually practice a physical
exercise or sport? On the day that you practice an exercise or sport, how long
is this activity?
Similar questions.
Watching TV
On average, how many hours per day do you spend
watching television?
On average, how many hours per day do you spend watching
television?
Same question, diference
in response options.
The indicators were calculated with the total number of adults interviewed as the denom-inator. All indicators were presented by sex, with 95% conidence intervals (95%CI). Data were analyzed using Stata software, version 11.0, using the survey module, which incorpo-rates the efects of complex sampling.
Vigitel was approved by the National Research Ethics Commission (CONEP) of the MS, under protocol no. 749/2006 and record no. 13,081, updated by protocol no. 355.590, 2013. PNS was also approved by CONEP, under protocol no. 328.159, June 26, 2013.
RESULTS
A simple random sample of 81,167 households was drawn from PNS, and information was collected from 64,348 households. Adults drawn responded to the individual question-naire, including the module on lifestyle, with a nonresponse rate of 8.1%. In Vigitel 2013, the number of interviews conducted was on 52,929 individuals, and the rate of refusal was of 3.9%. In both the surveys, the highest proportion of respondents was females (52.9% in the PNS and 61.7% in Vigitel).
The prevalence of current cigarette smokers was 12.5% (95%CI 11.9 – 13.2) in the PNS and 11.3% (95%CI 10.6 – 11.9) in Vigitel. The prevalence of former smokers found in the PNS was of 16.5%, while in Vigitel was 22.0% (Table 1). The frequency of passive smokers at home and former smokers was higher in Vigitel, for the total sample and for male subjects (Tables 1 and 2). The prevalence of current smokers and passive smoking in the workplace among women was higher in the PNS (Table 3). Men showed a higher prevalence of cur-rent smoking (15.5% in the PNS and 14.4% in Vigitel), passive smoking at work (12.0% in the PNS and 14.1% in Vigitel) and former smokers (20.3% in the PNS and 25.6% in Vigitel) than women (Tables 2 and 3).
The abuse of alcohol was reported by 14.9% (95%CI 14.215.6) and 16.4% (95%CI 15.717.0) of the respondents in the PNS and in Vigitel, respectively (Table 1). Alcohol consumption, in both the surveys, was greater in men (23.2% in the PNS and 24.2% in Vigitel) than in women (8.2% in the PNS and 9.7% in Vigitel) (Tables 2 and 3).
75
The regular consumption of beans was the eating habit with higher prevalence among respondents: 64.9% (95%CI 63.9 – 65.9) in the PNS and 66.9% (95%CI 66.1 – 67.7) in Vigitel. The surveys also showed similar results between the sexes, with beans being more consumed among men (about 70%) than among women (around 60%) (Tables 1 to 3).
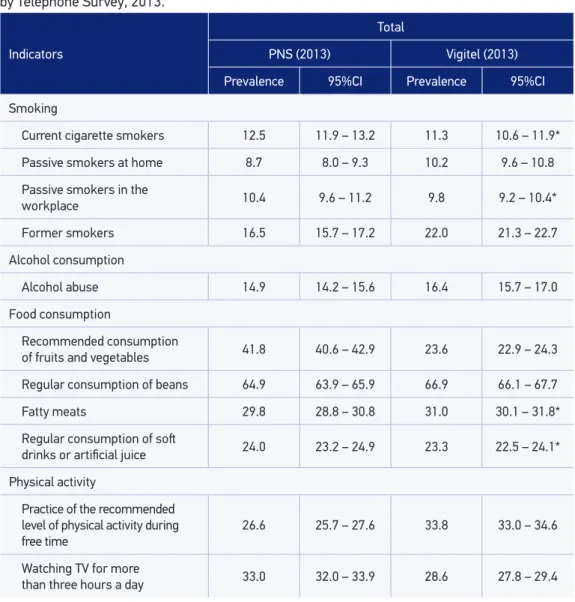
Table 1. Comparison of the prevalences of risk and protective factors for chronic diseases in the adult population of Brazilian state capitals and the Federal District, according to the National Health Survey and the Surveillance System for Protective and Risk Factors for Chronic Diseases by Telephone Survey, 2013.
Indicators
Total
PNS (2013) Vigitel (2013)
Prevalence 95%CI Prevalence 95%CI
Smoking
Current cigarette smokers 12.5 11.9 – 13.2 11.3 10.6 – 11.9*
Passive smokers at home 8.7 8.0 – 9.3 10.2 9.6 – 10.8
Passive smokers in the
workplace 10.4 9.6 – 11.2 9.8 9.2 – 10.4*
Former smokers 16.5 15.7 – 17.2 22.0 21.3 – 22.7
Alcohol consumption
Alcohol abuse 14.9 14.2 – 15.6 16.4 15.7 – 17.0
Food consumption
Recommended consumption
of fruits and vegetables 41.8 40.6 – 42.9 23.6 22.9 – 24.3
Regular consumption of beans 64.9 63.9 – 65.9 66.9 66.1 – 67.7
Fatty meats 29.8 28.8 – 30.8 31.0 30.1 – 31.8*
Regular consumption of sot
drinks or artiicial juice 24.0 23.2 – 24.9 23.3 22.5 – 24.1*
Physical activity
Practice of the recommended level of physical activity during free time
26.6 25.7 – 27.6 33.8 33.0 – 34.6
Watching TV for more
than three hours a day 33.0 32.0 – 33.9 28.6 27.8 – 29.4
*In the comparison of the 95% conidence interval between Vigitel and PNS, there is an overlap.
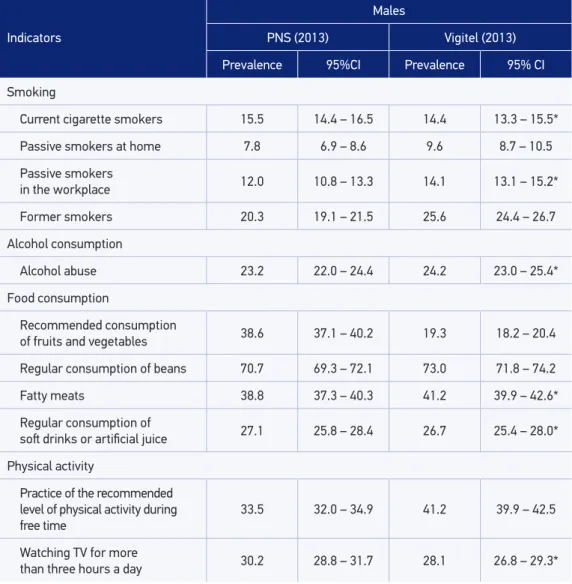
Table 2. Comparison of the prevalence of risk and protective factors for chronic diseases in the adult male population of Brazilian state capitals and the Federal District, according to the National Health Survey and the Surveillance System for Protective and Risk Factors for Chronic Diseases by Telephone Survey, 2013.
Indicators
Males
PNS (2013) Vigitel (2013)
Prevalence 95%CI Prevalence 95% CI
Smoking
Current cigarette smokers 15.5 14.4 – 16.5 14.4 13.3 – 15.5*
Passive smokers at home 7.8 6.9 – 8.6 9.6 8.7 – 10.5
Passive smokers
in the workplace 12.0 10.8 – 13.3 14.1 13.1 – 15.2*
Former smokers 20.3 19.1 – 21.5 25.6 24.4 – 26.7
Alcohol consumption
Alcohol abuse 23.2 22.0 – 24.4 24.2 23.0 – 25.4*
Food consumption
Recommended consumption
of fruits and vegetables 38.6 37.1 – 40.2 19.3 18.2 – 20.4
Regular consumption of beans 70.7 69.3 – 72.1 73.0 71.8 – 74.2
Fatty meats 38.8 37.3 – 40.3 41.2 39.9 – 42.6*
Regular consumption of
sot drinks or artiicial juice 27.1 25.8 – 28.4 26.7 25.4 – 28.0*
Physical activity
Practice of the recommended level of physical activity during free time
33.5 32.0 – 34.9 41.2 39.9 – 42.5
Watching TV for more
than three hours a day 30.2 28.8 – 31.7 28.1 26.8 – 29.3*
*In the comparison of the 95% conidence interval between Vigitel and PNS, there is an overlap.
PNS: National Health Survey; Vigitel: Surveillance System for Protective and Risk Factors for Chronic Diseases by Telephone Survey.
77 Indicadores
Females
PNS (2013) Vigitel (2013)
Prevalência IC95% Prevalência IC95%
Smoking
Current cigarette smokers 10.1 9.4 – 10.9 8.6 7.9 – 9.3
Passive smokers at home 9.3 8.5 – 10.2 10.7 10 – 11.5*
Passive smokers
in the workplace 8.9 7.9 – 9.9 6.1 5.5 – 6.7
Former smokers 13.3 12.5 – 14.2 18.9 18.1 – 19.8
Alcohol consumption
Alcohol abuse 8.2 7.5 – 8.8 9.7 9.0 – 10.4
Food consumption
Recommended consumption
of fruits and vegetables 44.3 42.9 – 45.7 27.3 26.3 – 28.2
Regular consumption
of beans 60.1 58.9 – 61.4 61.7 60.6 – 62.7*
Fatty meats 22.4 21.3 – 23.5 22.2 21.2 – 23.1*
Regular consumption of sot
drinks or artiicial juice 21.5 20.5 – 22.6 20.4 19.4 – 21.3*
Physical activity
Practice of the recommended level of physical activity during free time
21.0 20.0 – 22.1 27.4 26.5 – 28.3
Watching TV for more
than three hours a day 35.2 34.1 – 36.4 29.0 28.0 – 30.0
Table 3. Comparison of the prevalence of risk and protective factors for chronic diseases in the adult female population of Brazilian state capitals and the Federal District, according to the National Health Survey and the Surveillance System for Protective and Risk Factors for Chronic Diseases by Telephone Survey, 2013.
*In the comparison of the 95% conidence interval between Vigitel and PNS, there is an overlap.
PNS: National Health Survey; Vigitel: Surveillance System for Protective and Risk Factors for Chronic Diseases by Telephone Survey.
DISCUSSION
The study presents the frequencies of indicators relating to lifestyle (smoking, alco-hol abuse, food intake, and physical activity) for Brazilian capitals, according to the PNS and Vigitel, both held in the same year (2013). In most indicators, the results were similar, especially when the questions and answer choices were the same, such as in the indicators for the consumption of fatty meats and soft drinks ingested by about a third and a quarter of the population, respectively. Bean consumption was reported by about 65% of the respon-dents, with little diference in frequencies between the two surveys. The consumption of vegetables showed greater diference, because the two surveys adopted diferent concepts. Smoking indicators were similar: current cigarette smokers and passive smokers at home. Physical activity indicators showed slight diferences that can be explained by the introduc-tion of diferent quesintroduc-tions in the PNS. The practice of physical activity during free time was found to be higher in Vigitel, while the PNS showed higher frequency of time watching TV.
Population-based surveys show great advances for health information, and difer-ences found in the comparison between the diferent studies may be explained by method-ological diferences2,3, such as sampling and data collection strategy, which can interfere with
the proper understanding of the issues2,3,16.In fact, when comparing the PNS with Vigitel, an
important feature to consider is the sampling, as the PNS conducted home interviews with face-to-face questions, while Vigitel conducted telephone interviews. In general, household surveys are quite comprehensive, presenting results of great importance to the knowledge of the epidemiological reality, but their complexity and diiculties in logistic, planning, and implementation have a high cost2,3,6.
The PNS consists of a more comprehensive study, with several modules, and the appli-cation time can vary from 50 minutes to about 3 hours, containing detailed modules and with national representation. The selected sample was suitable to represent the overall adult population (regardless of landline ownership) in the country, in the large regions, Federative Units, Brazilian capitals, and the Federal District4,13. The sample of Vigitel represents the
adult population of the Brazilian capitals and the Federal District who lives in households with landline telephones. Although poststratiication weights are used to minimize the dif-ferences between the population with and without landlines, the results of Vigitel allow inferences only for the adult population of the capitals of Brazil and the Federal District. On the other hand, Vigitel shows main features such as agility, low cost, and the speed of dissemination of results, with great advantage for the continuous and annual monitoring of the indicators2,10,15.
Comparative studies of surveys also point to the fact that various options should be con-sidered for inding the diferences, however small, such as the fact that questions are not the same, response options are diferent, and the order of questions is changed17. Seeking
79
Thus, situations pointed in different comparative studies16,17 were, in part, identified
in the comparison between PNS and Vigitel owing to small differences in questions and response options, changed order of the questions, differences in jumps, filters, changes in the calculation method and concepts of the indicators, and the different methodolog-ical strategies. The presence of the researcher in the household can introduce differ-ences, whether in better understanding of the question and response options, in better communication, leading to responses that are closer from reality or to embarrassment on certain topics. Vigitel, on the other hand, being carried out by phone, may be bet-ter suited for more sensitive topics such as use of alcohol, being more impersonal and not face to face.
Furthermore, Vigitel performs interviews over the course of 1 year, to avoid seasonal variations in response options. The collection of data from the PNS was carried out through home interviews from August 2013 to February 2014. For example, physical activity levels are subject to change because of the weather and the season18.
When comparing the results of the PNS and Vigitel regarding consumption of fruit and vegetables, the questions were similar. However, different concepts were applied: Vigitel measured the consumption of five servings of fruits and vegetables in five or more days a week10 or most days of the week, while the PNS considered
the consumption of five servings of fruits and vegetables in an ordinary day, assum-ing the same regularity in the consumption of fruits and vegetables on other days of the week13. Thus, differences in the concept of this indicator can explain lower
frequencies in Vigitel, for considering two conditions: five servings in five days or more a week.
Similarly, the ilter applied to the PNS related to alcohol consumption, excluding respon-dents who drink less than once a month, can explain somewhat lower frequencies in the PNS13. In Vigitel, the indicator includes in the calculation all individuals who refer drinking,
regardless of the amount10.
As a similarity, the two surveys found that the abuse of alcohol was higher among men, which is in accordance with the literature19. Other factors that can interfere are related to
a greater ease in taking some risk behaviors by phone rather than in direct response to the interviewer16. Alcohol abuse can it in this situation.
In most indicators studied, similar estimates were identified. This result is con-sistent with other studies that compare prevalences of household (National Health Survey Interview – NHIS) and telephone surveys (Behavioral Risk Factor Surveillance System – BRFSS).20. Similarly, a study of behavioral risk factors and preventive
prac-tices carried out in Madrid, Spain (1999/2000), showed similarity between the results obtained by a telephone interview and a face-to-face interview17. Another study, in Belo
Horizonte in 2010, pointed out similarities in the results of Vigitel and the household survey for most indicators surveyed21.
with higher education, which may reduce the participation of low-income populations in the telephone survey, although weighting factors in Vigitel seek to minimize the dif-ferences between the population with and without a landline telephone. The main lim-itation of Vigitel is the sample restriction on households with landlines in the state capi-tals, which can cause biases in the estimates in state capital whose landline coverage rate is lower than 70%22.
Both studies are in accordance with the results of international23 and national24,25
litera-ture in indicating a higher prevalence of smoking among men, which was conirmed in the data from both the PNS and Vigitel. Higher prevalence of smoking in men is described since the start of the tobacco epidemic, because this habit has always been associated with the idea of strength and power. The Special Survey of Tobacco Use (PETab) in 2008 showed the prevalence of exposure to passive smoking in nonsmokers in Brazil: 12.5% in the house-hold environment and 24.4% in the workplace25. Therefore, the PNS pointed a decline in
tobacco prevalence between 2008 and 201313,25. Similarly, Vigitel has been pointing to this
decline in every year surveyed10,26.
The results of both the surveys showed prevalence rates with minor diferences in terms of physical activity, but which point to results in the same direction, that is, one in four adults meets the physical activity recommendations in their free time and approximately one-third of the population spends more than 3 hours a day watching television. Both surveys indi-cated that men are more active during free time than women. The scientiic literature has suggested that sedentary behavior (time sitting) is associated with increased risk of cardio-vascular events27 and higher mortality rates from all causes28.
CONCLUSION
Indicators with the same or very similar question, such as consumption of soft drinks and fatty meats, revealed the same results, showing that the same question and the same response choices are essential in comparing the estimates17. Thus, caution is required in
making comparisons between Vigitel and the PNS, noting that the two strategies are useful tools for surveillance of risk and protective factors for NCDs, mainly pointing trends in the population, and there are advantages and disadvantages to both the strategies, face-to-face and telephone interviews. Importantly, even with some distinct prevalence, the diferences between the surveys, in general, were small10,13.
The information from Vigitel and the PNS subsidize the elaboration of public policies in the ields of health promotion, surveillance, and care for the Uniied Health System (SUS), aligned to the proposals of the Strategic Action Plan to Tackle Noncommunicable Diseases (NCD) in Brazil 2011-20228. In addition, the results of the two surveys also allow
81 1. Viacava F. Health information: the relevance of
health surveys. Ciênc Saúde Colet 2002; 7(4): 607-21. Disponível em: http://www.scielo.br/pdf/csc/ v7n4/14594.pdf (Acessado em 05 de janeiro de 2015).
2. Malta DC, Leal MC, Costa MFL, Morais Neto OL. Inquéritos Nacionais de Saúde: experiência acumulada e proposta para o inquérito de saúde brasileiro. Rev Bras Epidemiol 2008; 11(Supl 1): 159-67. Disponível em: http://www.scielo.br/pdf/rbepid/v11s1/16.pdf (Acessado em 05 de janeiro de 2015).
3. Barros MBA. Inquéritos domiciliares de saúde: potencialidades e desaios. Rev Bras Epidemiol 2008; 11(Supl 1): 6-19. Disponível em: http://www.scielo. br/pdf/rbepid/v11s1/01.pdf (Acessado em 05 de janeiro de 2015).
4. Szwarcwald CL, Malta DC, Pereira CA, Vieira MLFP, Conde WL, Souza Júnior PRB, et al. National Health Survey in Brazil: design and methodology of application. Ciênc Saúde Colet 2014; 19(2): 333-42. Disponível em: http://www.scielo.br/pdf/csc/ v19n2/1413-8123-csc-19-02-00333.pdf (Acessado em 05 de janeiro de 2015).
5. Iser BP, Claro RM, de Moura EC, Malta DC, Morais Neto OL. Risk and protection factors for chronic non communicable diseases by telephone survey-VIGITEL-2009. Rev Bras Epidemiol 2011; 14(Supl 1): 90-102. Disponível em: http://www.scielo.br/ pdf/rbepid/v14s1/a10v14s1.pdf (Acessado em 06 de janeiro de 2015).
6. Organização Mundial de Saúde. STEPwise approach to surveillance (STEPS). WHO. Disponível em: http:// www.who.int/chp/steps/en/ (Acessado em 06 de janeiro de 2015).
7. Lessa I. Doenças crônicas não-transmissíveis no Brasil: um desaio para a complexa tarefa da vigilância. Ciênc Saúde Colet 2004; 9(4): 931-43. Disponível em: http:// www.scielo.br/pdf/csc/v9n4/a14v9n4.pdf (Acessado em 06 de janeiro de 2015).
8. Brasil. Ministério da Saúde. Secretaria de Vigilância em Saúde. Departamento de Análise de Situação de Saúde. Plano de ações estratégicas para o enfrentamento das doenças crônicas não transmissíveis (DCNT) no Brasil 2011-2022. Brasília: Ministério da Saúde; 2011.
9. Malta DC, Moura L, Silva Junior JB. Epidemiologia das doenças crônicas não transmissíveis (DCNT) no Brasil. In Roquayrol MZ, Silva MGC. Epidemiologia e Saúde. Rio de Janeiro: Medbook; 2013. p. 273-96.
10. Brasil. Ministério da Saúde. Secretaria de Vigilância em Saúde. Departamento de Vigilância de Doenças e Agravos Não Transmissíveis e Promoção da Saúde.
Vigitel Brasil 2013: Vigilância de Fatores de Risco e Proteção para Doenças Crônicas por Inquérito Telefônico. Brasília: Ministério da Saúde; 2014.
11. Knuth AG, Malta DC, Dumith SC, Pereira CA, Morais Neto OL, Temporão JG, et al. Practice of physical activity and sedentarism among Brazilians: results of the National Household Sample Survey - 2008. Ciênc Saúde Colet 2011; 16(9): 3697-705. Disponível em: http://www.scielo.br/pdf/csc/ v16n9/a07v16n9.pdf (Acessado em 06 de janeiro de 2015).
12. Brasil. Ministério do Planejamento, Orçamento e Gestão. Instituto Brasileiro de Geograia e Estatística - IBGE (Brasil). Pesquisa Nacional por amostra de domicílios. Um panorama da saúde no Brasil: acesso e utilização dos serviços, condições de saúde e fatores de risco e proteção à saúde: 2008. Rio de Janeiro: IBGE; 2010.
13. Brasil. Ministério do Planejamento, Orçamento e Gestão. Instituto Brasileiro de Geograia e Estatística - IBGE (Brasil). Pesquisa Nacional de Saúde: Percepção do estado de saúde, estilos de vida e doenças crônicas: 2013. Rio de Janeiro: IBGE; 2014.
14. Battaglia MP, Frankel MR, Link MW. Improving Standard Poststratiication Techniques for Random-Digit-Dialing Telephone Surveys. Survey Research Methods 2008; 2(1): 11-9. Disponível em: https:// ojs.ub.uni-konstanz.de/srm/article/view/597/1295 (Acessado em 07 de janeiro de 2015).
15. Bernal RTI, Malta DC, Araujo TS, Silva NN. Inquérito por telefone: pesos de pós-estratiicação para corrigir vícios de baixa cobertura em Rio Branco, AC. Rev Saúde Pública 2013; 47(2): 316-25. Disponível em: http:// www.revistas.usp.br/rsp/article/view/76635/80407 (Acessado em 07 de janeiro de 2015).
16. Fahimi M, Link M, Mokdad A, Schwartz DA, Levy P. Tracking chronic disease and risk behavior prevalence as survey participation declines: statistics from the behavioral risk factor surveillance system and other national surveys. Prev Chronic Dis. 2008;5(3):A80. Disponível em: http://www.ncbi.nlm.nih.gov/pmc/ articles/PMC2483564/ (Acessado em 08 de janeiro de 2015).
17. Galán I, Artalejo FR, Zorrilla B. Comparación entre encuestas telefónicas y encuestas «cara a cara» domiciliarias en la estimación de hábitos de salud y prácticas preventivas. Gac Sanit 2004; 18(6): 440-50. Disponível em: http://scielo.isciii.es/pdf/gs/ v18n6/original3.pdf (Acessado em 07 de janeiro de 2015).
18. Organização Mundial de Saúde. Handbook for guideline development. Genebra: WHO; 2010. Disponível em: http://apps.who.int/iris/ bitstream/10665/75146/1/9789241548441_eng.pdf (Acessado em 08 de janeiro de 2015).
19. Barros MBA, Marín-León L, Oliveira HB, Dalgalarrondo P, Botega NJ. Peril do consumo de bebidas alcoólicas: diferenças sociais e demográicas no Município de Campinas, Estado de São Paulo, Brasil, 2003. Epidemiol Serv Saúde 2008; 17(4): 259-70. Disponível em: http:// scielo.iec.pa.gov.br/pdf/ess/v17n4/v17n4a03.pdf (Acessado em 08 de janeiro de 2015).
20. Nelson DE, Powell-Griner E, Town M, Kovar MG. A comparison of national estimates from the National Health Interview Survey and the Behavioral Risk Factor Surveillance System. Am J Public Health 2003; 93(8): 1335-41. Disponível em: http://www.ncbi.nlm.nih. gov/pubmed/12893624 (Acessado em 08 de janeiro de 2015).
21. Ferreira AD, César CC, Malta DC, Andrade ACS, Ramos CGC, Proietti FA, et al. Validade de estimativas obtidas por inquérito telefônico: comparação entre Vigitel 2008 e Inquérito Saúde em Beagá. Rev Bras Epidemiol 2011; 14(Supl 1): 16-30. Disponível em: http://www.scielo.br/pdf/rbepid/v14s1/a03v14s1. pdf (Acessado em 08 de janeiro de 2015).
22. Bernal RTI. Inquéritos por telefone: inferências válidas em regiões com baixa taxa de cobertura de linhas residenciais [Tese de Doutorado em Ciência, Programa de Saúde Pública]. São Paulo: Faculdade de Saúde Pública da Universidade de São Paulo; 2011. Disponível em: http://www.teses.usp.br/teses/ disponiveis/6/6132/tde-09092011-120701/en.php (Acessado em 09 de janeiro de 2015).
23. Giovino GA, Mirza SA, Samet JM, Gupta PC, Jarvis MJ, Bhala N, et al. Tobacco use in 3 billion individuals from 16 countries: an analysis of nationally representative
cross-sectional household surveys. Lancet 2012; 380(9842): 668-79. Disponível em: http://www. thelancet.com/journals/lancet/article/PIIS0140-6736%2812%2961085-X/abstract (Acessado em 09 de janeiro de 2015).
24. Monteiro CA, Cavalcante TM, Moura EC, Claro RM, Szwarcwald CL. Population-based evidence of a strong decline in the prevalence of smokers in Brazil (1989-2003). Bull World Health Organ 2007; 85(7): 527-34. Disponível em: http://www.ncbi.nlm.nih. gov/pubmed/17768501 (Acessado em 09 de janeiro de 2015).
25. Brasil. Ministério do Planejamento, Orçamento e Gestão. Instituto Brasileiro de Geograia e Estatística - IBGE (Brasil). Pesquisa Especial de Tabagismo (PETab). Rio de Janeiro: IBGE; 2009.
26. Malta DC, Iser BPM, Sá NNB, Yokota RTC, Moura L, Claro RM, et al. Tendências temporais no consumo de tabaco nas capitais brasileiras, segundo dados do Vigitel, 2006 a 2011. Cad Saúde Pública 2013; 29(4): 812-22. Disponível em: (Acessado em 09 de janeiro de 2015).
27. Ford ES, Caspersen CJ. Sedentary behaviour and cardiovascular disease: a review of prospective studies. Int J Epidemiol 2012; 41(5): 1338-53. Disponível em: http://www.ncbi.nlm.nih.gov/pubmed/22634869 (Acessado em 09 de janeiro de 2015).
28. Chau JY, Grunseit AC, Chey T, Stamatakis E, Brown WJ, Matthews CE, et al. Daily sitting time and all-cause mortality: a meta-analysis. PLoS One 2013; 8(11): e80000. Disponível em: http://journals.plos. org/plosone/article?id=10.1371/journal.pone.0080000 (Acessado em 09 de janeiro de 2015).
Received on: 04/08/2015