44e
Rev Bras M ed Esporte _ Vol. 12, Nº 1 – Jan/Fev, 2006 1. School of Physical Education and Sports of the São Paulo University –São Paulo/SP.
2. Nove de Julho Hospital – São Paulo/SP.
Received in 18/2/05. Final version received in 25/9/05. Approved in 27/9/05.
Correspondence to: Rua Pedroso Alvarenga, 220, apto. 13 – 04531-000 – São Paulo, SP – Brazil. E-mail: [email protected]
Correlation betw een the protein and carbohydrate
supplement and anthropometric and strength variables
in individuals submitted to a resistance training program
Patrícia Veiga de Oliveira1, Luciana Baptista2, Fernando M oreira2 and Antônio Herbert Lancha Junior1
O
RIGINALA
RTICLEKeyw ords: Protein supplement. M uscular mass. M uscular cross section area. Strength.
ENGLISH VERSION
ABSTRACT
The majority of individuals follow ing regular resistance exercise trainings have a major esthetic concern that may be summarized through the increase in the strength and muscular mass under the training associated to the supplement. The purpose of this paper w as to verify if the intake of a high protein diet (4 g.kg-1.d-1) associ-ated to the training causes a higher increase in the muscular mass and strength compared to the normo protein dietetic pattern. M eth-odology: Sixteen volunteers w ere divided in tw o groups accord-ing to the supplement pattern: a total of 4 g.kg-1.d-1 protein (HP), and carbohydrate (NP) intake follow ing the caloric quantity of the protein supplement (225 g.d-1). Both groups w ere submitted to the resistance training protocol to the biceps and triceps muscles three times a w eek for 8 w eeks. It w as analyzed the strength, the muscular mass, the muscular cross section area, the cortisol and the insulin. Results: The HP group presented higher protein in-take, and the NP group presented higher carbohydrate intake. Both groups also presented a difference in the cortisol values. The NP group presented a positive correlation betw een the higher carbo-hydrate intake (% ) and the increase in the muscle area, and also betw een the strength to the overhead triceps, and the increase in the muscular mass and the higher carbohydrate intake. Conclu-sion: It is suggested that the correlation betw een the carbohy-drate intake and the increase in the muscular area and strength to the overhead triceps found in the NP group is related to the favor-able metabolic situation to the protein synthesis.
INTRODUCTION
The benefits of practicing regular exercises have been proved by many researchers(1). As to the specific case of the resistance training, scientific evidences confirm that an adequate training pro-gram induces several benefits, such as: improvement in the insu-lin response to the glycosis overload, in the insuinsu-lin sensitivity, and a low er chance to develop cardiovascular diseases, among oth-ers(2). Nevertheless, the majority of young adults follow ing regular resistance exercise programs have esthetic concerns that can be summarized by an increase in the strength and muscular mass w hich are not necessarily restricted to the benefic physiological limits to the health. For this, it is yearly launched in the market several diets and protein supplements aiming to have a synergis-tic action on the muscular mass gain by means of the resistance training.
Justification
Taking into account the indiscriminate w ay that individuals use to follow their diets and supplements through an undetermined time(3,4) w ithout any prove that such strategies w ill have such syn-ergistic action on the muscular mass and strength increase, this paper seeks to verify if the protein supplement associated to the practice of the resistance activity is really effective in increasing the muscular mass compared to individuals receiving the same isocaloric supplement as carbohydrate.
Purpose
To verify if the effects of a hyperprotein diet (4 g.kg-1.d-1) associ-ated to a high intensity resistance exercise program causes a ma-jor increase in the muscular mass and strength compared to the normo-protein dietetic pattern in carbohydrate-supplemented in-dividuals in the same caloric amount than the group receiving pro-tein.
M ETHODOLOGY
The project started w ith sixteen individuals and finished w ith tw elve individuals. All volunteers w ere students from the School of Physical Education of the São Paulo M ilitary Police in a semi-internship regimen, performing four meals at the school (break-fast, snack, lunch and snack) in order to allow an easy food con-trol. Every volunteer w as also perform ing the sam e physical activities pertinent to the school program.
The project w as approved by the Ethics Committee from the Institute of Biomedical Sciences, and every volunteer signed a Free Clarified Consent term.
Analysis of the diet
The nutritional assessment w as performed w ith the fulfillment of the 3-day food inquiring (2 w orking days and 1 w eekend day) every 15 days along the w hole interventional period (8 w eeks). The Virtual Nutri softw are (version 2.5) w as used to the food in-take calculation.
Supplement
Rev Bras M ed Esporte _ Vol. 12, Nº 1 – Jan/Fev, 2006
45e
caloric equivalence supplied by the protein supplement, and it w asadjusted after four w eeks.
The supplements w ere previously tested and homogenized w ith w ater, in order to be flavored through the addition of quite similar aromatizing and sw eetening agents, dyes, and pow der milk in or-der to gain flavor, color and smell aiming to make difficult the iden-tification of the sampling to the volunteers. Every bag containing the supplements w as identified through numbers (1 to 16). All individuals w ere instructed to homogenize the supplements w ith 1,000 ml w ater and to consume in four portions along the day (in the morning, in the lunch, in the afternoon and at night).
1-M R Test and prescription of the activity
Prior to the test, every individual performed a stretching and w arm up: 10 repetitions for every exercise (7 kg bar). All of them performed an average of four tries to attain the maximal load of every exercise (the load w as estimated through the Borg Scale(5). The training consisted of four exercises: arm curl (AC), preacher curl (PC), overhead triceps (OT) and lying dow n triceps extention (LDTE) performed in five series w ith eight repetitions, three times a w eek (1 day interval betw een trainings). The intervals consisted in 3 minutes betw een series, and five minutes betw een exercis-es.
One w eek before the beginning of the intervention process, every individual w as familiarized to every movement w ith a 80% load, w hen it w as performed every necessary correction in the movements and posture. The intervention period had a eight w eek endurance. Every volunteer had a record to the frequency control-ling, and they w ere instructed to not be absent to none of the training sessions (in an amount of 24 sessions). Whenever it w ould be necessary to be absent for more than one training session, they w ould be excluded from the project. After four w eeks, every load w as readjusted (1-M R test). All the training sessions w ere supervised.
Assessment of the body composition
Cutaneous folds and circumference: a Harpenden compass w as used to measure the cutaneous folds, as w ell as a tape measure to the circumferences. The cutaneous folds assessed w ere: tri-ceps, bitri-ceps, subscapular, suprailiac, supraspinal, abdomen, thigh, and leg. The measurement of the circumferences w ere performed using a tape measure in the thorax, w aist, hips, relaxed and con-tracted biceps, forearm, thigh, and leg. The measurements w ere performed three consecutive times each, and the value used w as the average of the three measures. Every measurement w as per-formed using the same device and it w as made by the same re-searcher. The protocol used to calculate the density w as the Dur-nin and Womw ersley(6), and to calculate the percentage of fat (pre-intervention = % fat1, and post-intervention = % fat 2) and the muscular mass (pre-intervention = M m1, and post-interven-tion = M m2) it w as used the Siri equapost-interven-tion(7). Every volunteer w as w eighted in an electronic scale, and the height w as measured in a board stadiometer.
Strength test (isokinetic)
Every volunteer performed a stretching and w arm up of the up-per limbs. The w arm up w as composed by three series of fifteen repetitions w ith thera band, an elastic stripe fastened in a fixed unit in w hich the participants performed their flexion and exten-sion movements of the both arms’ elbow s. The strength test in the isokinetic stadiometer w as performed in a CYBEX NORM de-vice, having the athlete in supine position w ith his upper limb sta-bilized trying to reproduce the extension and flexion movements of the elbow. Five repetitions (60% /sec.) w ere performed, adapt-ed from Neu(6). The torque peak (TP) w as analyzed to the right and left flexor and extensor muscles.
Cortisol and insulin analysis
It w as collected 10 ml of the anticubital vein blood from all indi-viduals after a 12 hours starvation period 8am. The blood w as cen-trifuged and frozen (–10oC) to the later cortisol and insulin analy-sis. The serum cortisol and insulin w ere analyzed through the radio-immuno-assay technique (Coat-A-Count Cortisol kit and in-sulin kit).
Computed tomography
The image acquisitions w ere accomplished in a SIEM ENS – SOM ATION PLUS 4 device, at the Center of Computerized To-mography of the Nove de Julho Hospital, and every analysis w as accomplished using the softw are of the ow n device. The protocol used to the image acquisition w as adapted from M acDougal(9). Before entering into the room, individuals had their dominant arm marked at the higher circumference spot of the flexed biceps. Next, a tape measure w as placed in the distance betw een the acromion and olecranon bones, and the reference spot w as recorded in the tape measure w here the pen mark w as previously done. That pro-cedure w as follow ed in order to mark the exact cut spot w here it w ould be attained the tomographic images in the tw o moments, pre- and post-intervention. The images w ere accomplished hav-ing the volunteers in supine position w ith their arms relaxed aside their bodies, having the palm of their hands up. It w as attained tw o tomographic images through 10 mm w ith axial cuts at the preciously marked reference spot. The first image attained w as used to adjust the field of sight of the biceps muscle, and it w as despised and not analyzed. The second image attained w as ana-lyzed assisted by the mouse of the device, draw ing the circumfer-ence of the arm muscles, and applying the value of the muscular density betw een 30 and 100 hounsfield units (HU) to calculate the area of the muscle in the 10 mm w idth predefined by Goodpaster et al. (1997). The values of the muscular area in the pre- and post-intervention (M 1 and M 2 areas, respectively) w ere compared.
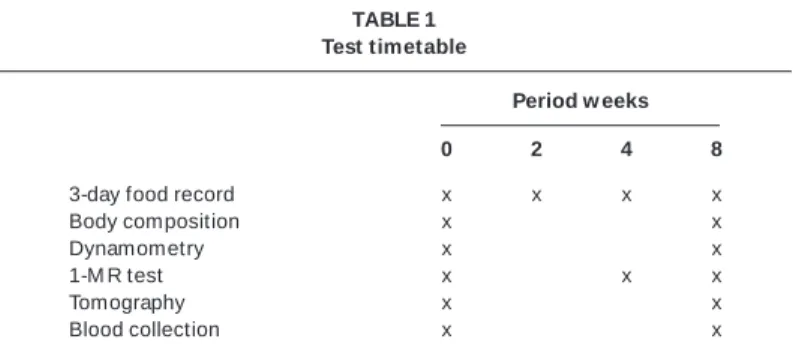
The timetable of every test performed is presented on table 1.
TABLE 1 Test timetable
Period w eeks
0 2 4 8
3-day food record x x x x
Body composition x x
Dynamometry x x
1-M R test x x x
Tomography x x
Blood collection x x
Statistical analysis
A descriptive analysis w as performed presenting the mean and the standard deviations. In order to verify if the sampling had a normal distribution, the Kolmogorov-Smirnov test w as performed. To verify if there w as any difference betw een the assessed vari-ables betw een the HP and NP groups, the t-Student test for inde-pendent samplings w as used, and to check the difference w ithin each group betw een the first and second measurements, the paired t-Student test w as used. To assess the correlation betw een variables, it w as used the R. Pearson linear correlation coefficient. The significance level adopted w as p < 0.05. The softw are used w as the SPSS version 10.0.
RESULTS
46e
Rev Bras M ed Esporte _ Vol. 12, Nº 1 – Jan/Fev, 2006 TABLE 2Age, height, and body w eight data
HP NP
Pre Post Pre Post
Age 30.2 ± 1.9 027.5 ± 1.8
Height (cm) ,176 ± 4.4 172.9 ± 6.7
Weight (kg) 73.3 ± 8.9 72.6 ± 5.0 68.7 ± 5.7 70.4 ± 4.8
TABLE 3
Cortisol, insulin and nutritional assessment data
HP NP
Pre Post Pre Post
Cortisol (µg/dl) 15.9 ± 6.4 * 019 ± 5.4* .16.4 ± 2.7 13.1 ± 2*^ Insulin (UI/ml) 02.1 ± 0.7 .1.7 ± 0.5 .01.8 ± 0.4 2.0 ± 0.5 kcal 3,108 ± 491 3,710 ± 216* 3,193 ± 496 3,767 ± 493* P (g) 133.5 ± 32.5 *296.8 ± 31.3* 127.8 ± 200 0129.9 ± 14.4*^ P (% ) 17.3 ± 2.8 *32.1 ± 3.4* 16.3 ± 20 00.14 ± 1.3*^ C (g) 362.1 ± 48.6 *337.8 ± 48.3* 418.7 ± 810 580.7 ± 72*^ C (% ) 47.1 ± 3.2 *37.4 ± 3.5* .52.9 ± 9.2 00.63 ± 2.5*^ L (g) 120.5 ± 25.9 112.4 ± 12.6. 104.3 ± 360 0100 ± 21.4 L (% ) 32.7 ± 50, 32.5 ± 3.2 .29.5 ± 7.5 29.6 ± 6.3
* p < 0.01 pre- and post-significant difference w ithin the same group; ^ p < 0.01 upon the com-parison of both groups; P(g) = protein intake in grams; P(% ) = protein intake related to the caloric intake; C(g) = carbohydrate intake in grams; C(% ) = carbohydrate intake related to the caloric intake; L(g) = lipid intake in gram; L(% ) = lipid intake related to the caloric intake.
TABLE 4
Anthropometric data of the assessed population
HP NP
Pre Post Pre Post
M m (kg) 61.2 ± 06.2 61.5 ± 03.3* 58.3 ± 4.4 61.4 ± 06.2* % of fat 16.2 ± 02.3 15.2 ± 02.3* 15.2 ± 3.2 12.7 ± 02.7* Area M (cm2) 46.5 ± 11.4 51.7 ± 12.5* 48.1 ± 9.0 54.6 ± 11.7*
* p < 0.05 indicates a significant difference w ithin the same group.
M m = muscular mass; Area M = muscular cross section; % of fat = percentage of fat.
TABLE 5 Strength variables
HP NP
Pre Post Pre Post
AC (kg) 36.2 ± 4.9 44.7 ± 5.2* 37.2 ± 4.4 44.1 ± 1.9* PC (kg) 33.7 ± 7.0 46.8 ± 5.1* 32.2 ± 5.1 47.6 ± 4.3* LDTE (kg) 37.6 ± 8.6 47.3 ± 9.5* 33.9 ± 7.9 45.1 ± 8.2* OT (kg) 28.5 ± 6.5 42.3 ± 8.4* 31.6 ± 7.9 43.8 ± 6.5* TPRFD (N/m) 48.1 ± 8.7 057.8 ± 11.8* 49.9 ± 9.1 58.7 ± 6.2* TPLF (N/m) ,050 ± 7.9 052.4 ± 10.8* 50.5 ± 5.7 52.1 ± 7.9* TPRE (N/m) 056.6 ± 12.8 61.5 ± 3.3* 054.5 ± 12.8050.2 ± 10.9* TPLE (N/m) 061.9 ± 14.6 063.2 ± 15.6* 0.057 ± 11.0 0.50 ± 6.5*
* p < 0.05 indicates a significant difference w ithin the same group.
AC = arm curl; PC = preacher curl; LDTE = Lying dow n triceps extension; OT = overhead triceps; TPRF = torque peak to right flexors; TPLF = torque peak to left flexors; TPRE = torque peak to right extensors; TPLE = torque peak to left extensors.
Figure 1 represents the cortisol variation comparing both groups. The correlations are represented on table 6. The NP group pre-sented a significant correlation betw een the increased carbohy-drate intake % and the increase in the muscular area (M 2 area), r = 0.9; p = 0.001, figure 2. There w as no significant correlation to them in the HP group (r = 0.13; p = 0.8). Related to the strength, the NP group presented a positive correlation betw een the increase in the strength to the overhead triceps (OT) and the increase in the muscular mass (M m2), r = 0.8; p = 0.01. The HP group did not present a significant correlation betw een the same variables (r = 0.01; p = 0.8).
Fig. 1 – Analysis of the cortisol variation in the pre- and post-comparing
the HP and NP groups
Pre Post
Fig. 2 – Correlation betw een the delta of the C intake (% ) and the
post-intervention muscular cross section area
NP Group
M
us
c
ular area (c
m
2)
Carbohydrate intake delta (%)
TABLE 6
Correlation betw een nutritional, anthropometric and strength variables
r
Area M2 D (%) area M OT2
HP NP HP NP HP NP
C(% )2 –0.50 –0.32* –0.37 –0.20 0.40 0.85* D% C(% ) –0.13 –0.9** –0.30 –0.58 0.28 0.82*
M m2 –0.73 –0.9* * –0.37 –0.28 0.01 0.8**
* P = 0.01; * * p = 0.02. The softw are used w as the SPSS (version 10.0).
Area M 2 = M uscular cross section area after the intervention; D (% ) area M = delta percentual of the muscular cross section area; OT2 = overhead triceps exercise post intervention. C (% )2 = Carbohydrate intake (g); D% C (% ) = delta percentual of the consumed carbohydrate (% ).
The NP group also presented a positive correlation betw een the increase in the carbohydrate intake (C2% ) and the increase in the strength to the overhead triceps (OT) exercise, r = 0.85; p = 0.04, it w as observed no significant correlation betw een both vari-ables in the HP group (r = 0.4; p = 0.3).
There w as a positive correlation betw een the increase in the muscular mass (M m2) and the increase in the M 2 area (r = 0.9; p = 0.02) in the NP group; the HP group did not present a significant correlation betw een both variables (0.73; p = 0.09).
DISCUSSION
Rev Bras M ed Esporte _ Vol. 12, Nº 1 – Jan/Fev, 2006
47e
had a 14% intake of protein (1.8 g.kg-1.d-1), and 63% carbohydrate.According to Lemon(10), 0.89 g.kg-1.d-1 of protein are required to keep a positive nitrogenous balance in sedentary individuals, but for endurance athletes and individuals practicing resistance exer-cises, such positive balance occurs w ith a 1.2-1.5 g.kg-1.d-1 intake, respectively.
Results attained in the paired t-test show that the supplement and the physical activity w ere effective w ithin each group in pro-moting the increase in the mass, in the muscular cross section area and the strength increase after the eight w eek period.
Tarnopolsky(11) verified that w henever the protein intake in the diet increases from 0.86 to 1.4 g.kg-1.d-1, the protein synthesis increases in men submitted to the resistance training, but w hen the intake is higher than 2.4 g.kg-1.d-1, no significant difference w as found. Nevertheless, the authors did not use the carbohy-drate supplement in order to allow some comparison. It w as found no significant differences as to the anthropometric data to the strength variables and to the insulin analysis.
It is important to point out that the collection w as performed after a 12 hour of starvation period, and so, it did not represent the acute effect w hich is provoked right after a training session same as it is done by other authors.
In this paper, it w as verified significant differences in the corti-sol concentrations, the NP group presented a –18.1% decrease, and the HP group a 33.6% increase. Thyfault(12) verified the acute effect w ith liquid carbohydrate supplement (1 g.kg-1.d-1) before and after the activity) or the placebo supplement associated to the resistance exercise (2-day training). It w as analyzed the cortisol, insulin, ammonia, and glycosis concentrations, and it w as verified an increase in the insulin concentrations after the exercise and one and a half hour after the activity ended. There w as no signifi-cant difference to other hormones upon the comparison ob both groups.
According to the correlation analysis, it is believed that the strength increase to the seated triceps extension is directly asso-ciated to the increase in the muscular mass and the carbohydrate intake in the HP group. By means of the analysis, it w as show n that the NP group presented a higher increase in the muscular cross section area compared to the HP group.
Rozenek(13) submitted tw o groups to the resistance training (four series of eight repetitions at 70% 1-M R, 10 exercises for eight w eeks) and supplement. A group received 356 g of glycosis and 1.7 g.kg-1.d-1 of protein (placebo group) in an amount equivalent to a surplus of 2,020 kcal per day. There w as no significant differ-ence betw een both groups. The authors raised the hypothesis that there must be an optimization limit of the consumed protein, and w hen such limit is surpassed, probably there are no benefits as to the strength and muscular mass gain.
Despite it w as not performed certain dosages w hich could ver-ify the accuracy of this fact, it is believed that the high protein concentration (4 g.kg-1.d-1) should provoke an unbalance in the Krebs cycle to the energetic production due to the lack of the carbohy-drate substrate, thus increasing the ketonic bodies concentrations, an increase in the cortisol concentrations compromising the pro-tein synthesis. On the other hand, it w as verified a decrease in the cortisol concentrations in the NP group follow ed by a positive cor-relation betw een the carbohydrate intake and the increase in the muscular cross section area, suggesting that the carbohydrate supplement (225 g.d-1) associated to the 1.8 g.kg-1.d-1 protein
in-take and to the resistance training is favorable to the increase in the protein synthesis. It is believed that the positive correlation betw een the anthropometric variables and only the carbohydrate intake is a consequence of the increase in the insulin concentra-tions after the consumption, resulting in a decrease in the chronic cortisol concentrations, promoting a better environment for anab-olism.
CONCLUSION
The NP group presented a positive correlation betw een the car-bohydrate intake and the increase in the m uscular m ass and strength to the seated triceps extension. According to the results presented in this study, carbohydrate supplemented individuals (225 g.d-1) associated to the protein intake of 1.8 g.kg-1.d-1 w hen submitted to the resistance training presented a higher increase in the muscular mass compared to individuals submitted to the same supplemented training w ith 4 g.kg-1.d-1. It w ill be required further studies in order to clarify the role of the protein and the carbohydrate in the promotion of the protein synthesis in resis-tance exercise practitioners. It is not know n for sure the mecha-nism involving the high protein supplement in the muscular and strength gain process.
All the authors declared there is not any potential conflict of inter-ests regarding this article.
REFERENCES
1. U.S. Department of Health and Human Services. Physical Activity and Health: A Report of the Surgeon General. Atlanta, GA: Centers for Disease Control and Prevention (CDC), National Center for Chronic Disease Prevention and Health Promotion, 1996.
2. Hurley BF, Hagberg JM . Optimizing health in older persons: aerobic or strength training. Exerc Sport Sci Rev 1998;26:61-89.
3. Jackson AA. Limits of adaptation to high dietary protein intakes. Eur J Clin Nutr 1999;53(1S):S44-52.
4. Wolfe RR. Protein supplements and exercise. Am J Clin Nutr 2000;72(Suppl):1-7.
5. Borg G. Borg’s perceived exertion and pain scales. Champaign: Human Kinetics, 1998.
6. Durning JVGA, Womersley J. Body fat assessed from total body density and its estimation from skinfold thickness: measurement on 481 men and w omen aged from 16-72 years. . . Br J Nutr 1974;32:72-97.
7. Siri WE. Body composition from fluid spaces and density. Analysis of methods in techniques for measuring body composition. Washington, DC National Academy of Sciences, National Research Council, 1961;223-4.
8. Neu CM , Rauch F, Rittw eger J, M anz F, Schoenau E. Influence of puberty on muscle development at the forearm. American Journal of Physiology Endocrinol-ogy M etabolism 2001;20:E103-7.
9. M acDougall JD, Sale DG, Alw ay SE, Sutton JR. M uscle fiber number in biceps brachii in bodybuilders and control subjects. J Appl Physiol. 1984;57:1399-403. 10. Lemon PWR, Tarnopolsky M A, M acDougall JD, Atkinson A. Protein requirements
and muscle mass/strength changes during intensive training in novice bodybuild-ers. J Appl Physiol 1992;73:767-75.
11. Tarnopolsky M A, Atkinson SA, M acDougall JD, Chesley A, Phillips S, Schw arcz HP. Evaluation of protein requirements for trained strength athletes. J Appl Phys-iol 1992;73:1986-95.
12. Thyfault JP, Carper M J, Richmond SR, Hulver M W, Potteiger JA. Effects of liquid carbohydrate ingestion on markers of anabolism follow ing high-intensity resis-tance exercise. J Strength Cond Res 2004;18:174-9.