(1) Universidade Federal de Santa Maria – UFSM – Santa Maria (RS), Brasil. (2) Universidade Federal do Rio Grande
do Sul – UFRGS – Porto Alegre (RS), Brasil.
Conlict of interest: non-existent
Temporal resolution and cortical potential in different levels
of English proficiency
Resolução temporal e potenciais corticais em diferentes níveis
de proficiência da língua inglesa
Sheila Jacques Oppitz(1)
Rubia Soares Bruno(1)
Dayane Domeneghini Didoné(2)
Michele Vargas Garcia(1)
Received on: April 09, 2016 Accepted on: October 13, 2016
Mailing address: Sheila Jacques Oppitz
Rua Duque de Caxias, nº 1286, Centro, Santa Maria (RS), Brasil
CEP: 97015-190
E-mail: [email protected]
ABSTRACT
Purpose: to investigate and compare hearing abilities in normal hearing bilingual students, at different levels of English proiciency (basic, intermediate and advanced), using behavioral testing and electrophy-siological testing.
Methods: this study is descriptive, quantitative and transversal. The sample consisted of 60 subjects (lan-guage schools students at different English proiciency levels: 20 at advanced level (AG); 20 at interme-diate level (IG); 20 at basic level (BG)) with normal hearing and no complaints about auditory processing abilities, aged 18-35 years. They were subjected to behavioral test: Random Gap Detection Test (RGDT) that assesses ability of temporal resolution; and electrophysiological test Long Latency Auditory Evoked Potential (LLAEP) with verbal stimuli (syllables /ba/ - frequent stimulus and /di/ - rare stimulus) evaluating memory, attention and auditory discrimination.
Results: it was noticed a statistically signiicant difference between ears for: BG, to amplitude of N1 and P2, with higher values for left ear; IG to amplitude of P1, N1 and P2, with higher values for left ear; AG to latency of N1, with higher values for left ear, and amplitudes of components P2, N2 and P3, with higher values for left ear. Between groups, RGDT showed lower values of AG, and latency of N1 component, with higher values for BG.
Conclusion: there were signiicant differences in temporal resolution ability, better for students in advan-ced level of English and also to the latency of evoked cortical N1 with higher values for students at a basic level.
Keywords: Hearing; Bilingualism; Electrophysiology; Event-Related Potentials, P300; Adult
RESUMO
Objetivos: investigar e comparar as habilidades auditivas entre normo-ouvintes bilíngues estudantes de diferentes níveis de proiciência do inglês por meio de teste comportamental e eletroisiológico. Métodos: este estudo tem caráter descritivo, quantitativo e transversal. A amostra foi composta por 39 sujeitos (alunos de escolas de idiomas: 13 no nível avançado (GA); 13 no nível intermediário (GI); 13 no nível básico (GB)), com idade entre 18 a 35 anos, limiares auditivos tonais dentro dos limites da norma-lidade e sem queixas de habinorma-lidades de processamento auditivo. Foram submetidos aos testes compor-tamentais: teste de detecção de gap (RGDT); e ao teste eletroisiológico potencial evocado auditivo de longa latência (PEALL), com estímulos verbais (sílabas /ba/ – frequente – e /di/ – raro)
Resultados: veriicou-se diferença estatisticamente signiicante entre as orelhas para: o GB, para a ampli-tude de N1 e P2, com maiores valores para a orelha esquerda; o GI, para a ampliampli-tude de P1, N1 e P2, com maiores valores para a orelha esquerda, o GA, para a latência do componente N1, com maiores valores para a orelha esquerda, e, para as amplitudes dos componentes P2, N2 e P3, com maiores valores para a orelha esquerda. Entre os grupos, o teste RGDT mostrou menores valores para GA e para latência do componente N1, com maiores valores para o GB. Conclusões: pode-se concluir que o nível de proiciência avançado da língua inglesa estimula a velocidade de conexões neurais desencadeando a ocorrência mais rápida do potencial N1, assim a habilidade de resolução temporal é signiicantemente melhor à medida que o tempo de estudo aumenta.
28 | Oppitz SJ, Bruno RS, Didoné DD, Garcia MV
INTRODUCTION
In Brazil, the bilingual population is constantly increasing, to the point that, if those who learn a second language in school are considered bilingual, certainly the number of monolingual turn out to be quite inferior to bilingual Brazilian population. Such a scenario is consistent to what occurs in the international prospect, in which it is estimated that more than half of the population use two or more languages to interact in society1.
Currently 6,909 languages are identiied, used by
5,959,511,717 speakers2. These igures relect the
diversity of the cultures to which they are exposed and the importance of understanding and to be clearly understood in the society which one lives in. In addition, all societies, regardless of their level of development, recognize the importance of the teaching of a second language3. It is proof that, increasingly, it is necessary
to know how the brain processes and organizes infor-mation in bilingual individuals, as well as become aware of that exposure to a second language can change the auditory processing skills.
The information processing is called auditory processing, which refers not only to the perception
of sound, but also to the eficiency and effectiveness
with which the central nervous system uses the
auditory information, including a set of speciic skills,
of which the individual relies on to understand what
happened, as the ability of identiication, analysis,
storage and retrieval of auditory information4, which
can be evaluated behaviorally or electrophysiological (objective).
Behavioral assessment of auditory processing is done with several tests that usually combine the evalu-ation of more than a skill, such as, for example, the detection test or Random Gap Detection Test – RGDT, which consists of a recent procedure of clinical evalu-ation of the ability of temporal resolution, which has a goal to determine the detection threshold of the gap5.
The research aims of the auditory processing is made by the long latency auditory evoked potentials (LLAEP) and consists in capturing potential, in order
to relect cortical activity involved in attention skills,
selection, discrimination, memory and decision6. Part
of the positive and negative waves LLAEP, subdivided into potential exogenous or cortical evoked potentials
(P1, P2, N1, N2), which are inluenced by the physical
characteristics of the stimulus, such as intensity, duration and frequency, and the endogenous or
cognitive potential (P3), predominantly inluenced by
events related to cognitive skills7.
Currently, it is known that the advantages associated with bilingualism are evident, especially when they
concern the settlement of conlicts and to improve
the executive functions. Exposure to two different
languages can facilitate signiicantly the cognitive
differentiation in bilingual subjects, which extend their verbal skills. Besides being easier to take ownership of the differentials, bilingual people tend to perform better on tasks of warning, monitoring and exchange of tasks, whereas the regular use of two languages requires greater control to use attention and selection of language8.
In the area of School and Educational Psychology, a similar study to the one presented here was found, regarding the levels of learning in a private educational institution of the English language, which aimed to study the relationship between creativity, intelligence and self-concept in monolingual students (Portuguese) and bilingual (Portuguese/English). The sample was composed of 269 students, with an average of 22.41 years of age, ranging between 14 and 57 years. They considered 190 bilingual students participating on the
last semester of advanced English course, with proi -ciency in written and oral skills, and considered the other 79 students, monolingual. These were selected
in the irst and second semester of English course,
for presenting little or no knowledge of the English language. As a result, the students presented higher
scores in bilingual of igurative and verbal creativity and
intelligence when compared to monolingual students9.
language did not favor general learning (improves the pronunciation) of the second language of the group as a whole, but has improved its ability of temporal processing10.
Considering the above, the objective of this study was to investigate and compare auditory skills in normo-listeners language schools students at different
levels of English proiciency (basic, intermediate and
advanced) through behavioral and electrophysiological test test.
METHODS
The present study was a survey of quantitative approach of transversal character, which compares
the auditory indings in bilingual Portuguese/English
individuals’ students of language schools. Search procedures were performed individually in Audiology outpatient clinic of a teaching Hospital in the State.
This study was registered in the Project Ofice,
under the number 036184, and approved by the
Research Ethics Committee, with certiicate number
29325714.1.0000.5346, on April 8th, 2014.
The sample was divided into three groups of adults normo-listeners aged 18 to 35 years, with 13 individuals each: Advanced Group (GA), which includes speakers of Brazilian Portuguese and in process of late English
language bilingualism (luent) (advanced level
students of language schools); Intermediate Group (GI), composed by Brazilian Portuguese speakers in process of late English bilingualism (students of inter-mediate level of language schools); and Basic Group (GB), including speakers of Brazilian Portuguese and in process of late English bilingualism (students of basic level of language schools). This distribution in learning levels comply with the criteria used by the
schools in their deined curriculum guidelines that
direct the learning and development of the student in the standardized levels.
Inclusion criteria: tone hearing thresholds within the limits of normality; Type A tympanogram and
contralateral acoustic relexes present; be a student of
a language school in basic, intermediate or advanced
level of English language; not have luency in speaking
and understanding of any language other than Portuguese and English; being right handed and have, at least, incomplete higher education.
Exclusion criteria: subject older than 35 or younger than 18 years of age; with hearing loss; with updates
to the middle ear; with complaints of dificulty to under -stand speech in quiet and noisy environments; with
memory and attention dificulties; play any musical
instrument; they are left handed or have become right handed throughout life; they are early bilingual (before the six years of age11); and are multilingual.
The individuals who it the criteria for inclusion were
given a full explanation on the nature of the research,
its objectives, its procedures, the risks and beneits and the secrecy about the identiication. Those who agreed
to participate in the research voluntarily signed an informed consent.
The participants were subjected to the following evaluations: initial history, visual inspection of the external acoustic meatus, pure tone audiometry (PTA), speech reception threshold (SRT), percentage index of speech recognition (PISR), random gap detection test (RGDT) and long latency auditory evoked potential (LLAEP).
For the PTA, the SRT and the PISR, a two-channel audiometer was used, brand Fonix Hearing Evaluator, FA 12 model type I, and headset type TDH-39 p, from Telephonics, through which were surveyed hearing thresholds of airway in the frequencies of 250 to 8000 Hz, monaural form. The technique used was descended-and the upward normal criterion was of hearing thresholds to 25 dB, as the average tritonal (MTT) of frequencies of 500, 1000 and 2000 Hz12.
The SRT and PISR were surveyed and the monaural form SRT with two syllable word lists, and the PISR with monosyllabic word lists. The SRT was researched through downward-upward technique. For the PISR, 40 dB were added to the average frequencies of 500, 1000 and 2000 Hz, beyond the conforto level search13.
The RGDT has been performed the dBNS 40 added to the MTT, to evaluate the ability of temporal resolution. The subjects were instructed to respond verbally to the appraiser if you were listening to one or two sounds.
In LLAEP, individuals had to remain on alert and tell rare stimuli (20% of the total stimulus) that appeared randomly, ignoring frequent stimuli (80% of the total stimulus). The electrodes were attached to the skin of individuals with conductive electrolyte folder in the vertex (Cz), left mastoid (A1), right mastoid (A2) and control on their forehead. The equipment used was the SmartEP model, Intelligent Hearing-branded Systems (IHS). The electrode impedance was less than 03 Kohm.
System), version 9.2 SAS Institute Inc., 2002-2008, Cary, NC, USA.
To compare performance in tests between the ears (RE and LE), McNemar’s test was used for categorical variables, for related samples and the Wilcoxon test, for samples related to numeric variables.
To compare performance in tests between the groups, we used the Fisher exact test, for expected
values less than ive. For comparison of the
numerical variables between groups, it was used the Mann-Whitney test, due to the absence of normal distribution of the variables. The tests were considered
signiicant with conidence level above 95% (p < 0.05).
RESULTS
Descriptive analyses related to age and genre are described in table 1. In which there was no statistically
signiicant difference for age and gender among the
three study groups.
Initially, an analysis was carried out by ear in each group, to identify potential differences between them due to the hemispheric dominance (tables 2 to 4). The RGDT test will not be quoted in the analysis by ear because it was held binaurally.
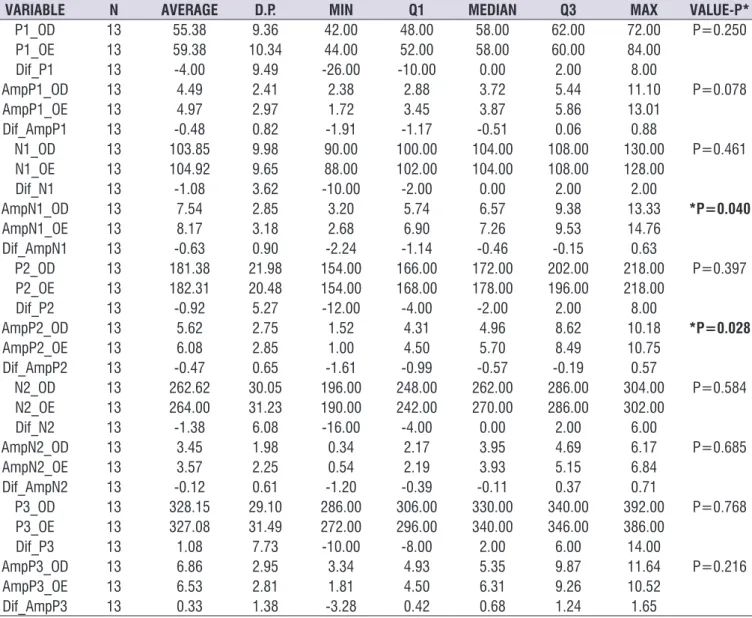
For GB, there was a statistically signiicant difference
between the ears for the amplitude of N1 and P2 with higher values for the left ear.
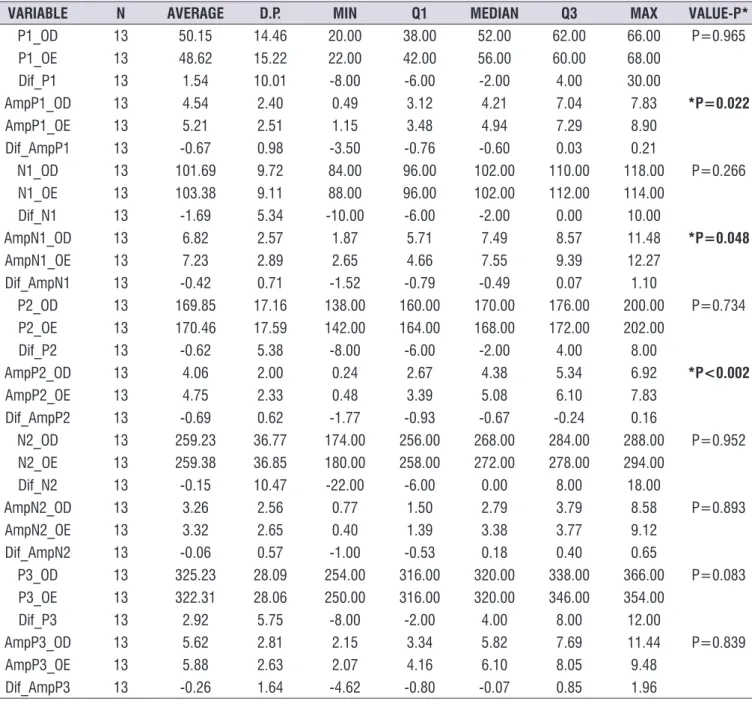
For the GI, there was a statistically signiicant
difference between the ears for the amplitude of P1, L1 and P2, with higher values for the left ear.
For GA, there were statistically signiicant differences
between the ears to the latency of the N1 component, with higher values for the left ear, as well as the ampli-tudes of the P2 components, N2 and P3, with higher values for the left ear.
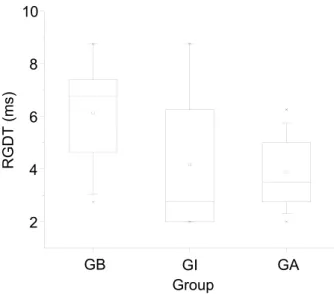
In table 5, the comparison between the groups in the RGDT test is shown, in addition to the values for
each age group. A signiicant difference was detected
between the groups with the RGDT test, showing smaller values for the GA (table 5 and Figure 1).
According to the results, a statistically signiicant
difference was found for N1 latency to the right ear, with higher values for the GB (Figure 2).
complementary information to the one obtained by behavioral standard assessment, whether by auditory and/or cognitive lingiustic reasons14. Therefore, this study was directed to the inluence of learning a second
language through auditory processing, since the use of non-verbal stimuli would entail in result bias.
It was presented a serie of 300 stimuli (240 frequent and 60 rare) with verbal stimuli (/ba/ syllables – frequent stimulus – and /di/– rare stimulus) to an intensity of 75 dB. The latency and amplitude values of the potential are expected, respectively: in P1, between 50 and 80ms; in N1, with latency between 80 and 150 ms and range of 5 to 10 µV; in P2, with latency between 145 and 180ms and range of 3 to 6 µV; in N2, with latency between 180 and 250ms and range of 8 to 15 µV; in P3, with latency between 220 and 380 ms15, and minimum
amplitude of P3 of 3 µV16. These values of
standard-ization were made for the tone burst stimulation. There is a recent study conducted with values for the speech stimuli of /ba/ and /di/, which were: P1 (OD: ms 65.5; OE: 67.2 ms), N1 (OD: 107.8 ms; OE: 109, 3ms), P2 (OD: 182.7 ms; OE: 187.1 ms), N2 (OD: 251.6 ms; OE: 261.4 ms), P3 (OD: ms 324.2; OE: 329.9 ms) and amplitude of P3 (OD: 6.3 µV; OE: 6.7 µV)17.
To the exogenous complex, the irst peak, trough,
peak, trough was considered. For the P3 component,
the irst positive peak after exogenous complex was
considered and it was expected at the circuit of the rare stimuli, where the tagging was made15. For marking of
the amplitude of the waves, for the components P1, L1, P2 and N2, the offset of the cursor in the previous sense was considered until the next peak latency, and so on. For marking of the amplitude of the P3 component, the offset of the cursor was to the posterior sense up to the closest trough. There was no record of wave playback, since collecting replication could cause fatigue and jeopardize the outcome of the evaluation, as this depends on the attention. There was no subtraction of the waves, which were used in the initial record.
Table 1. Description in percentage about gender and age groups
Age Gender
<20 20-29 ≥30 Female Male
GB 7.69 % 76.92% 15.38% 46.15% 53.85%
GI 15.38 % 69.23% 15.38% 46.15% 53.85%
GA 15.38% 69.23% 15.38% 46.15% 53.85%
P- Value P=1.000 P=1.000
Legend: GB = Basic Group; GI = Intermediate Group; GA = Advanced Group Exact age test by Fisher and gender test chi-squared.
Table 2. Analysis by ear of latencies and amplitudes of the test long-latency auditory evoked potential to the basic group
VARIABLE N AVERAGE D.P. MIN Q1 MEDIAN Q3 MAX VALUE-P*
P1_OD 13 55.38 9.36 42.00 48.00 58.00 62.00 72.00 P=0.250 P1_OE 13 59.38 10.34 44.00 52.00 58.00 60.00 84.00
Dif_P1 13 -4.00 9.49 -26.00 -10.00 0.00 2.00 8.00
AmpP1_OD 13 4.49 2.41 2.38 2.88 3.72 5.44 11.10 P=0.078
AmpP1_OE 13 4.97 2.97 1.72 3.45 3.87 5.86 13.01
Dif_AmpP1 13 -0.48 0.82 -1.91 -1.17 -0.51 0.06 0.88
N1_OD 13 103.85 9.98 90.00 100.00 104.00 108.00 130.00 P=0.461 N1_OE 13 104.92 9.65 88.00 102.00 104.00 108.00 128.00
Dif_N1 13 -1.08 3.62 -10.00 -2.00 0.00 2.00 2.00
AmpN1_OD 13 7.54 2.85 3.20 5.74 6.57 9.38 13.33 *P=0.040
AmpN1_OE 13 8.17 3.18 2.68 6.90 7.26 9.53 14.76 Dif_AmpN1 13 -0.63 0.90 -2.24 -1.14 -0.46 -0.15 0.63
P2_OD 13 181.38 21.98 154.00 166.00 172.00 202.00 218.00 P=0.397 P2_OE 13 182.31 20.48 154.00 168.00 178.00 196.00 218.00
Dif_P2 13 -0.92 5.27 -12.00 -4.00 -2.00 2.00 8.00
AmpP2_OD 13 5.62 2.75 1.52 4.31 4.96 8.62 10.18 *P=0.028
AmpP2_OE 13 6.08 2.85 1.00 4.50 5.70 8.49 10.75
Dif_AmpP2 13 -0.47 0.65 -1.61 -0.99 -0.57 -0.19 0.57
N2_OD 13 262.62 30.05 196.00 248.00 262.00 286.00 304.00 P=0.584 N2_OE 13 264.00 31.23 190.00 242.00 270.00 286.00 302.00
Dif_N2 13 -1.38 6.08 -16.00 -4.00 0.00 2.00 6.00
AmpN2_OD 13 3.45 1.98 0.34 2.17 3.95 4.69 6.17 P=0.685
AmpN2_OE 13 3.57 2.25 0.54 2.19 3.93 5.15 6.84
Dif_AmpN2 13 -0.12 0.61 -1.20 -0.39 -0.11 0.37 0.71
P3_OD 13 328.15 29.10 286.00 306.00 330.00 340.00 392.00 P=0.768 P3_OE 13 327.08 31.49 272.00 296.00 340.00 346.00 386.00
Dif_P3 13 1.08 7.73 -10.00 -8.00 2.00 6.00 14.00
AmpP3_OD 13 6.86 2.95 3.34 4.93 5.35 9.87 11.64 P=0.216
AmpP3_OE 13 6.53 2.81 1.81 4.50 6.31 9.26 10.52
Dif_AmpP3 13 0.33 1.38 -3.28 0.42 0.68 1.24 1.65
Table 3. Analysis of latencies and amplitudes of the test long-latency auditory evoked potential by ear for the intermediate group
VARIABLE N AVERAGE D.P. MIN Q1 MEDIAN Q3 MAX VALUE-P*
P1_OD 13 50.15 14.46 20.00 38.00 52.00 62.00 66.00 P=0.965 P1_OE 13 48.62 15.22 22.00 42.00 56.00 60.00 68.00
Dif_P1 13 1.54 10.01 -8.00 -6.00 -2.00 4.00 30.00
AmpP1_OD 13 4.54 2.40 0.49 3.12 4.21 7.04 7.83 *P=0.022
AmpP1_OE 13 5.21 2.51 1.15 3.48 4.94 7.29 8.90
Dif_AmpP1 13 -0.67 0.98 -3.50 -0.76 -0.60 0.03 0.21
N1_OD 13 101.69 9.72 84.00 96.00 102.00 110.00 118.00 P=0.266 N1_OE 13 103.38 9.11 88.00 96.00 102.00 112.00 114.00
Dif_N1 13 -1.69 5.34 -10.00 -6.00 -2.00 0.00 10.00
AmpN1_OD 13 6.82 2.57 1.87 5.71 7.49 8.57 11.48 *P=0.048
AmpN1_OE 13 7.23 2.89 2.65 4.66 7.55 9.39 12.27 Dif_AmpN1 13 -0.42 0.71 -1.52 -0.79 -0.49 0.07 1.10
P2_OD 13 169.85 17.16 138.00 160.00 170.00 176.00 200.00 P=0.734 P2_OE 13 170.46 17.59 142.00 164.00 168.00 172.00 202.00
Dif_P2 13 -0.62 5.38 -8.00 -6.00 -2.00 4.00 8.00
AmpP2_OD 13 4.06 2.00 0.24 2.67 4.38 5.34 6.92 *P<0.002
AmpP2_OE 13 4.75 2.33 0.48 3.39 5.08 6.10 7.83
Dif_AmpP2 13 -0.69 0.62 -1.77 -0.93 -0.67 -0.24 0.16
N2_OD 13 259.23 36.77 174.00 256.00 268.00 284.00 288.00 P=0.952 N2_OE 13 259.38 36.85 180.00 258.00 272.00 278.00 294.00
Dif_N2 13 -0.15 10.47 -22.00 -6.00 0.00 8.00 18.00
AmpN2_OD 13 3.26 2.56 0.77 1.50 2.79 3.79 8.58 P=0.893 AmpN2_OE 13 3.32 2.65 0.40 1.39 3.38 3.77 9.12
Dif_AmpN2 13 -0.06 0.57 -1.00 -0.53 0.18 0.40 0.65
P3_OD 13 325.23 28.09 254.00 316.00 320.00 338.00 366.00 P=0.083 P3_OE 13 322.31 28.06 250.00 316.00 320.00 346.00 354.00
Dif_P3 13 2.92 5.75 -8.00 -2.00 4.00 8.00 12.00
AmpP3_OD 13 5.62 2.81 2.15 3.34 5.82 7.69 11.44 P=0.839 AmpP3_OE 13 5.88 2.63 2.07 4.16 6.10 8.05 9.48
Dif_AmpP3 13 -0.26 1.64 -4.62 -0.80 -0.07 0.85 1.96
DISCUSSION
The comparative discussion between the values obtained with the results of previous studies is imprecise because there are no studies showing the differentiation between the ears to the exogenous LLAEP’s potential; the parameters of analysis of records only for the endogenous potential converge P3 regarding to latency and amplitude. Few studies have focused on other components of LLAEP. Therefore,
you cannot argue with studies of bilingualism, as there is no research with the same focus. The discussion will be made by exploiting what has already been vetted potential exogenous to the moment your order of latency (P1, P2, N1, N2 and P3), showing the impor-tance of studies which deepen in this investigation.
Through the use of verbal stimuli, it is possible to obtain additional information about the biological processes involved in speech processing. Thus, such stimuli are of great value to the clinical practice, since
Table 4. Analysis of latencies and amplitudes of the test long-latency auditory evoked potential by ear for the away team
VARIABLE N AVERAGE D.P. MIN Q1 MEDIAN Q3 MAX VALUE-P*
P1_OD 13 45.69 13.71 20.00 36.00 52.00 56.00 64.00 P=0.370 P1_OE 13 48.77 11.12 26.00 44.00 52.00 56.00 62.00
Dif_P1 13 -3.08 9.33 -26.00 -6.00 -2.00 4.00 8.00
AmpP1_OD 13 3.88 1.10 1.65 3.24 3.83 4.07 6.17 P=0.425 AmpP1_OE 13 4.09 1.33 2.26 3.09 4.04 5.05 6.93
Dif_AmpP1 13 -0.21 0.92 -1.93 -0.76 -0.31 0.43 1.49
N1_OD 13 95.69 7.11 80.00 94.00 96.00 98.00 108.00 *P=0.047
N1_OE 13 100.00 8.49 82.00 98.00 102.00 104.00 114.00 Dif_N1 13 -4.31 6.97 -18.00 -6.00 -2.00 0.00 6.00
AmpN1_OD 13 6.88 3.05 2.86 5.38 5.87 8.86 14.32 P=0.127 AmpN1_OE 13 7.63 4.06 3.49 4.86 7.03 9.58 18.87
Dif_AmpN1 13 -0.74 1.63 -4.55 -0.75 -0.33 0.07 1.48
P2_OD 13 176.92 26.14 146.00 158.00 168.00 196.00 226.00 P=0.375 P2_OE 13 174.77 23.13 148.00 158.00 166.00 190.00 226.00
Dif_P2 13 2.15 6.71 -6.00 0.00 0.00 4.00 20.00
AmpP2_OD 13 4.81 2.78 0.48 2.22 4.98 6.65 9.55 *P=0.048
AmpP2_OE 13 5.39 3.02 0.81 3.82 5.66 6.41 10.68 Dif_AmpP2 13 -0.58 0.87 -2.12 -1.11 -0.85 0.24 0.58
N2_OD 13 259.54 41.49 188.00 240.00 278.00 280.00 300.00 P=0.629 N2_OE 13 264.52 34.04 188.00 262.00 278.00 286.00 296.00
Dif_N2 13 -5.08 23.00 -74.00 -8.00 0.00 2.00 28.00
AmpN2_OD 13 2.55 1.91 0.55 1.14 1.83 3.86 6.69 *P=0.042
AmpN2_OE 13 2.92 2.01 0.43 1.42 2.75 3.45 7.27 Dif_AmpN2 13 -0.37 0.68 -1.88 -0.65 -0.52 0.12 0.50
P3_OD 13 328.00 17.46 306.00 316.00 324.00 338.00 370.00 P=0.308 P3_OE 13 325.54 17.42 298.00 316.00 324.00 338.00 364.00
Dif_P3 13 3.23 8.96 -8.00 -4.00 0.00 10.00 22.00
AmpP3_OD 13 4.24 1.78 0.71 4.08 4.23 4.96 6.92 *P=0.040
AmpP3_OE 13 4.81 2.01 1.18 4.15 5.26 5.98 8.25 Dif_AmpP3 13 -0.57 0.85 -1.72 -1.22 -0.66 -0.14 1.11
Table 5. Comparison between groups, by ear, to the Random Gap Detection Test and for each age group values
Group VARIABLE N AVERAGE D.P. MIN Q1 MEDIAN Q3 MAX VALUE-P*
GB Age 13 23.54 4.35 18.00 21.00 22.00 25.00 32.00 P=0.993 RGDT 13 6.14 1.86 2.75 5.0 6.75 7.30 8.75 *P=0.011(A)
GI Age 13 23.77 4.19 19.00 20.00 23.00 27.00 31.00 RGDT 13 4.17 2.61 2.00 2.00 2.75 6.25 8.75 GA Age 13 24.08 5.06 18.00 20.00 23.00 27.00 35.00
RGDT 13 3.88 1.21 2.00 2.75 3.50 5.00 6.25
* Value-P referes to the Kruskal-Wallis test for comparing the values between the three groups. Measures ledeng: Age (years). (A) ’GB’≠’GI’; ’GB’≠’GA’.
GB = Basic group; GI = Intermediate group; GA = Advanced group
2 4 6 8 10
GA GI
GB
Group
R
G
D
T
(ms)
Legend = GB = Basic group; GI = Intermediate group; GA = Advanced group
Figure 1. Comparative Analysis of the Random test Gap Detection
Test between the three groups
80 90 100 110 120 130 140
GA GI
GB
Group
La
tê
nc
ia
N
1
O
D
(ms)
Legend = GB = Basic group; GI = Intermediate group; GA = Advanced group
Figure 2. Comparative Analysis of the N1 component latency
between the three groups
they provide additional information to those obtained by standard behavioral assessment, whether by linguistics, auditory and/or cognitive reasons14. Therefore, this study was directed to the inluence of learning a second
language in auditory processing, using non-verbal stimuli would not affect the results, as analyzed in a recent national study that compared different verbal stimuli and tone burst. The study found that there were no statistical differences for components P1, L1 and P2 between the four stimuli used; However, there was no statistical difference for N2 and P3, with lower latency values for tone burst stimulation. These results make us think that maybe the tone burst stimulation offers low sensitivity to capture subject changed. In addition,
the largest P3 latency was statistically signiicant with
the verbal stimulus /ba/ and /ga/, and greater latency for N2 with the verbal stimulus /ba/ and /di/, there is
no difference for the amplitude of P3 between the four estimuli17.
The P1 is a positive wave component, able to relect
changes in the auditory central nervous system (ACNS), generated by the activity of Thalamic-cortical circuit in stimulation of sounds from the neuronal plasticity, a phenomenon which is essential for the development of auditory skills and language18.
Several studies indicate that reducing the lag time of P1 is associated with improvement of communi-cative behaviors (vocalization)19, the perception of
speech20 and also the skills of speech and language in
children21. This component has been the most widely
curl P1 develops quickly after activation of the cochlear implant, reaching normal values between 3 and 8 months of device use23,24. However, no studies were
found dealing with the extent of that potential.
In the present study, a statistically signiicant
difference was detected between the ears for the breadth of potential P1 in the GI, with higher values for the left ear (5.21 µV) when compared to the right (4.54 µV) (table 3). This may mean that the
intermediate-level proiciency in English language would cause
some change in relation to communicative behaviors, featuring improved speech perception. Note that the breadth of the right ear is outside of the normal patterns of 5 to 10 µ V15.
The exogenous component N1 has the supra-temporal auditory cortex as generator site, respon-sible for the attention and the initial decoding of the stimulus. It was observed, in research, greater values for the latency of N1 in school with learning complaints, showing basic changes of auditory processing in this population25. However, recent studies were not found
on the magnitude of this potential.
In this study, statistically signiicant differences were
noticed in the N1 component for the three groups: GB, GI and GA.
Regarding the amplitude of N1 between ears, there were higher values for the left ear in GB and GI, with averages, respectively, of 8.17 µV when compared to the right of 7.54 µV (table 2) and 7.23 µV to the left when compared to the right of 6.82 µV (table 3). It was observed that the largest amplitude values were
recorded for the intermediate level of English proi -ciency, although all are within the normal standards of 5 to 10 µ V15.
Regarding to N1 exogenous latency, a statistical difference was detected in GA, with higher values for the left ear, with ms 100.00, when compared to the right of 95.69 ms (table 4). Still in the comparison between groups, there was statistical difference with higher values of right ear to the GB, with an average 103.85 ms, when compared to the GI, with ms 101.69, and GA with 95.69 ms (table 6). It was observed that the GA probably has greater speed and initial decoding of the stimulus. It was also observed that both are within the normal standards of 80 and 150 ms15.
The P2 has wave generators in various regions of the auditory cortex and primary and secondary in the reticular system, areas that are associated to the attention that the individual gives the sound stimu-lation and inhibition of competitive stimuli processing, which, in turn, relates and acoustic characteristics of the temporal estimuli26. There is a recent study in which children with attention deicit hyperactivity disorder
(ADHD) presented a higher amplitude of P2 wave, which suggests that these children need greater activation of generators to ensure that sites remained attentive and, consequently, could differentiate the rare stimuli from frequent stimuli27. In another study, the exogenous
component latency P2 had late appearance in school
learning disorder showing a deicit on encoding and
on characterization of information received via central hearing25.
As a result of this study, in terms of the amplitude of P2, statistical differences with higher values for the left ear in GB, in GI and at GA, with averages, respectively, of 6.08 µV when compared to the right of 5.62 µV (table 2), 4.75 µV for left ear and right ear µV 4.06 (table 3) and 5.39 µV for left ear and right ear µV 4.81 (table 4). All range values are within the standards of normality between 3 and 6 µ V15. However, this is normative for the tone burst stimulation; There are still no studies with normality to this cortical potential.
The wave N2 is considered a mixed component for being elicited both by exogenous and endogenous factors28. This contributes to the potential discrimination
of acoustic characteristics of the physical stimuli and also relates the endogenous factors relating to auditory sensory processing, responsible for the activities of attention, perception, discrimination and recognition of sounds. In a current study, passive and automatic pre-atentional response, elicited by a rare stimulus discrimination, amidst the frequent stimuli, during
regis-tration of LLAEP, was very deicient in schoolchildren
with learning disability, being the indicator functions of discrimination and were attention altered25.
Table 6. Comparison between groups, by ear, of long-latency auditory evoked potential test
Group VARIABLE N AVERAGE D.P. MIN Q1 MEDIAN Q3 MAX VALUE-P*
GB
P1_OD 13 55.38 9.36 42.00 48.00 58.00 62.00 72.00 P=0.173
AmpP1_OD 13 4.49 2.41 2.38 2.88 3.72 5.44 11.10 P=0.736
N1_OD 13 103.85 9.98 90.00 100.00 104.00 108.00 130.00 *P=0.044(B)
AmpN1_OD 13 7.54 2.85 3.20 5.74 6.57 9.38 13.33 P=0.755
P2_OD 13 181.38 21.98 154.00 166.00 172.00 202.00 218.00 P=0.587
AmpP2_OD 13 5.62 2.75 1.52 4.31 4.96 8.62 10.18 P=0.520
N2_OD 13 262.62 30.05 196.00 248.00 262.00 286.00 304.00 P=0.922
AmpN2_OD 13 3.45 1.98 0.34 2.17 3.95 4.69 6.17 P=0.484
P3_OD 13 328.15 29.10 286.00 306.00 330.00 340.00 392.00 P=0.971
AmpP3_OD 13 6.86 2.95 3.34 4.93 5.35 9.87 11.64 P=0.074
P1_OE 13 59.38 10.34 44.00 52.00 58.00 60.00 84.00 P=0.093
AmpP1_OE 13 4.97 2.97 1.72 3.45 3.87 5.86 13.01 P=0.505
N1_OE 13 104.92 9.65 88.00 102.00 104.00 108.00 128.00 P=0.528
AmpN1_OE 13 8.17 3.18 2.68 6.90 7.26 9.53 14.76 P=0.714
P2_OE 13 182.31 20.48 154.00 168.00 178.00 196.00 218.00 P=0.300
AmpP2_OE 13 6.08 2.85 1.00 4.50 5.70 8.49 10.75 P=0.517
N2_OE 13 264.00 31.23 190.00 242.00 270.00 286.00 302.00 P=0.792
AmpN2_OE 13 3.57 2.25 0.54 2.19 3.93 5.15 6.84 P=0.725
P3_OE 13 327.08 31.49 272.00 296.00 340.00 346.00 386.00 P=0.955
AmpP3_OE 13 6.53 2.81 1.81 4.50 6.31 9.26 10.52 P=0.307
GI
P1_OD 13 48.62 15.22 22.00 42.00 56.00 60.00 68.00
AmpP1_OD 13 5.21 2.51 1.15 3.48 4.94 7.29 8.90
N1_OD 13 103.38 9.11 88.00 96.00 102.00 112.00 114.00
AmpN1_OD 13 7.23 2.89 2.65 4.66 7.55 9.39 12.27
P2_OD 13 170.46 17.59 142.00 164.00 168.00 172.00 202.00
AmpP2_OD 13 4.75 2.33 0.48 3.39 5.08 6.10 7.83
N2_OD 13 259.38 36.85 180.00 258.00 272.00 278.00 294.00
AmpN2_OD 13 3.32 2.65 0.40 1.39 3.38 3.77 9.12
P3_OD 13 322.31 28.06 250.00 316.00 320.00 346.00 354.00
AmpP3_OD 13 5.88 2.63 2.07 4.16 6.10 8.05 9.48
P1_OE 13 50.15 14.46 20.00 38.00 52.00 62.00 66.00
AmpP1_OE 13 4.54 2.40 0.49 3.12 4.21 7.04 7.83
N1_OE 13 101.69 9.72 84.00 96.00 102.00 110.00 118.00
AmpN1_OE 13 6.82 2.57 1.87 5.71 7.49 8.57 11.48
P2_OE 13 169.85 17.16 138.00 160.00 170.00 176.00 200.00
AmpP2_OE 13 4.06 2.00 0.24 2.67 4.38 5.34 6.92
N2_OE 13 259.23 36.77 174.00 256.00 268.00 284.00 288.00
AmpN2_OE 13 3.26 2.56 0.77 1.50 2.79 3.79 8.58
P3_OE 13 325.23 28.09 254.00 316.00 320.00 338.00 366.00
Group VARIABLE N AVERAGE D.P. MIN Q1 MEDIAN Q3 MAX VALUE-P*
GA
P1_OD 13 45.69 13.71 20.00 36.00 52.00 56.00 64.00
AmpP1_OD 13 3.88 1.10 1.65 3.24 3.83 4.07 6.17
N1_OD 13 95.69 7.11 80.00 94.00 96.00 98.00 108.00
AmpN1_OD 13 6.88 3.05 2.86 5.38 5.87 8.86 14.32
P2_OD 13 176.92 26.14 146.00 158.00 168.00 196.00 226.00
AmpP2_OD 13 4.81 2.78 0.48 2.22 4.98 6.65 9.55
N2_OD 13 259.54 41.49 188.00 240.00 278.00 280.00 300.00
AmpN2_OD 13 2.55 1.91 0.55 1.14 1.83 3.86 6.69
P3_OD 13 328.77 17.46 306.00 316.00 324.00 338.00 370.00
AmpP3_OD 13 4.24 1.78 0.71 4.08 4.23 4.96 6.92
P1_OE 13 48.77 11.12 26.00 44.00 52.00 56.00 62.00
AmpP1_OE 13 4.09 1.33 2.26 3.09 4.04 5.05 6.93
N1_OE 13 100.00 8.49 82.00 98.00 102.00 104.00 114.00
AmpN1_OE 13 7.63 4.06 3.49 4.86 7.03 9.58 18.87
P2_OE 13 174.77 23.13 148.00 158.00 166.00 190.00 226.00
AmpP2_OE 13 5.39 3.02 0.81 3.82 5.66 6.41 10.68
N2_OE 13 264.62 34.04 188.00 262.00 278.00 286.00 296.00
AmpN2_OE 13 2.92 2.01 0.43 1.42 2.75 3.45 7.27
P3_OE 13 325.54 17.42 298.00 316.00 324.00 338.00 364.00
AmpP3_OE 13 4.81 2.01 1.18 4.15 5.26 5.98 8.25
SIGNIFICANT DIFFERENCES BY THE MULTIPLE COMPARISONS DUNN TEST(P<0.05): * Value-P referes to the Kruskal-Wallis test for comparing the values between the three groups. Measures legend: LLAEP latency (ms) and amplitudes (µV) and RGDT (ms). (B) ’GB’≠’GA’. GB = Basic group; GI = Intermediate group; GA = Advanced group
The P3 component is considered a cognitive potential, unlike the others, since corresponds to the electrical activity that occurs in the auditory system when there is a breakdown of the rare among frequent stimulation related to cognition, auditory memory and attention29. A study investigated the interhemispheric
differences related to amplitude and latency of the P330, however, no signiicant results were found, which
contradicts previously published data, according to
which the amplitude of P3 is signiicantly greater than in
the right hemisphere31.
Recent studies have demonstrated the inluence of
stimulus for the components N2 and P3. The difference between the stimuli was between speech consonantal contrasts (/ba/-/da/) and (/i/-/a/) vowel. Such research was conducted with 31 individuals without hearing, neurological and language impairments between the ages of 7 to 30 years of age32. These components are related to the processing of identiication and with
attention to the rare stimulus, with positive relationship
between the value of your latency and the level of difi -culty of the task of discriminating33.
For GA, there was a statistically signiicant difference
between the ears for the breadth of potential P3, with higher values for the left ear, at an average of 4.81 µV
and µV 4.24 to the right ear (table 4). When comparing the present research with studies that established normative values of amplitude, amplitude of not less than 3 µ V16 was obtained. However, these values have
been obtained by means of the tone burst stimulation, for being the most widely used in clinical practice.
In this study, the best results for the left ear exogenous components make us think about what might be happening with hemispheric dominance
in people at different levels of proiciency in the
English language, once, for right-handed individuals, hemispheric dominance usually is left. This may indicate that the two hemispheres would be being processed, so the second language would create a greater participation of the right hemisphere, assuming that the individual who learns a second language after the complete acquisition of the mother tongue recruit more neural connections of the right hemisphere, unlike simultaneous bilingual.
smaller left lateralization for the language in bilingual or, yet, bilingual lateralization differences for the two languages. Some studies have found differences in the direction of a greater involvement of the right hemisphere34,35.
The RGDT test, in this study, was performed binaurally, i.e. in both ears simultaneously, which is
consistent with studies that veriied the absence of beneit of an ear on the other for gap detection proce -dures36,37. This test evaluates the ability of temporal
resolution, which shows the frequency of the sound, as
well as its emergence, and contributes signiicantly to
the ability to represent the time of components phoneti-cally important speech signs38.
Therefore, a signiicant difference was observed
between the groups with the RGDT test, showing smaller values for the GA, with averages of 6.14 ms for the GB, 4.17 ms for the GI and 3.88 ms for the GA (Figure 1) and (table 5). All groups are within the standards of normality, when considering the average of four sound frequencies less than or equal to 10ms39.
This was probably due to the improvement of the ability of temporal resolution, due to the more advanced level of study of the English language, since it is essential for the understanding of speech in regards to the ability to represent the time of components for both phonetically important40 Portuguese language and English. Therefore, a greater degree of proiciency in
the second language is directly proportional to the best performance in the ability of temporal resolution.
The study presented important limitations regarding its population, sample and time consumed. There was
great dificulty in collecting part of the population set for
this study. As students of language schools, there have been restrictions in relation to the composition of the groups, because there’s no way of knowing whether the level at which the student station in English really
relects your language proiciency, since each school/
educational establishment has curriculum guidelines that direct the learning and development of the student in the standardized levels. The criteria used by each educational institution varies according to the interests of each Director of education and cannot be taken as a fully reliable parameter.
In addition, due to the size of the sample, which presented a high number of people, more than the time scheduled for all groups was spent.
The low number of current references can cause
dificulty for publication in scientiic journals, showing
the need for more studies on the subject, especially on
the exogenous components of LLAEP test, which were little explored. Similarly, the limitation of studies made it
dificult for the the author to present a positioning of in
the discussion.
From this study, it was possible to highlight the need for research that encompass the exogenous LLAEP’s potential, as well as studies with individuals in the process of bilingualism in the English language to perform more extensive discussions about this subject, which can contribute even more to the evidence of the
beneits of bilingualism.
CONCLUSION
It can be concluded that the level of advanced
proiciency in the English language stimulates neural
connections speed triggering the occurrence faster than potential N1, so the ability of temporal resolution is
signiicantly better as time increases.
REFERENCES
1. Pereira LN. A Relação do bilinguismo com capacidades cognitivas: memória de trabalho, atenção, inibição e processamento de discurso [dissertação]. Porto Alegre (RS): Pontifícia Universidade Católica do Rio Grande do Sul; 2012. 2. Savedra MMG, Liberto H, Carapeto-conceição R.
Questões de interculturalidade no ensino da língua alemã como segunda língua DaZ (Deutsch als Zweitsprache): o caso dos “ovinhos de Páscoa” (Ostereier). Pandaemonium ger. [periódico na internet]. 2010 Out [acessado em 18 de abril 2016]; 2(16): [204-19]. Disponível em: http://www.scielo. br/scielo.php
3. Almeida ilho JCP. Dimensões comunicativas no
ensino de línguas. Ed. 4, Campinas, São Paulo: Pontes Editoras; 2007.
4. American Academy of Audiology. Clinical Practice Guidelines: Diagnosis, Treatment and Management of Children and Adults with Central Auditory Processing Disorder. August, 2010.
5. Zaidan E, Garcia AP, Tedesco MLF, Baran JA. Desempenho de adultos jovens normais em dois testes de resolução temporal. Pró-Fono R. Atual. Cient. 2008;20(1):19-24.
7. Duarte JL, Alvarenga KF, Banhara MR, Mello ADP, Sás RM, Filho OAC. Potencial evocado auditivo de longa latência-P300 em indivíduos normais: valor do registro simultâneo em Fz e Cz. Braz. j. otorhinolaryngol. 2009;75(2):23-6.
8. Horst A, Kruszielski L. Bilinguismo infantil e suas implicações cognitivas. Pediatr. mod; 2013;49(10):452-6.
9. Mendonça PVCF, Fleith DS. Relação entre criatividade, inteligência e autoconceito em alunos monolíngues e bilíngues. Psicologia Escolar e Educacional. 2005;9(1):59-70.
10. Araújo LMM, Feniman MR, Carvalho FRP, Lopes-herrera SA. Ensino da Língua Inglesa: contribuições da fonética, fonologia e do processamento auditivo. Pró-Fono R. Atual. Cient. 2010;22(3):183-8.
11. Abello-contesse C. Age and the critical period hypothesis. ELT Journal. 2009; 63(2):170-2.
12. Lloyd ll. & Kaplan, 1978 apud Momensohn-Santos TM, Russo ICP, Brunettoborgianni LM. Interpretação dos resultados da avaliação audiológica. In: momensohn-Santos TM, Russo ICP. Prática da audiologia clínica. São Paulo: Cortez, 2007. p. 291-310.
13. Wilson RH, Strouse AL. Audiometria com estímulos de fala. In: Musiek FE, Rintelmann WF. Perspectivas atuais em avaliação auditiva. São Paulo: Manole; 2001. p.21-56.
14. Massa CGP, Rabelo CM, Matas CG, Schochat E, Samelli AG. P300 with verbal and nonverbal stimuli in normal hearing adults. Braz. j. otorhinolaryngol. 2011;77(6): 686-90.
15. Mcpherson DL. Late potencials of the auditory system. San Diego: Singular Publishing Group, 1996.
16. Oliveira JC, Murphy CFB, Schochat E.
Processamento auditivo (central) em crianças com dislexia: avaliação comportamental e
eletroisiológica. CoDAS. 2013; 25(1):39-44.
17. Oppitz SJ, Didoné DD, Silva DD, Gois M, Folgearini J, Ferreira GC, Garcia MV. Auditory evoked potentials of long latency with verbal and nonverbal
stimuli. Braz. j. otorhinolaryngol.http://oldiles.bjorl.
org/conteudo/acervo/visualiza_espanhol_ahad_ print.asp?id=11515. No prelo. 2015.
18. Jang JH, Jang HK, Kim SE, Oh SH, Chang SO, Lee JH. Analysis of P1 latency in normal hearing and profound sensorineural hearing loss. Clin Exp Otorhinolaryn. 2010;3(4):194-8.
19. Boéchat EM. Plasticidade e ampliicação. In:
Fernandes FDM, Mendes BCA, Nava, ALPGP, editores. Tratado de fonoaudiologia. São Paulo: Roca; 2010. p.160-8.
20. Sharma A, Nash AA, Dorman M. Cortical
development, plasticity and re-organization in children with cochlear implants. J Comm Disord. 2009;42(4):272-9.
21. Sharma A, Martin K, Roland P, Bauer P, Sweeney MH, Gilley P et al. P1 latency as a biomarker for central auditory development in children with hearing impairment. J Am Acad Audiol. 2005;16(8):564-73.
22. Sharma A, Dorman MF, Kral A. The inluence of a
sensitive period on central auditory development in children with unilateral and bilateral cochlear implants. Hear Res. 2005;203(1-2):134-43.
23. Alvarenga KF, Vicente LC, Lopes RCF, Ventura LMP, Bevilacqua MC, Moret ALM. Desenvolvimento do potencial evocado auditivo cortical P1 em crianças com perda auditiva sensorioneural após o implante coclear: estudo longitudinal. CoDAS. 2013;25(6):521-6.
24. Silva LAF, Coutob MIV, Tsujic RKT, Bentod RF, Matase CG, Carvalho ACM. Auditory pathways’ maturation after cochlear implant via cortical auditory evoked potentials. Braz. j. otorhinolaryngol. 2014;80(2):131-7.
25. Regaçone SF, Gução ACB, Giacheti CM, Romero ACL, Frizzo ACF. Potenciais evocados auditivos de longa latência em escolares com transtornos
especíicos de aprendizagem. Audiol Commun
Res. 2014;19(1):13-8.
26. Oades RD. Frontal, temporal and lateralized
brain function in children with attentiondeicit
hyperactivity disorder: a psychophysiological and neuropsychological viewpoint on development. Behav Brain Res. 1998;94(1):83-95.
27. Romero ACL, Capellini AS, Frizzo ACF. Potencial cognitivo em crianças com transtorno do
déicit de atenção com hiperatividade. Braz. j.
otorhinolaryngol. 2013; 79(5):609-15.
28. Hall J. New handbook of auditory evoked
responses. Boston: Allyn and Bacon, 2006.
30. Frizzo ACF, Alves RPC, Colafêmina J.F. Potenciais evocados auditivos de longa latência: um estudo comparativo entre hemisférios cerebrais. Rev Bras Otorrinolaringol. 2001;67(5):618-25.
31. Jaeger A, Parente MAMP. Cognição e
eletroisiologia: uma revisão crítica das perspectivas
nacionais. Psico-USF. 2010;15(2):171-80.
32. Alvarenga KF, Vicente LC, Lopes RCF, Silva RA, Banhara MR, Lopes AC, Jacob-corteletti LCB.
The inluence of speech stimuli contrast in cortical
auditory evoked potentials. Braz. j. otorhinolaryngol. 2013;79(3):336.
33. Novak GP, Ritter W, Vaughan HG JR, Wiznitzer ML. Differentiation of negative event-related potentials in an auditory discrimination task. Electroencephalogr Clin Neurophysiol. 1990;75(4):255-75.
34. Carroll F. Neurolinguistic processing of a second language: Experimental evidence. In Scarcella R, Krashen S (Eds.). Research in second language acquisition. Rowley, Mass: NewburyHouse. 1980. p. 160-80.
35. Galloway L, Scarcella R. Cerebral organization in adult second, language acquisition: Is the right hemisphere more involved? Brain and Language. 1982;16(5): 56-60.
36. Musiek FE, Shinn JB, Jirsa R, Bamiou DE, Baran JA, Zaida E. GIN (Gaps-In-Noise) Test Performance in
Subjects with Conirmed Central Auditory Nervous
System Involvement. Ear Hear. 2005;26(6):608-18. 37. Chermak G, Lee J. Comparation of children’s
performance on four tests of temporal resolution. J Am Acad Audiol. 2005;16(8):554-63.
38. Samelli AG, Schochat E. Estudo da vantagem da orelha direita em teste de detecção de gap. Rev Bras Otorrinolaringol. 2008;74(2):235-40.
39. Ziliotto K, Pereira LD. Random gap detection test in subjects with and without APD. Trabalho apresentado no 17th American Academy of Audiology - Annual Convention and Exposition. Washington, DC - EUA; p. 30. 2005.