(1) Universidade Federal de Pernambuco (UFPE), Recife, PE, Brasil. (2) Departamento de Fonoaudiologia da
Universidade Federal de Pernambuco (UFPE), Recife, PE, Brasil. (3) Departamento de Biofísica da
Universidade Federal de Pernambuco (UFPE), Recife, PE, Brasil.
Conlict of interest: non-existent
Relationship of the thickness and electric activity of the
masseter muscle with bite force: a morphological and
electrophysiological study
Relação da espessura e da atividade elétrica do músculo masseter com a
força de mordida: um estudo morfológico e eletrofisiológico
Jabson Herber Profiro de Oliveira(1) Mário Dourado Genuíno Filho(1) Niedje Siqueira Lima(1) Hilton Justino da Silva(2) Milton Marcelino Filho(3)
Received on: November 10, 2015 Accepted on: February 03, 2016
Mailing address:
Jabson Herber Proiro de Oliveira Departamento de Fonoaudiologia da UFPE, Av. Prof. Moraes Rego, 1235
Cidade Universitária Recife – PE CEP: 50670-901
E-mail: [email protected]
ABSTRACT
Purpose: to study the relationship of thickness and electrical activity of the masseter muscle with the bite force.
Methods: the study included 17 young adults (21.3 ± 1.4 years), 7 female and 10 male, healthy and
clinically asymptomatic, as temporomandibular disorders. It was performed to measure the thickness of the masseter muscle unilaterally during rest and maximal voluntary contraction. It was also quantiied the bite force for each side with a force transducer positioned in the irst molar region and simultaneously, it was assessed the electrical activity of the masseter muscle during the unilateral bite. The analysis was based on the comparison of samples, and used the t test, Wilcoxon, Mann-Whitney and multivariate linear
regression.
Results: the thickness of the masseter muscle was greater in men than in women, both at rest and in
contraction. We found symmetry between the sides with the muscles at rest and during contraction. The median frequency of the electromyographic signal to the masseter muscle in maximal voluntary con-traction, showed no statistically signiicant difference intra-individuals and the comparison between the genres. We found a higher bite force in males. It was not found a multivariate linear regression model between variables.
Conclusion: in this study, it was not possible ind a linear model with the variables studied. Keywords: Masseter Muscle; Bite Force; Ultrasonography; Electromyography
RESUMO
Objetivo: estudar a relação da espessura e da atividade elétrica do músculo masseter com a força de mordida.
Métodos: participaram do estudo 17 adultos jovens (21,3 ± 1,4 anos), sendo 7 do gênero feminino e
10 do gênero masculino, saudáveis e clinicamente assintomáticos, quanto a disfunções
temporomandi-bulares. Foi efetuada a medida da espessura do músculo masseter unilateralmente, durante o repouso e
contração voluntária máxima. Também foi quantiicada a força de mordida para cada lado com um trans-dutor de força posicionado na região do primeiro molar e simultaneamente avaliou-se atividade elétrica
do masseter durante a mordida unilateral. A análise foi baseada na comparação das amostras, sendo
utilizados o test t, Wilcoxon, Mann-Whitney e regressão linear multivariada.
Resultados: a espessura do músculo masseter foi maior nos homens, tanto no repouso quanto em
contração. Observou-se uma simetria entre os lados com os músculos em repouso e em contração. A frequência mediana do sinal eletromiográico, para o músculo masseter em contração voluntária máxima, não apresentou diferença estatisticamente signiicante intra-indivíduos e na comparação entre os gêneros. Foi encontrada maior força de mordida nos indivíduos do gênero masculino. Não foi encontrado
um modelo de regressão linear multivariada entre as variáveis estudadas.
INTRODUCTION
The masseter muscle is an important component of the stomatognathic system, being one of the major muscles related to the bite1,2. Due to its morphological constitution and important participation in mandibular kinetics, it can be considered one of the basis of the stomatognathic system3. Furthermore, researchers suggest that the masticatory muscles inluence cranio -facial skeleton, and might contribute to the deinition of its morphology4.
The ultrasonography (USG) is a precise method that allows the quantiication of the masseter muscle thickness in vivo5, a parameter that has been associated with the craniofacial morphology6-9, with the electrical activity,6,10,11 and with the differences between male and female individuals7-9,12. The morphological differences of the masseter muscle have also been studied during relaxation and contraction, analyzing different parts of the muscle 10,13.
Other researches have studied the relationship between bite force and the masseter muscle thickness14. Also, the relationship between bite force and electrical activity10. Bite force has been studied in healthy individuals with normal occlusion10,15, which shows the researchers interest in bite force studies in order to functional assessment and monitoring of the stomatognathic system.
In 1992 Bakke et al.16 investigated the relationship of bite force and electrical activity of the masseter muscle with muscle thickness measured by ultrasound, besides the inluence of occlusal factors and cranio -facial characteristics, considering the masseter muscle thickness in three parts. Whereas Kim et al.17 in 1999 associated the electrical activity of the masseter and temporal muscles with bite force and haemoglobin concentration in the blood.
The supericial electromyography (EMGs) is a non-invasive electrodiagnostic method by which is possible to quantify the myoelectric activity18, through electromyographic parameters are obtained electro-physiological information from the muscle. The study of the frequency spectrum, more speciically the median frequency (Fmed) and the mean frequency (Fm) makes possible to identify the muscular fatigue19-22.
The Fmed is a parameter obtained from the electromyography signal that has been widely used in muscular fatigue studies. Researchers have observed that median frequency indicate the recruitment of speciic types of muscular ibers, determining the predominance of slow or fast twitch muscle ibers21.
Other researchers carried out histomorphologic studies describing the ibers of the masseter muscle, corre -lating them with their electrophysiology21,23.
The masseter is one of the main muscles respon-sible for mandibular movements and for bite force; which justiies the need of carrying studies out about this muscle. The thickness measurement by USG, and the quantiication of myoelectrical activity by EMG are useful tools in non-invasive morphological and electrophysiological assessments. Associated with these methods, the bite force measurement can reveal important information about the development of thera-peutic protocols.
It is possible that these variables reveal a linear relationship. Obtaining further clariication on the subject can contribute with new information about the muscular morphofunctionality and electrophysiology associated to the stomatognathic system, obtained by non-invasive methods. Thus, the purpose of this study is to investigate a possible existence of a linear relationship between masseter muscle thickness and its electrical activity with the bite force.
METHODS
This study has obtained Ethical approval to conduct the research of Research Ethics Committees (REC) of the Federal University of Pernambuco (UFPE), Center of Health Sciences (CCS), approval letter nº 776/2011, and approval registration REC nº 356/10.
Participated in the study 17 young adults volunteers (21.3 ± 1.4 years), 7 females and 10 males. All of the volunteers were clinically asymptomatic to temporo-mandibular dysfunctions (TMD) and had full dentition, disregarding the absence of the third molar. All volunteers were students of CCS at UFPE. This study draft was classiied as descriptive, transversal and observational.
The assessment of the masseter muscle through ultrasound was carried out Hospital of Clinics at UFPE. The electromyographic evaluation and the bite force measurement were conducted in the Laboratory of Orofacial Motricity of the Department of Speech Therapy at UFPE.
Methodology of ultrasound assessment of the
masseter muscle thickness
It was used a General Electric® ultrasound device model Logic 400, with a high frequency linear trans-ducer of 10MHz, being taken three measurements of the masseter muscle in resting state, of the right and left sides. And then, three measurements in the maximal voluntary contraction (MVC) state for each side.
It was applied ultrasound conductive gel in order to eliminate the air space that forms between the trans-ducer and the skin. This way, transmitting the ultrasonic waves directly to the tissue, avoiding waves relection, which may occur due to the different acoustic imped-ances of means. Using the gel also facilitates sliding the transducer. To position inding and deinition of the reference points during muscle thickness measurement, the transducer was handled perpen-dicularly through the supericial beam of the masseter muscle, while the volunteer performed teeth clenching, intended to gain a better visualization of the muscle limit. After image acquisition, it was performed to deine the thickest muscle points. The image with high deinition and that showed high reproducibility were considered to obtain the muscle thickness.
The medium region of the muscle, equivalent to the muscle belly, is perceived as the area with the most reproducibility5. The USG equipment allowed deining two points for muscular thickness measurement and expressing the value of the measurement in millimeters.
The same evaluator took all measurements. It was avoided the excessive pressure of the transducer over the muscular surface, in order to avoid possible inter-ferences in the real value of muscle thickness. During the ultrasound, electromyographic and bite foce evalu-ations the volunteers remained seated.
The ultrasound measurement was performed in MVC three times on right and left sides. There was a two minutes resting period between contractions in order to avoid muscular fatigue.
Simultaneous measurement of the masseter
muscle electrical activity and bite force
The procedures were initiated with the preparation of the volunteers for placement of the electrodes respon-sible for signal capture. The preparation consisted in skin cleansing on masseter muscle area, using cotton slightly dampened in alcohol 70%. The male volunteers were previously instructed to shave before coming to the evaluation. Both procedures aimed to decrease the electrode contact impedance.
The electrodes placement on the muscular surface obeyed longitudinal orientation of the external beam of the masseter muscle, detected during the contraction state, by palpating the muscle. We used the disposable surface Ag/AgCl for ECG electrodes, Kendall®, Meditrace (Mansield, Massachusetts, USA). The inter-electrode distance was standardized as 2 cm (center to center). A reference electrode was also used and positioned on olecranon of the ulna.
The electromyographic signal was captured using the acquisition module Miotool 400, 4 channels (Miotec®, Porto Alegre, Rio Grande do Sul, Brazil), with the acquisition software. During signal acquisition, a battery maintained the electromyograph running independently of the power line.
Miograph 2.0 software (Miotec®) was used in the acquisition with gain of 1000; 1000 points/second sampling rate; low-pass ilter at 20Hz and high-pass ilter at 500Hz; and during the analysis, a Notch ilter was used at 59Hz-61Hz frequency to eliminate the possibility of interference from power line noise. The electrodes were connected to a preampliier SDS 500 (Miotec®) that was connected to a signal acquisition module Miotool 400. The equipment was connected to a portable computer Acer® Aspire model 110-1564 with processor Intel® Atom, 1.6GHz clock frequency, 1GB RAM memory and 100GB hard drive.
PARAMETER VALUE
Output voltage (OV) 2mV/V nominal
Non-linearity 0.25% of OV
Non-repeatability 0.1% of OV
Maximum overload 150% of OV
Delexion in inches 0.002 of OV
Working range of temperature ~15ºC to 71ºC of OV
Resistance between stations 350Ω Nominal
Figure 1. Technical speciication of the bite force transducer.
Before bite force recording, the transducer was wrapped with plastic ilm made out of PVC (Dispailm® from Brazil, Guarulhos, SP, Brazil). Then, It was wrapped with gauze (Megatex®, Recife, PE, Brazil), and taped with adhesive tape Micropore® 12,5 mm x 10 mm (3M®,Sumaré, SP, Brazil). The use of gauze aimed to help reducing the discomfort generated by the trans-ducer during bite; this way, preventing dental injuries and facilitating transducer positioning between the teeth.
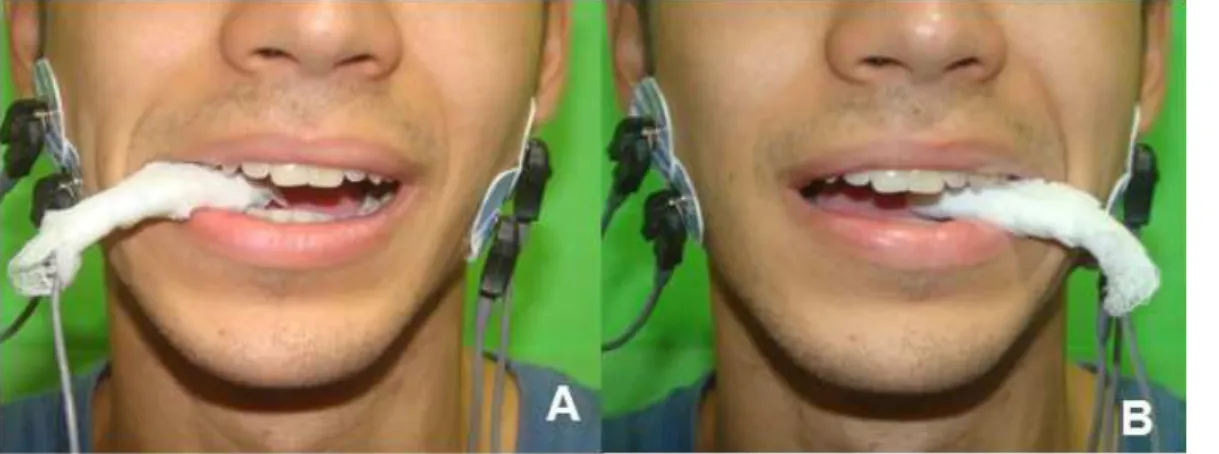
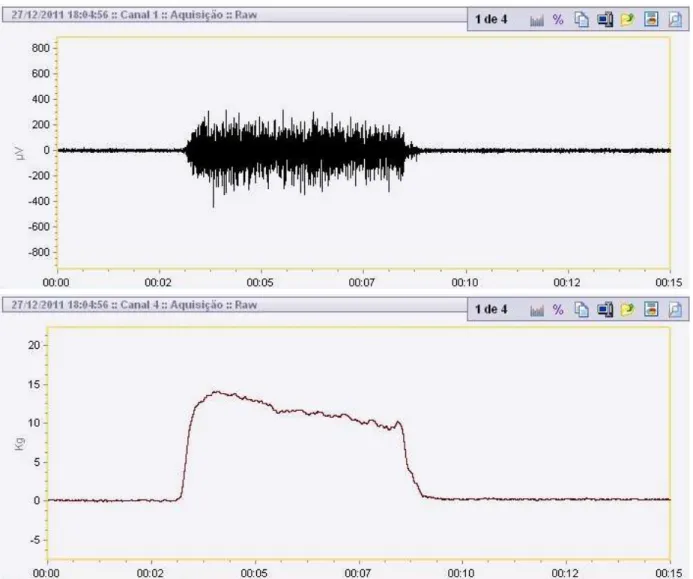
The load cell was positioned in the irst molar region, and then the bite force was measured unilat-erally. Simultaneously to that, the masseter muscle electrical activity was measured (Figure 2A, 2B). The measurements were taken three times in each side with two minutes intervals between bites to avoid muscular fatigue.
During evaluation, volunteers were in front of the computer monitor to have visual feedback of the bite force level and they were instructed by the evaluator to maintain contraction in the maximum value possible and steady (Figure 3).
Figure 2. Positioning of the bite force transducer and the surface electrodes for detection of the electromyographic signal. Transducer in
samples), according to normal distribution criterion to choose the application of these tests. The multiple linear regression was applied to the inluence study of the independent variables over the dependent one (bite force).
In the linear regression, it is important to note that to promote increasing observations number, the data for both sides were added. Thus, obtaining a number of 34 observations, correspondent to 17 individuals.
RESULTS
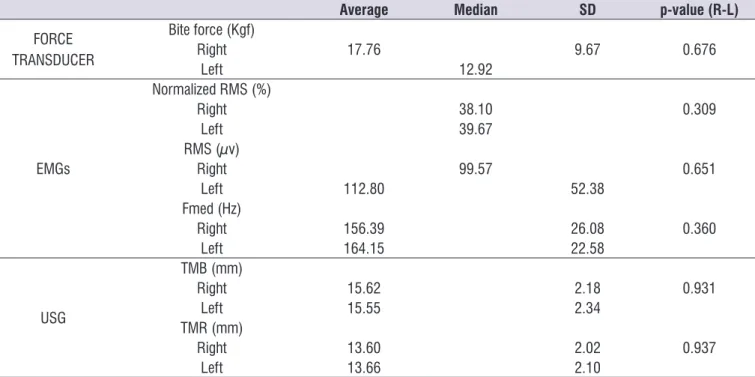
In Table 1 the results are showed not considering the gender, for bite force, RMS value (µV), normalized RMS value (%). and median frequency of the EMGs signal of the masseter muscle. It is also showed the thickness of the masseter muscle during resting and contraction. It was not observed any statistically signiicant difference for any of these variables.
Local de inserção da tabela 1
Analysis of the surface electromyography signal
After acquisition, the electromyographic signal was analyzed through normalized RMS (Root Mean Square) value. Normalization performed by the average of the ten highest peaks during each MVC. The median frequency was determined by the FFT (Fast Fourier Transform) of the three MVC values calculate the arith-metic average from the three tasks.
Statistical analysis of the data
The data was analyzed using RStudio software, Inc. v.0.99.441 (GNU General Public License) in a descriptive way, by eiher the mean and standard deviation or by the median. It was veriied the homoge -neity of variances for each variable and the normality of the data was veriied using Shapiro-Wilk test. To investigate differences among results the following tests were used: student’s t-test (for independent and paired samples), Mann-Witney and Wilcoxon (for paired
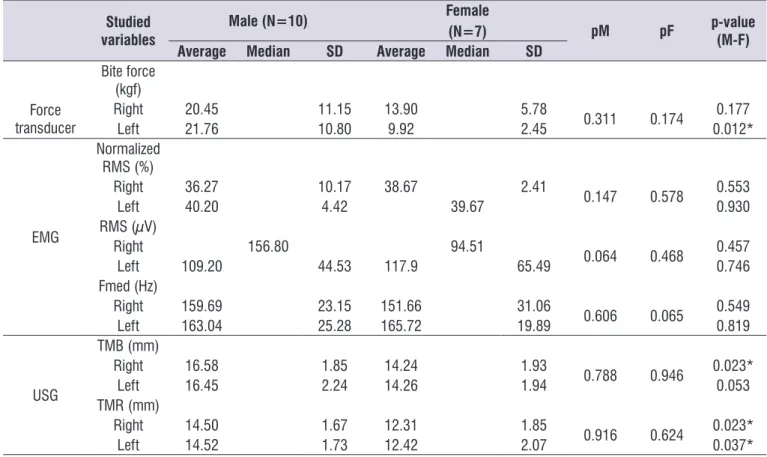
Table 2 lists the results distributed by gender. Its analysis shows that the comparison of the studied variables, among the male individuals, did not show any statistically signiicant difference between sides. The same results were obtained from the comparison between the females’ sides.
Still in table 2, it is possible to see that, among individuals from the masculine and feminine genders there was statistically signiicant difference in the bite force comparison, to the left side. Amongst male and female individuals there was statistically signiicant difference in the right side of the masseter muscle thickness during contraction. In the left side, the difference was also present; however, it was not statisti-cally signiicant (p-value = 0.053).
During the resting period, the comparison of the masseter muscle thickness presented statisti-cally signiicant difference amongst male and female individuals for both sides.
The masseter muscle thickness presented statisti-cally signiicant difference at resting and contraction conditions for both genders, as can be seen on Table 3.
Model of multivariate linear regression
For the investigated sample, it didn’t ind a linear regression model with at least two of the studied variables, even with logarithmic transformation; the methods did not allowed the acquisition of an R² value with statistical relevance (R² ≥ 0.30).
Table 1. Descriptive statistics of the values and comparison of the sample in relation to the masseter evaluation (N=17).
Average Median SD p-value (R-L)
FORCE TRANSDUCER
Bite force (Kgf)
Right 17.76 9.67 0.676
Left 12.92
EMGs
Normalized RMS (%)
Right 38.10 0.309
Left 39.67
RMS (µv)
Right 99.57 0.651
Left 112.80 52.38
Fmed (Hz)
Right 156.39 26.08 0.360
Left 164.15 22.58
USG
TMB (mm)
Right 15.62 2.18 0.931
Left 15.55 2.34
TMR (mm)
Right 13.60 2.02 0.937
Left 13.66 2.10
Caption: DS(Standard Deviation); Fmed (Median Frequency); TMB (Thickness of the Masseter during Bite); TMR (Thickness of the Masseter during Rest) and USG (Ultrasonography). P-value (R-L), comparison of the right and left sides. Average and p-value for comparison with the non-matched t-test and median for the Mann-Whitney test, both tests referring to the comparison between sides.
Table 2. Descriptive statistics and comparison of sample values in relation to the instruments of evaluation of the masseter, considering
genre.
Studied variables
Male (N=10) Female
(N=7) pM pF p-value
(M-F)
Average Median SD Average Median SD
Bite force (kgf) Force
transducer
Right 20.45 11.15 13.90 5.78 0.311 0.174 0.177
Left 21.76 10.80 9.92 2.45 0.012*
EMG
Normalized RMS (%)
Right 36.27 10.17 38.67 2.41 0.147 0.578 0.553
Left 40.20 4.42 39.67 0.930
RMS (µV)
Right 156.80 94.51 0.064 0.468 0.457
Left 109.20 44.53 117.9 65.49 0.746
Fmed (Hz)
Right 159.69 23.15 151.66 31.06 0.606 0.065 0.549
Left 163.04 25.28 165.72 19.89 0.819
USG
TMB (mm)
Right 16.58 1.85 14.24 1.93 0.788 0.946 0.023*
Left 16.45 2.24 14.26 1.94 0.053
TMR (mm)
Right 14.50 1.67 12.31 1.85
0.916 0.624 0.023*
Left 14.52 1.73 12.42 2.07 0.037*
Caption: DS(Standard Deviation); TMB (Thickness of the Masseter during Bite); TMR (Thickness of the Masseter during Rest); pM: (Comparison between sides for male
individuals) and pF (comparison between sides for female individuals). The p-value (M-F) is the comparison of the masseter muscle samples of the individuals between sides (i.e, right male - right female).
Note: Among individuals of the same genre, for the comparison of sides, it was applied the paired t-test (or Wilcoxon), obeying the criteria of normal distribution of the data in the application of the test. For the comparison between the masseter muscle of the female and male (i.e, the right side with the left side), it was applied the independent t-test (or Mann-Witney), considering the criteria of normal distribution of the data.
*Statistical signiicance (p<0.05).
Table 3. Comparison of the thickness of the masseter muscle values in relation with the situations of contraction and rest, considering
the gender.
MALE (n=20)
FEMALE (n=14)
Average SD ¥p-value Average SD Median #p-value
Contraction 16.52
<0,000* Contraction 14.25 1.8 0.000*
Rest 14.52 Rest 13.21
Caption: Average for the Student’s t-test¥ (for paired samples) and median for the Wilcoxon# test, for paired samples, obeying the criteria of usage of these tests; *Statistical signiicance (p<0.05); SD (Standard Deviation).
DISCUSSION
Contrary to what we hypothesized, we could not ind a signiicant association among bite force, electrical activity, and masseter muscle thickness measurements in young adults. The existence of a regression model would allow a better comprehension about the role of each variable in the estimation of the bite force.
The results from the comparisons among averages are in with other studies, regarding the thickness of the masseter muscle, being higher in men than in women 7-9,12. The literature also mentions that in male individuals the masseter muscle presents higher thickness, higher volume, greater area of the transversal section, and larger width than female individuals12, in both contraction and resting8,9. The fact that male individuals bite stronger may be related to a bigger transversal section of type II ibers 24.
Measurement results of the masseter muscle thickness found in this study are compatible with ultrasound measurements obtained by the area of the transversal section parameter, which it was also larger in male individuals (4.3 ± 1.5 cm²) in comparison with female individuals (3.0 ± 1.2 cm²). Furthermore, male individuals presented higher symmetry of the trans-verse section area25.
In addition to the thickness being measured through USG, other studies have also veriied masseter muscle morphometry by computerized tomography (CT)26 and nuclear magnetic resonance (NMR)27,28. It has been discussed that ultrasonography produces similar results to those obtained by NMR5. In this article, masseter muscle thickness values were higher for men, according to previous studies29. The same results were found for the transversal sectional area30, obtained through USG, when compared to female individuals.
It is already known that masseter muscle activ-ities could also deine its morphology, such as the
Table 4. Displays the tested variables in the modeling of the multivatiate linear regression (n-34).
TESTED VARIABLES
Bite force* Median Frequency
RMS Value Normilized EMG signal
Thickness of the masseter muscle in contraction Thickness of the masseter muscle during resting *Dependent variable.
Caption/RMS = Root Mean Square EMG = Electromyography
craniofacial morphology4. Based on the electrical activity study of the masseter muscle and the measurement of its thickness, some researchers have sustained for the idea that individuals with long craniofacial morphology have different masseter muscle morphology, compared to those with short face6.
A hypothesis that differences on the diet, such as eastern and western diets, could determine masseter muscle morphology, could be thought. However, this hypothesis seem be unsupported, as shown in the comparison between one study carried out in Sweden and other in China. In the Swedish study, the male individuals showed thickness of 9.7 mm and 15.1 mm, during resting and contraction respectively; whereas the female individuals showed thickness of 8.7 mm and 13.0 mm, during resting and contraction respectively9. In the Chinese study, the male individuals showed 11.83 mm and 15.51 mm, during resting and contraction respectively; whereas the female individuals, showed 9.84 mm and 13.02 mm, during resting and contraction respectively 8.
The current study results of masseter muscle thickness (Table 2), show small difference when compared to the studies mentioned previously mentioned. However, we need to take in consideration that Brazilian diet is different from the participants’ diets in those studies. Once food consistency seems to have an inluence on the craniofacial development and more speciically in the mandibular condyle31.
In this article, the masseter muscle thickness of the same gender individuals (Table 3) differs statistically signiicant (p<0.05) when contracting and resting, as described in the literature29.
conditions and possible neuromuscular disorders associated with the temporomandibular disorders (TMD).
The median frequency, obtained in this study, didn’t intend to determine muscular fatigue, because the tasks were of a short duration, including a resting interval. The aim was to study the electromyographic parameters, relating them with bite force and muscular thickness.
Regarding EMG signal amplitude, it’s already described that increasing effort intensity generates an increase in the RMS value. However, it entails a decrease in the median and mean frequency value over time32. This variation has been used in muscular fatigue studies and in iber recruited type studies during speciic tasks. In the distribution of the spectral frequency, the median frequency of the EMG signal tends to move toward smaller frequencies values21,33 as muscle initiate fatigue Researchers believe that there must be a link between the median frequency decreasing and the decrease in conduction speed of action potentials composing the EMG signal21. It is possible that the muscle spectrum frequency varies depending on the existence of a resting interval or on the bite duration. Moreover, it is also possible that the muscle area, where the signal is generated and captured, affects the value of the median frequency of EMG signal; in other words, the ibers of the supericial beam or the deep beam might interfere with the value of the median Fmed. It’s also known that under sustained contractions the masseter muscle shows smaller values of median frequency than the temporal muscle21,33.
According to the literature the bite force has being measured unilaterally24,34, and bilaterally34,35. Some researchers found that the bite force and the electrical activity of the masseter muscle and the temporal muscle were smaller when measured unilaterally than when measured bilaterally34. Throughout the method-ology development of this study, it was observed that there was high dificulty to perform the bite force bilat -erally evaluation. Therefore, we choose to measure unilaterally. Also, we choose to perform MVC in short duration in order to prevent muscular fatigue in the volunteer.
A study analyzed the bite force, body mass, and physical conditioning of male soldiers indicating higher values for bite force after training in the army for three months. The results suggested that increasing physical activity may have inluenced the high bite force values after the training36.
During ordinary activities, the male individuals generally do physical activities that demand more effort in comparison to female individuals. It is possible that in the daily routine physical activity is a determining factor for male to present a higher bite force when compared to female.
Other fact that might be relevant, men gain muscle mass more easily than women do. Researchers consider that this fact might be associated with hormonal aspects, because men have high testos-terone level37. In addition, the intensity of the bites during mastication, and also the amplitude of the movement, might be another determining factor for greater bite force in males. The combination of these factors mentioned can suggest an inluence in the values variability of the studied parameters, making it dificult to create a statistical model of linear regression.
Further studies are necessary to verify whether improvements in the performance of the bite force are related to increases in thickness and electrical activity of the masseter muscle. Additionally, whether physical activities inluences in the thickness, bite force, and electrical activity of the masseter muscle.
Japanese researchers veriied that the bite force seems to have different levels in children with primary dentition at different ages. The children of the feminine gender between 3 to 5 years of age seemed to have greater bite force than those of the masculine gender. Children of the masculine gender between 6 and 11 years of age, young teenagers at 12 to 14 years of age, and also teenagers between 15 to 17 years of age, seem to have greater bite force than females at the same age38. This can suggest a relationship between higher testosterone levels in males individuals starting in the teenagers years.
Furthermore, it has been suggested males have a higher oxygenation rate and hemoglobin levels than females; in other words, there is a difference in hemoglobin oxygenation rate between genders39. This fact can partially justify why males have a higher generation of bite force, greater thickness in MVC and a higher electrical activity of the masseter muscle
In this study and in previous researches by different authors, it was note found a linear regression model associating bite force and craniofacial morphological measurements in men and women24.
occlusal factors. It was found linear models with coefi -cient of determination from moderate up to strong level, one of these models included bite force and the masseter muscle thickness during resting (R²=0.55)3. Other study found a model with the thickness of the masseter muscle in contraction (dependent variable) and craniofacial variables (independent variable), with correlation coeficient of moderate to strong level (R=0.78) and another model with the thickness of the masseter muscle during resting (dependent variable) and craniofacial variables at the same level (R=0.78)7. Comparisons between this study and those cited studies become more complex because of the same nature variables were not taken in consideration by the other studies. However, the lack of a model obtained through multivariate linear regression suggests that the independent variables outlined in Table 4 have little power of prediction regarding the value for bite force.
A linear regression model was not found for the studied sample. But, a scientiic contribution of this study was the use of the multivariate linear regression. The study of new regression models using others EMG parameters can aid inding a linear relationship between variables.
Considering the central limit theorem, a bigger sample would ind a better-deined pattern for the studied parameters, because of the variance homoge-neity between data.
A statistical relationship would be found by gender analysis, combining a bigger sample size, controlling variables facial type and occlusion type, and applying multivariate analysis between the parameters involved in the study. More studies are needed to investigate the relationship between bite forces, spectral character-istics of the electromyographic signal (Fmed and Fm), and ultrasound parameters of the masseter muscle (volume, transversal section area, thickness, width, and length).
Furthermore, a more detailed spectral analysis of the electromyography signal is needed, such as a speciic study about activation of the supericial and deep beams. In order to decrease variance among the results of the studied parameters, in the future instead of using a MVC we suggest that use a established bite force and equal values for all volunteers
Individuals can perform different levels of muscular contraction. Because of that, predetermined standard measurements of contraction could be set to minimize possible methodological dificulties related to the contraction intensity in new studies. These standards
could be set by using dynamometer or bite force trans-ducer, and the volunteer would monitor it as feedback.
Thus, ensuring a uniform contraction level to all volun-teers. Because the force transducer position on tooth is a factor that can interfere capturing bite force, studies about this factor are necessary.
Likely, by regression modeling, bite force inluence would turns to be smaller than the inluence of the EMG signal amplitude. This is due to the fact that biting the transducer is uncomfortable, causing a difference in the volunteers’ performance. Besides that, the EMG recording appears to be more precise and speciic. For these reasons, we suggest that future studies establish gradual levels of bite force.
The bite force is a dificult parameter to be measured because it is related to the occlusion and dental conditions. However, dificulties were not faced while measuring electromyographic parameters, related to muscular contraction, and ultrasound param-eters, related to muscular morphology. The bite force measurement is limited to toothed groups of individuals and depends on the methodological positioning. Also, this measurement is dependent to preparation of the transducer between the superior and inferior teeth and the interdental forces. There’s a possibility that varia-tions on transducer position between teeth register different intensities values.
CONCLUSION
We hypothesize that it was possible to obtain bite force values from the masseter muscle thickness and electromyographic parameters as predictive variables. However, throughout this study we showed that this could not be obtained. In conclusion, new studies are required for further development.
REFERENCES
1. Yamaguchi S, Itoh S, Watanabe Y, Tsuboi A, Watanabe M. Quantitative analysis of masticatory activity during unilateral mastication using muscle fMRI. Oral Dis. 2011;17(4):407-13.
2. Ishikawa M, Sato H, Ukon S, Matsuguma T, Zeze R. Quantiication of masseter muscle deformation during palpation using MRI and image-analysis procedure. Int J Prosthodont. 2001;14(4):367-73. 3. Kimoto K, Tamaki K, Yoshino T, Toyoda M, Celar
4. Kitai N, Fujii Y, Murakami S, Furukawa S, Kreiborg S, Takada K. Human masticatory muscle volume and zygomatico-mandibular form in adults with mandibular prognathism. J Dent Res. 2002;81(11):752-6.
5. Raadsheer MC, Van Eijden TM, Van Spronsen PH, Van Ginkel FC, Kiliaridis S, Prahl-Andersen B. A comparison of human masseter muscle thickness measured by ultrasonography and magnetic resonance imaging. Arch. Oral Biol. 1994;39(12):1079-84.
6. Li HT, Cui CJ, Lu SL, He KY. Study on the association of ultrasonographic thickness and electromyographic activity of masseter muscle in young females with different vertical craniofacial morphology. Shanghai Kou Qiang Yi Xue. 2008;17(5):529-34.
7. Raadsheer MC, Kiliaridis S, Van Eijden TM, Van Ginkel FC, Prahl-Andersen B. Masseter muscle thickness in growing individuals and its relation to facial morphology. Arch. Oral Biol. 1996;41(4):323-32.
8. Zhao JZ, Dai Q, Lai QS. [Masseter thickness measured by ultrasonography of 50 young healthy adults in relation to facial morphology]. Zhongguo Yi Xue Ke Xue Yuan Xue Bao. 2001;23(1):60-2. 9. Kiliaridis S, Kalebo P. Masseter muscle thickness
measured by ultrasonography and its relation to facial morphology. J Dent Res. 1991;70(9):1262-5. 10. Bakke M, Tuxen A, Vilmann P, Jensen BR, Vilmann
A, Toft M. Ultrasound image of human masseter muscle related to bite force, electromyography, facial morphology, and occlusal factors. Scand J Dent Res. 1992;100(3):164-71.
11. Georgiakaki I, Tortopidis D, Gareis P, Kiliaridis S. Ultrasonographic thickness and electromyographic activity of masseter muscle of human females. J Oral Rehabil. 2007;34(2):121-8.
12. Benington P, Gardener J, Hunt N. Masseter muscle volume measured using ultrasonography and its relationship with facial morphology. Eur J Orthod. 1999;21(6):659-70.
13. Bertram S, Brandlmaier I, Rudisch A, Bodner G, Emshoff R. Cross-sectional characteristics of the masseter muscle: an ultrasonographic study. Int J Oral Maxillofac Surg. 2003;32(1):64-8.
14. Palinkas M, Nassar MS, Cecilio FA, Siessere S, Semprini M, Machado-de-Sousa JP, et al. Age and gender inluence on maximal bite force and
masticatory muscles thickness. Arch. Oral Biol. 2010;55(10):797-802.
15. Hagberg C, Agerberg G, Hagberg M. Regression analysis of electromyographic activity of masticatory muscles versus bite force. Scand J Dent Res. 1985;93(5):396-402.
16. Bakke M, Tuxetv A, Vilmann P, Jensen BR, Vilmann A, Toft M. Ultrasound image of human masseter muscle related to bite force, electromyography, facial morphology, and occlusal factors. Eur J Oral Sci. 1992;100(3):164-71.
17. Kim YJ, Kuboki T, Tsukiyama Y, Koyano K, Clark GT. Haemodynamic changes in human masseter and temporalis muscles induced by different levels of isometric contraction. Arch. Oral Biol. 1999;44(8):641-50.
18. Farina D, Fosci M, Merletti R. Motor unit recruitment strategies investigated by surface EMG variables. J Appl Physiol. 2002;92(1):235-47.
19. Bazzotti L. Electromyography tension and frequency spectrum analysis of some masticatory muscles at rest, isotonic and isometric contractions. Electromyogr Clin Neurophysiol. 1999;39(7):421-34.
20. Bilodeau M, Cincera M, Gervais S, Arsenault AB, Gravel D, Lepage Y, et al. Changes in the electromyographic spectrum power distribution caused by a progressive increase in the force level. Eur J Appl Physiol Occup Physiol. 1995;71(2-3):113-23.
21. Palla S, Ash MM, Jr. Effect of bite force on the power spectrum of the surface electromyogram of human jaw muscles. Arch Oral Biol. 1981;26(4):287-95. 22. Takarada T, Larrinaga GA, Nishida F, Nishino M.
Frequency analyses of EMG power spectra of anterior temporal and masseter muscles in children and adults. Dent Jpn. 1990;27(1):119-25.
23. Bakke M, Stoltze K, Tuxen A. Variables related to masseter muscle function: a maximum R2 improvement analysis. Scand J Dent Res. 1993;101(3):159-65.
24. Tuxen A, Bakke M, Pinholt EM. Comparative data from young men and women on masseter muscle ibres, function and facial morphology. Arch Oral Biol. 1999;44(6):509-18.
25. Close PJ, Stokes MJ, L’Estrange PR, Rowell J. Ultrasonography of masseter muscle size in normal young adults. J Oral Rehabil. 1995;22(2):129-34. 26. Chan HJ, Woods M, Stella D. Mandibular muscle
patterns: A 3-dimensional computed tomography study. Am J Orthod Dentofacial Orthop. 2008;133(1):10.e1-3.
27. Dicker GJ, Koolstra JH, Castelijns JA, Van Schijndel RA, Tuinzing DB. Positional changes of the masseter and medial pterygoid muscles after surgical mandibular advancement procedures: an MRI study. Int J Oral Maxillofac Surg. 2012;41(8):922-9. 28. Kubo K, Kawata T, Ogawa T, Watanabe M, Sasaki
K. Outer shape changes of human masseter with contraction by ultrasound morphometry. Arch Oral Biol. 2006;51(2):146-53.
29. Oliveira JHPd, Dourado Filho MGD, Melo TMA, Lima NSd, Marcelino Filho M, Silva HJd. Evidências de medidas de normalidade para a espessura do músculo masseter avaliadas com ultrassonograia: estudo de revisão. Rev. CEFAC. 2015;17:238-52. 30. Close PJ, Stokes MJ, L’Estrange PR, Rowell J.
Ultrasonography of masseter muscle size in normal young adults. J Oral Rehabil. 1995;22(2):129-34. 31. Dias GJ, Cook RB, Mirhosseini M. Inluence of food
consistency on growth and morphology of the mandibular condyle. Clin Anat. 2011;24(5):590-8. 32. Nadeau S, Bilodeau M, Delisle A, Chmielewski
W, Arsenault AB, Gravel D. The inluence of the type of contraction on the masseter muscle EMG power spectrum. J Electromyogr Kinesiol. 1993;3(4):205-13.
33. Chung JW, Kim C, McCall WD, Jr. Effect of sustained contraction on motor unit action potentials and EMG power spectrum of human masticatory muscles. J Dent Res. 2002;81(9):646-9. 34. van der Bilt A, Tekamp A, van der Glas H, Abbink
J. Bite force and electromyograpy during maximum unilateral and bilateral clenching. Eur J Oral Sci. 2008;116(3):217-22.
35. Mountain G, Wood D, Toumba J. Bite force measurement in children with primary dentition. Int J Paediatr Dent. 2011;21(2):112-8.
36. Jakovac M, Zivko-Babic J, Zdilar M, Kardum-Ivic M. Relationship between the training of young recruits and values of bite forces. Coll Antropol. 2012;36(1):93-7.
37. English AW, Schwartz G. Development of sex differences in the rabbit masseter muscle is not restricted to a critical period. J Appl Physiol. 2002;92(3):1214-22.
38. Mao J, Osborn JW. Direction of a bite force determines the pattern of activity in jaw-closing muscles. J Dent Res. 1994;73(5):1112-20.