DOI: 10.1590/0104-1169.2943.2374
www.eerp.usp.br/rlae
Copyright © 2013 Revista Latino-Americana de Enfermagem This is an Open Access article distributed under the terms of the Creative Commons Attribution Non-Commercial License (CC BY-NC).
This license lets others distribute, remix, tweak, and build upon your work non-commercially, and although their new works must also acknowledge you and be non-commercial, they don’t have to license their derivative works on the same terms.
Corresponding Author: Mª Visitación Sanchón-Macias
Universidad de Cantabria. Escuela Universitaria de Enfermería Av. Valdecilla s/n
CP 39010, Santander, España E-mail: [email protected]
Mª Visitación Sanchón-Macias
1Dolores Prieto-Salceda
2Andreu Bover-Bover
3Denise Gastaldo
41 PhD, Associate Professor, Escuela Universitaria de Enfermería, Universidad de Cantabria, Santander, Spain. 2 PhD, Researcher, Observatorio de Salud Pública de Cantabria, Santander, Spain.
3 PhD, Associate Professor, Departament d’Infermeria i Fisioteràpia, Universitat de les Illes Balears, Palma de Mallorca, Spain. 4 PhD, Associate Professor, Bloomberg Faculty of Nursing, University of Toronto, Toronto, Canada.
Objective: to explore the relationship between socioeconomic status and subjective social status and explain how subjective social status predicts health in immigrant women. Methods: cross-sectional study based on data from 371 Latin American women (16-65 years old) from a total of 7,056 registered immigrants accesse through community parthers between 2009-2010. Socioeconomic status was measured through education, income and occupation; subjective social status was measured using the MacArthur Scale, and perceived health, using a Likert scale. Results: a weak correlation between socioeconomic and subjective social status was found. In the bivariate analysis, a significantly higher prevalence of negative perceived health in women with no education, low income, undocumented employment was observed. In the multivariate analysis, higher odds of prevalence of negative perceptions of health in the lower levels of the MacArthur scale were observed. No significant differences with the rest of the variables were found. Conclusions: the study suggests that subjective social status was a better predictor of health status than the socioeconomic status measurements. Therefore, the use of this measurement may be relevant to the study of health inequalities, particularly in socially disadvantaged groups such as immigrants.
Descriptors: Social Class; Health Inequalities; International Migration; Health Status.
Rev. Latino-Am. Enfermagem 2013 Nov.-Dec.;21(6):1353-9.
Introduction
Health inequalities are a major problem in the world. In all societies there is “a social gradient in health”, observing that people suffer a progressive deterioration of health as their social position decreases(1). Identifying
the mechanisms determining the social gradient in
health allows for the identiication of reasons for health
inequalities(2).
Socioeconomic status, usually measured by the level of income, education and type of occupation, is an important determinant of health and one of the indicators used for the study of health inequalities(1-2).
However, the measurement of socioeconomic status based on objective data may be irrelevant for the study of immigrant groups, as they do
not relect the real situation of these groups(3).
For example, level of education acquired in their countries is not recognized, and they must share their wages with dependent family members in their home countries.
Subjective social status is deined as a person’s
belief regarding his position on the social ladder(4). It
is a measurement that includes both socioeconomic factors and the perception of the subjects about their social position. Recent studies show that subjective
social status is signiicantly associated with health(5-6).
This can affect health, either directly, causing stress, or indirectly through health behaviors(7). A low
subjective social status has been associated with low self-perceived health, and higher mortality, depression, cardiovascular risk, diabetes and respiratory diseases(5).
In Spain, starting in the 1990s, coinciding with economic growth, a sudden and rapid immigration originated(8-9). In Cantabria, the migratory low occurred
mainly in the decade of 2000, rising from 1.3% in 2000 to 6.6% in 2010. Latin nationalities predominate (46.5%), and within this group there is a greater presence of women (56.5%) than men (43.4%)(10).
Although Latin American women are the largest group, information about their health is minimal, and no
research on the inluence of social status on perceived
health has been conducted.
The objectives of this study were: a) to examine the association between traditional measurements of socioeconomic status and subjective social status, b) to assess the extent to which socioeconomic status and subjective social status explained differences in perceived health.
Methods
This was a cross-sectional study with an objective to quantify the association between socioeconomic status, subjective social status and perceived health. The sample was calculated from the data of the National Health Survey of Spain and the frequency of women with perceived health as very bad (1.0%) or poor (50.0%). We estimated a minimum size of 361, with maximum error of 10% and reliability of 95%, starting from a population of 7,056, according to the Census(8).
The selection of participants was made using non-probability sampling, due to the inability to access the records of the Census and the interest in including illegal immigrants. Inclusion criteria were: women born in Latin America, 16-65 years of age, living and working in Spain for at least six months. Data was collected through a self-administered questionnaire in small groups.
Although 16% had failed to inish primary education,
they had no trouble answering the questions in the questionnaire. Participants were recruited consecutively through associations and social organizations, between June 2009 and July 2010. They were asked to complete the questionnaire on a voluntary basis, it is not possible to quantify the percentage that was lost, although a large majority followed up with the request. Finally, the “snowball” method was used, which has shown to be a suitable technique for recruiting immigrants, who are less accessible(12).
The inal sample was composed of 371 women,
distributed geographically in a similar way to the records of the Census(8). The study was part of a wider
investigation, using a qualitative methodology which aimed to identify the determinants of subjective social status and the mechanisms through which they affected health.
Variables
Perceived health (dependent variable) was assessed through the question In the past 12 months, would you say your health has been: very good, good, regular, bad or very bad. This question has been used in other studies, showing that it is a good predictor of morbidity and mortality, and a good indicator of health in different ethnic groups(13-14). To
carry out the statistical analysis, the categories “very good” or “good” were combined into a group called
To assess the socioeconomic status, the sociodemographic questionnaire developed by the MacArthur network was used, which has been validated and used in numerous research projects(5).
The questionnaire consisted of questions relating to: the level of education, with six possible answers: “no education or primary education”, “general secondary education”, “technical education or diploma”, “university studies”, “graduate studies” and “others, specify”.
The inal categories were grouped into four. Thus,
undergraduate and graduate studies were merged into one, called university studies. The category “others” was deleted, due to the lack of answers. Income level
included seven possible answers: less than 250 euros; from 250 to 499 euros; between 1,000 and 1,499 euros; 1,500 to 1,999 euros; between 2,000 and 2,999 euros; 2,999 euros per month; and, others, specify. After the replies, the categories were grouped into four, the last three of which were removed, due to lack of answers. Finally, they were asked about their current job or most recent job activity. Occupations
were recorded following the method of the National
Classiication of Occupations, whose classiication criteria were based on the qualiications and type of
work performed(15). Of all the possibilities included, after
the replies, these were reduced to four: Unemployed,
Level III, Level IV and Level V. In the inal analysis, they were pooled into qualiied (III and IV) and unqualiied (level V).
The subjective social status was measured with the MacArthur Scale(5). The instrument captured
subjective social status, by showing the respondents a picture of a ladder with 10 steps, and asking them to place a cross at the level on which they considered representative of their place in Spanish society. For analysis, the categories were grouped in pairs: “very bad” (1-2), “bad” (3-4) “regular” (5-6), “good” (7-8) and “very good “(9-10). The instrument was used in the pilot test with 20 women and did not
require any modiication, it had also been validated
and used with Hispanic populations in different geographic areas(4-16).
Other demographic data included: age, country of origin and residence time in Spain, family and friends in Spain (yes / no); economically dependent family members in Spain and in their country (yes / no) legal status (with / without documents / in the process of getting them) health card (with / without / in the process), and health status in relation to their country (better / same / worse).
Statistical analysis
The characteristics of the study sample were analyzed, summarizing the categorical variables with absolute numbers and percentages, and the quantitative variables using mean and standard deviation. The prevalence of the dependent variable, negative perceived health, was estimated. A Spearman correlation analysis was performed using a non-parametric test, applicable between ordinal variables, between the two measurements of social status, socioeconomic status (based on educational level, income and occupation) and subjective status (based on the McArthur scale). Furthermore, bivariate analysis was performed, comparing the prevalence of negative perceived health with each of independent variables through the chi-square test (or Fisher’s exact test, where appropriate) if the variable was qualitative, and by the Student’s t-test with quantitative variables.
The relevant variables from the reviewed literature,
and/or those with signiicance in the bivariate analysis
of p <0.30, were introduced into the multivariate models. Multivariate analysis was performed by means of logistic regression. The contribution of each variable was estimated as Odds Ratio of Prevalence – ORP, with reliability intervals of 95%, estimated and interpreted as Odds Ratio. Statistical analyses were performed using the Statistical Package for the Social Sciences (SPSS®), version 15.
Results
There were 371 participants in this study. It was not possible to determine exactly how many refused to answer the questionnaire, or to know the reasons for non-participation. However, the number of participants who rejected it was very small. These circumstances may introduce a selection bias.
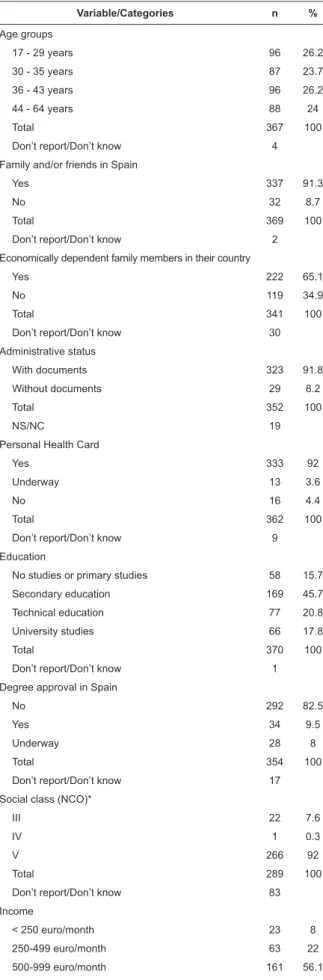
The mean age of the female participants was 36.7 years (SD 10.0), and the mean of years living in Spain was 4.3 years (SD 2.8). Participants were primarily from Colombia (24.9%), Peru (24.3%), Ecuador (15.4%), Bolivia (9.7%) and Paraguay (7.6%). Other demographic variables of interest are listed in Table 1.
Table 2 presents the Spearman correlation
coeficients between subjective social status and three
indicators of socioeconomic status. Subjective social status improved signiicantly as incomes increased (r = 0.193, p = 0.00) but did not show a signiicant
Rev. Latino-Am. Enfermagem 2013 Nov.-Dec.;21(6):1353-9.
Variable/Categories n %
Age groups
17 - 29 years 96 26.2
30 - 35 years 87 23.7
36 - 43 years 96 26.2
44 - 64 years 88 24
Total 367 100
Don’t report/Don’t know 4
Family and/or friends in Spain
Yes 337 91.3
No 32 8.7
Total 369 100
Don’t report/Don’t know 2
Economically dependent family members in their country
Yes 222 65.1
No 119 34.9
Total 341 100
Don’t report/Don’t know 30
Administrative status
With documents 323 91.8
Without documents 29 8.2
Total 352 100
NS/NC 19
Personal Health Card
Yes 333 92
Underway 13 3.6
No 16 4.4
Total 362 100
Don’t report/Don’t know 9
Education
No studies or primary studies 58 15.7
Secondary education 169 45.7
Technical education 77 20.8
University studies 66 17.8
Total 370 100
Don’t report/Don’t know 1
Degree approval in Spain
No 292 82.5
Yes 34 9.5
Underway 28 8
Total 354 100
Don’t report/Don’t know 17
Social class (NCO)*
III 22 7.6
IV 1 0.3
V 266 92
Total 289 100
Don’t report/Don’t know 83
Income
< 250 euro/month 23 8
250-499 euro/month 63 22
500-999 euro/month 161 56.1
1,000-1,499 euro/month 40 13.9
Table 1 - Description of the study population and variables of interest (n=371)
Table 1 - (continuation)
Table 2 - Correlation between socioeconomic status and subjective social status
*According to the National Classiication of Occupations (NCO)(12)
Percentages are calculated without considering the “not stated” category
*Spearman Rho coeficient
Variable/Categories n %
Total 287 100
Don’t report/Don’t know 84
MacArthur Scale of ESS
Very Bad (1 and 2) 40 10.8
Bad (3 and 4) 76 20.5
Regular (5 and 6) 165 44.5
Good (7 and 8) 76 20.5
Very Good (9 and 10) 14 3.8
Total 371 100
Perceived health status
Very good 69 18.8
Good 160 43.6
Regular 118 32.2
Bad 18 4.9
Very Bad 2 0.5
Total 367 100
Don’t report/Don’t know 4
(continue...)
Socioeconomic status Subjective social status
rs* p-value
Income 0.193 0.00
Level of education 0.030 0.56
Occupation 0.087 0.13
Bivariate analysis results showed that negative
health perception increased signiicantly with age
(p=0.041), and those that were at the lowest levels of subjective social status scale assessed their perceived health as negative more often (p=0.005). There was a higher prevalence of negative perceived health in women with no education (p=0.216), those with lower incomes (p=0.272), and the unemployed (p=0.699), although
these differences were not statistically signiicant.
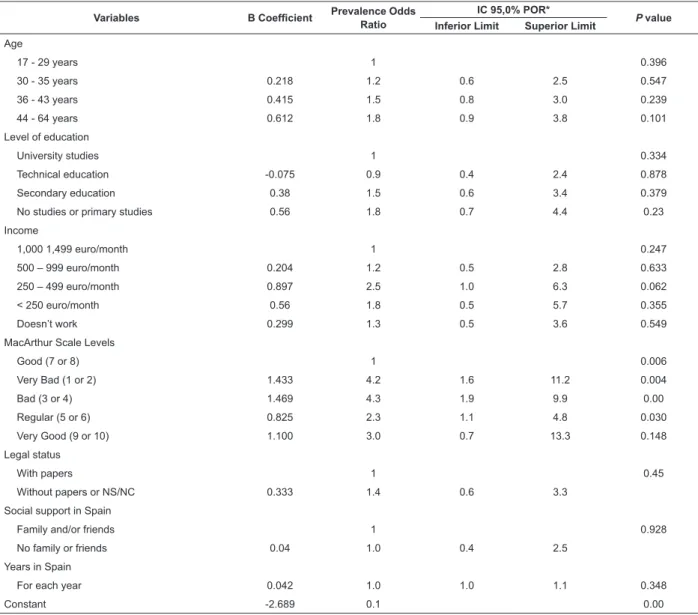
Table 3 presents the results of multivariate analysis
for negative perceived health. The model included the variables: age, education level, income, subjective social status scale, legal status, social support and residence time. There was a trend of increasing prevalence of more negatively perceived health with increasing
age. Signiicantly higher prevalence odds of negative
Table 3 - Logistic regression analysis for negative perceived health (0 = good / very good 1 = fair, poor or very poor)
*Conidence interval prevalence odds ratio
or 2 (95% CI 1.6 to 11.2) or at levels 3 or 4 (95% CI: 1.9 to 9.9 ) and 2.3 times higher in those who were at levels 5 or 6. Regarding the other variables, the negative
perception of health varied, although not signiicantly,
depending on the level of education, income, legal status and social support. Finally, the perception of poor health did not vary according to the years that women had been residing in Spain.
Variables B Coeficient Prevalence Odds
Ratio
IC 95,0% POR*
P value Inferior Limit Superior Limit
Age
17 - 29 years 1 0.396
30 - 35 years 0.218 1.2 0.6 2.5 0.547
36 - 43 years 0.415 1.5 0.8 3.0 0.239
44 - 64 years 0.612 1.8 0.9 3.8 0.101
Level of education
University studies 1 0.334
Technical education -0.075 0.9 0.4 2.4 0.878
Secondary education 0.38 1.5 0.6 3.4 0.379
No studies or primary studies 0.56 1.8 0.7 4.4 0.23
Income
1,000 1,499 euro/month 1 0.247
500 – 999 euro/month 0.204 1.2 0.5 2.8 0.633
250 – 499 euro/month 0.897 2.5 1.0 6.3 0.062
< 250 euro/month 0.56 1.8 0.5 5.7 0.355
Doesn’t work 0.299 1.3 0.5 3.6 0.549
MacArthur Scale Levels
Good (7 or 8) 1 0.006
Very Bad (1 or 2) 1.433 4.2 1.6 11.2 0.004
Bad (3 or 4) 1.469 4.3 1.9 9.9 0.00
Regular (5 or 6) 0.825 2.3 1.1 4.8 0.030
Very Good (9 or 10) 1.100 3.0 0.7 13.3 0.148
Legal status
With papers 1 0.45
Without papers or NS/NC 0.333 1.4 0.6 3.3
Social support in Spain
Family and/or friends 1 0.928
No family or friends 0.04 1.0 0.4 2.5
Years in Spain
For each year 0.042 1.0 1.0 1.1 0.348
Constant -2.689 0.1 0.00
Discussion
Our hypothesis was that subjective social status would explain differences in perceived health better than socioeconomic status in the group of immigrant women.
This hypothesis was conirmed after adjusting for age,
education level, income, legal status, social support and time residing in Spain.
We found a weak association between the measurements of socioeconomic status and perceived health. These results, in part, differed from the literature
in which a signiicant relationship between indicators of
socioeconomic status and perceived health has been demonstrated in other groups(1-6). In addition to an insuficient sample, several reasons may explain the
lack of association between objective measurements of the status and perceived health status in this study. For immigrant women, indicators of socioeconomic status may have different meanings than for the general population. Equal levels of income or education
may not provide them with the same beneits as the
local population. For example, the educational level obtained in their home countries did not provide them
Rev. Latino-Am. Enfermagem 2013 Nov.-Dec.;21(6):1353-9.
accepted within Spain. Their experience or professional
qualiications were also not recognized, so they were
forced to accept jobs that required low skills, and they had to share their wages with other dependent family members, both in Spain and in their countries of origin. These reasons may explain why the pattern found in this group of Latin American women did not coincide with that of the general population, in terms of the relationship between education, occupation and income to perceived health.
Recent studies(17) have shown that the health of immigrants was inluenced by the migration process,
family status, social resources, working conditions, expectations or experiences of discrimination. Other authors found similar results to those in this study(18),
indicating that the indicators of socioeconomic status were irrelevant for studying immigrant groups because they did not capture the actual socio-economic situation of these groups, introducing limitations to the study of health inequalities.
Subjective social status was based on indicators of socioeconomic status. That is, individuals who developed better subjective social status were likely to have higher incomes, higher levels of education and a better occupation. However, in this study, only subjective social
status maintained a signiicant relationship with income, relecting the importance that these women gave to
economic security. An explanation of these results may be that there are other determining factors of social position linked to gender, ethnicity or discrimination,
which inluenced the assessment of their social status
and explained the relative importance of socioeconomic status indicators. Previous studies have found similar results between socioeconomic status and subjective social status(4-19). The authors argued that subjective
social status was based on indicators of socioeconomic status, but that this relationship was weaker in people from ethnic minorities. Although the measurements of socioeconomic status were major determinants of subjective social status, the groups that were socially disadvantaged tended to establish their status using other criteria derived from context.
The only predictor variable of negative perceived health in the population studied was subjective social status, highlighting the importance of this measurement in assessing the perceived health in this population. As in previous research, it was shown that subjective social status assessment provided information about health that could not be captured by socioeconomic status(16-17,19). In this study, as in the studies cited, it
became clear that, regardless of their social or material circumstances, the way in which women considered
their social position was a signiicant predictor of their
perceived health status.
The explanation as to why the subjective social
status signiicantly affected perceived health can be
explained when one notes that it captured information about the social position of women, as well as impressions about their socio-economic and labor circumstances that were not achieved with the traditional indicators of socioeconomic status(4). For example, poor working conditions, problems of discrimination, unfulilled
expectations, few social opportunities, irregular legal status or other social or cultural barriers when compared to the indigenous group. The perception of a low position on the social ladder could generate high levels of stress and the development of unhealthy behaviors that affected their health(7). On the contrary, high levels of subjective
social status may have provided psychological resources to people, such as higher self-esteem, security, hope and feelings of control, which were important resources for health(4).
With the data obtained, it is not possible to explain what mechanisms mediated the association between subjective social status and perceived health. This article is part of a larger investigation in which we explored the determinants of subjective social status and mediating mechanisms between subjective social status and health, using a qualitative methodology.
Limitations
Since the sample was captured through social centers, where the women came with socioeconomic problems, our results may overestimate the number of women with these problems and the true prevalence of perceived health. There may also be a bias because of those refusing to participate, as well as for those who did not answer the questions. Furthermore, because the data was collected transversely, and due to temporary ambiguity bias, the results cannot assess causal relationships. Despite these limitations, the data from this study can be used to illustrate the relationships that occurred between socioeconomic status, subjective social status and perceived health in Latin American immigrant women. However, more studies are needed with larger random samples.
Conclusion
Received: Oct. 8th 2012
Accepted: July 31st 2013
social status could predict perceived health status better than socioeconomic status. The subjective social status
may better relect the social position of immigrant
women by considering, in addition to socioeconomic status, other contextual factors related to the migration process. A social gradient between subjective social status and perceived health is presented, suggesting that this indicator may be relevant for the study of health inequalities and to interdisciplinary practice in health, particularly in the socially disadvantaged population, such as economic migrants.
References
1. Marmot M. Status syndrome. A challenge to medicine. JAMA. 2006 March;295(11): 1304-7.
2. Whitehead M, Dahlgren G. Conceptos y principios de la lucha contra las desigualdades sociales en salud. Desarrollando el máximo potencial de salud para toda la población. España: Ministerio de Sanidad y Política Social; 2010.
3. Wolff LS, Acevedo-Garcia D, Subramanian S, Weber D, Kawachi I. Subjective Social Status, a New Measure in Health Disparities Research. J Health Psychol. 2010;15(4):560.
4. Operario D, Adler N, Williams D. Subjective social status: reliability and predictive utility for global health. Psychol Health. 2004;19(2):237-46.
5. Adler N, Stewart J. The MacArthur Scale of Subjective Social Status [Internet]. 2007; [acesso 28 out 2012]. Disponível em: http://www.macses.ucsf.edu/research/ psychosocial/subjective.php
6. Adler N, Singh-Manoux A, Schwartz J, Stewart J, Matthews K, Marmot M. Social status and health: A comparison of British civil servants in Whitehall-II with European- and African-Americans in CARDIA. Soc Sci Med. 2008;66(5):1034-45.
7. Adler N, Stewart J. Health disparities across the lifespan: Meaning, methods, and mechanisms. Ann NY Acad Sci. 2010;1186:5-23.
8. Instituto Cántabro de Estadística –ICANE (ES). Boletin de Síntesis Demográfica Cantabria. Cantabria: Consejería de Economía y Hacienda; 2009.
9. Molpeceres L. Situación laboral de las mujeres inmigrantes en España. Cuad Relaciones Lab. 2012;30(1):91-113.
10. Instituto Cántabro de Estadística –ICANE (ES). Explotación Estadística Padrón Municipal Cantabria 2010. Gobierno de Cantabria. Consejería de Economía y Hacienda 2011; [acesso 19 jan 2012]. Disponível em:
http://www.icane.es/web/icane/publicaciones.
11. Sistema de Información Sanitaria del SNS (ES). Encuesta Nacional de Salud de España 2006. Ministerio de Sanidad, Servicios Sociales e Igualdad. Gobierno de España. [acesso 19 jan 2012]. Disponível em: http://www.msps.es/estadEstudios/estadisticas/ encuestaNacional/encuesta2006.htm..
12. Silverman D. Doing Qualitative Research. A Practical Handbook. 2nd ed. London: SAGE; 2006.
13. Burström B, Fredlund P. Self rated health: is it as good a predictor of subsequent mortality among adults in lowere as well as in higher social classes? J Epidemiol Commun Health. 2001;55:836-40.
14. Idler EL, Benyamini Y. Self-rated health and mortality: a review of twenty-seven community studies. J Health Soc Behav. 1997;38(1):21-37.
15. Regidor E. La clasificación de clase social de Goldthorpe: marco de referencia para la propuesta de medición de la clase social del grupo de trabajo de la Sociedad Española de Epidemiología. Rev Española Salud Pública. [Internet]; 2001 [acesso 12 jan 2011];75(1). Disponível em: http://scielo. isciii.es/scielo.php?script=sci_arttext&pid=S1135-57272001000100003&lng=es.
16. Franzini L, Fernandez-Esquer M. The association of subjective social status and health in low-income Mexican-origin individuals in Texas. Soc Sci Med. 2006;63:788-804.
17. de Castro AB, Gee GC, Takeuchi DT. Examining alternative measures of social disadvantage among Asian Americans: the relevance of economic opportunity, subjective social status, and financial strain for health. J Immigr Minor Health. 2010 Oct;12(5):659-71.
18. Ostrove J, Adler N, Kuppermann M, Washington E. Objective and subjective assessments of socioeconomic status and their relationship to self-rated health in an ethnically diverse sample of pregnant women. Health Psychol. 2000;19(6):613-8.