FREE THEMES
1 Faculdade de Medicina, Universidade Federal de Minas Gerais (UFMG). Av. Alfredo Balena 190, Santa Efigênia. 30190-100 Belo Horizonte MG Brasil. [email protected] 2 Centro de Ciências da Saúde, Universidade Federal de São João Del-Rei. São João Del-Rei MG Brasil. 3 Faculdade de Letras, UFMG. Belo Horizonte MG Brasil.
Concurrent and face validity of the MacArthur scale for assessing
subjective social status: Brazilian Longitudinal Study of Adult
Health (ELSA-Brasil)
Abstract This work assessed the concurrent and face validity of the MacArthur scale, which at-tempts to capture subjective social status in soci-ety, neighborhood and work contexts. The study population comprised a convenience sample made up of 159 adult participants of the ELSA-Brasil cohort study conducted in Minas Gerais between 2012 and 2014. The analysis was conducted drawing on Conceptual Metaphor Theory and us-ing corpus lus-inguistic methods. Concurrent validity was shown to be moderate for the society ladder (Kappaw = 0.55) and good for the neighborhood (Kappaw = 0.60) and work (Kappaw = 0,67) lad-ders. Face validity indicated that the MacArthur scale really captures subjective social status across indicators of socioeconomic position, thus con-firming that it is a valuable tool for the study of social inequalities in health Brazil.
Key words Social class, Linguistics, Metaphor, Validity
Wasney de Almeida Ferreira 1
Luana Giatti 1
Roberta Carvalho de Figueiredo 2
Heliana Ribeiro de Mello 3
Fe
rr
eir
Introduction
Objective social status (OSS), a commonly used indicator in studies addressing social inequalities in health, can be defined as the prestige associ-ated with an individual’s position in the social hierarchy, which determines access to goods, services, and knowledge1. In addition to prestige,
social status also encompasses the power and honor attributed to a social position in the exist-ing class hierarchy2. Subjective social status (SSS)
on the other hand can be defined as an individ-ual’s common sense perception of his/her social standing3,4. It comprises a sense of belonging and
identity in relation to the values, interests and habits of a particular social class5. It is believed
that social inequalities in health are determined by both objective social status and subjective psy-chosocial perceptions6-9. Despite the importance
of SSS, objective indicators such as income and schooling have received more research attention, possibly because they are easier to measure10.
The MacArthur scale is one of the most widely used measures of SSS in epidemiological studies. It was developed to capture the common sense of social status across socioeconomic indicators such as income, education and occupation3. The
scale comprises two 10-step ladders: one that at-tempts to capture broader social status and one that assesses standing in the local environment (community). Low SSS has been associated with a higher prevalence of arterial hypertension11,
type 2 diabetes4 and respiratory infections12,
and with poor health rated health13, even after
adjustment for objective socioeconomic indica-tors. A comparative study of the predictive pow-er of objective and subjective status showed that although both were predictors of poor health status, only subjective status was independently associated with health outcomes14. The authors
suggested the following three hypotheses to ex-plain these results: 1) SSS represents a cognitive average of objective socioeconomic indicators; 2) OSS is absolute, while SSS is relative; and 3) the association between SSS and health and disease is spurious, being affected by response bias or con-fused by other variables.
The MacArthur scale was recently translated and adapted for use in Brazil as part of the Lon-gitudinal Study of Adult Health in Brazil (Estudo Longitudinal de Saúde do Adulto – ELSA, Brasil). Although the Brazilian version has been shown to have good reliability15, an analysis of the scale’s
instructions conducted within a cognitive linguis-tics framework16,17 raises questions as to whether
it actually provides a direct assessment of status, given that the instructions fail to explicitly men-tion the word “status”, referring only to “income”, “education”, “work”, and “standard of living”. In view of Brazil’s rich sociocultural diversity18 and
recent political changes19, it is likely that not
ev-eryone will grasp the meaning of “status” in the instructions. Semantically speaking, saying that someone “has a high income, but does not have status” is not contradiction per se. This statement would be contradictory only if the idealized cog-nitive model (ICM) of social status was shared across the entire scope of Brazilian culture. ICMs are stable, organized and idealized theories and representations of the world and act as structures of sociocultural expectations20,21. They are
inti-mately related to prototypes, which are abstract “representations” involved in categorization processes, which bring together attributes and meanings that better designate a category20,21
.
The theories referred to above stem from the fact that cognitive linguists generally work with the weak version of the principle of linguis-tic relativity16, which considers different world
views (Weltanschauung)22. This version suggests
that language only partially influences cognition (thought, perception, memory, etc.) and culture. Within this context, the perceived linguistic vari-ations among individuals belonging to different social classes and age groups reflect different world views and, possibly, “status”. Within the weak version, these varying world views are not completely isolated and exclusive, but rather have zones of experiential intersection. In short, it can be said that individuals have different world views depending on their gender, class and level of schooling, with ICMs that result in different prototypes of social categorization.
It is also important to remember that, al-though “status” may include prestige and re-nown, the Brazilian Portuguese dictionary defi-nition does not always encompass the socioeco-nomic aspects of the term23,24 commonly found
in English25,26 and sociology27 dictionaries. We
aúd
e C
ole
tiv
a,
23(4):1267-1280,
2018
Method
Study Population
The ELSA-Brasil is a multicentric cohort study developed in higher education and research institutions in six different Brazilian states. The baseline of the study, conducted between 2008 and 2010, included 15,105 active and retired workers from the participating institutions. The main aims of the study are to investigate the in-cidence and progression of diabetes and cardio-vascular diseases and the biological, behavioral, environmental, occupational, psychological and social factors associated with these diseases and their complications30,31. The ELSA-Brasil was
conducted in accordance with the norms and standards for research involving human sub-jects and approved by the relevant state ethics committees and by the National Research Ethics Committee of the Ministry of Health.
The present study used a convenience sample made up of 159 ELSA-Brasil participants from the Minas Gerais Research Center (Centro de In-vestigação de Minas Gerais - CI-MG), who took part in the second visit of examinations and in-terviews conducted between November 2012 and February 2014. The participants were randomly invited to participate in the study, ensuring that the sample size was appropriately distributed across gender, age group and occupation. Each participant was interviewed in the CI-MG by a qualified researcher (WAF). Interviews were con-ducted in a setting that guaranteed participant privacy and confidentiality of information and recorded for subsequent qualitative analysis.
Data collection
A semi-structured interview was conducted using a questionnaire that was pretested and pi-loted via the following stages: 1) application of the status scale; 2) application of the MacArthur scale; and 3) open-ended interviews about the chosen options. After answering the closed-end-ed questions containclosed-end-ed in the status and MacAr-thur scales, participants were asked to answer the following three questions about the MacArthur scale: 1) “What type of people are at the top of the ladder?”; 2) “What kind of people are at the bottom of the ladder?”; 3) “What kind of people are in the middle of the ladder?”. Face validity was tested using the answers to these open-ended questions related to the MacArthur´s scale.
Status scale
The status scale, used as a criterion test to measure the concurrent validity of the MacAr-thur scale, was elaborated from the original MacArthur scale drawing on Conceptual Meta-phor Theory (CMT)32-37, replacing the semantic
equivalence used for the instructions with the word “status”. The original passages were main-tained, seeking to create more referential instruc-tions and allocating prepositional phrases (for example, “in society”, “in your neighborhood” and “at your work”) to activate the respective conceptual domains. This methodology was de-veloped to trigger the priming effect: a preceding stimulus that activates a node in the cognitive network triggering the propagated activation of other nodes38, in such a way that the ladder
do-main is used in the metaphorization of the sta-tus domain. This idea is based on the conceptual metaphor “high status is up” 37 and the primary
metaphors “inequalities are distances”, “up is good”, and “down is bad”36.
Society:
This ladder represents status in society. People who have a high social status are at the top of the ladder. People who have a low social status are at the bottom of the ladder. The higher you consid-er yourself on this laddconsid-er, the closconsid-er you will be to the people who are at the top of the ladder and the lower, the closer to people who find themselves at the bottom. Where would you place yourself on this ladder?
Neighborhood:
Now, following the same logic as the previous question, this ladder represents status within your neighborhood. People define their neighborhood in various ways. Please use the definition that makes most sense to you. People who have a high status within your neighborhood are at the top of the ladder. People who have a low status within your neighborhood are at the bottom of the ladder. Con-sidering the status of the people within your neigh-borhood, where would you place yourself on this ladder?
Work:
Fe
rr
eir
MacArthur scale
The original versions of the MacArthur scale were applied in the same way as they were used in the baseline of the ELSA- Brasil (between 2008 and 2010)15:
Society:
Consider that the ladder I am showing you rep-resents the place that people occupy in society. Peo-ple with more money, a higher level of education and better jobs are at the top of the ladder. People with less money, a lower level of education and worse jobs (jobs with less recognition) or who are unemployed are at the bottom of the ladder. The higher you consider yourself on this ladder, the clos-er you will be to the people who are at the top of the ladder and the lower, the closer to people who find themselves at the bottom. Where would you place yourself on this ladder?
Neighborhood:
Following the same logic as the previous ques-tion, this ladder represents the place people occupy within the neighborhood where you live. People define their neighborhood in various ways. Please use the definition that makes most sense to you. The people in your neighborhood who have a high-er standard of living are at the top of the laddhigh-er. The people in your neighborhood who have a lower standard of living are at the bottom of the ladder. Considering the standard of living of the people in your neighborhood, where would you place yourself on this ladder?
Work:
Finally, following the same logic, this ladder represents the place people occupy at your work. People define their work in various ways. Please use the definition that makes most sense to you. People in the upper echelons, like directors or the president for example, are at the top of the ladder. People who do the less valued jobs are at the bottom of the lad-der. Considering your work, where would you place yourself on this ladder?
The status scale was used as a criterion test to measure the concurrent validity because the ex-plicit introduction of the word “status” is an ob-jective, referential and direct form of measuring subjective social status (SSS). From the point of view of pragmatics39, by applying the status scale
the interviewer says exactly what he/she intends to communicate to the participant (for example: “People who have a high social status are at the top of the ladder”): SSS is assessed directly. On the other hand, by applying the MacArthur scale, the interviewer says something (for example: “People
with more money, a higher level of education and better jobs are at the top of the ladder”) while he intended to communicate something else (for example: “Actually, by these socioeconomic indi-cators I mean that the people at the top have a higher social status”): SSS is assessed indirectly. In the status scale, SSS must be deduced, seman-tically, directly and referentially, based upon the verticality of the ladder (for example: top, higher status; bottom, lower status; middle, average sta-tus), while in the MacArthur scale, SSS must be inferred, pragmatically and indirectly, based on classic socioeconomic indicators (for example: “’x’ has a high level of education, average income and an average job, so probably has a status that is slightly above average”).
Study variables
To investigate the sociodemographic charac-teristics associated with differences in step selec-tion on the respective ladders of the status and MacArthur scales, we created three response vari-ables (one for each context). These were based on the absolute differences between the chosen steps and categorized as follows: 1) no difference; 2) difference of one step; and 3) difference of two or more steps. The sociodemographic variables used were gender (male; female), age categorized according to the 50th percentile (39-52 years; 53-76 years), higher education (yes; no), net family income (1-4; 5-8; 9-10 minimum salaries), social class (low; middle; upper), and occupation (ac-tive; retired). The variables higher education, net family income and social class were taken from the baseline of the ELSA-Brasil, while occupation and age were obtained at the time of the inter-view in the second phase.
Quantitative analysis
The analysis assumes that if the MacArthur scale purportedly assesses SSS in society, the neighborhood, and at work, participants will choose identical steps in the respective ladders of the status scale. Agreement between the re-sponses to the MacArthur and status scales was determined using weighted kappa with a 95% confidence interval. The kappa coefficient was calculated using quadratic weight, because it computes the intraclass correlation coefficient40.
aúd
e C
ole
tiv
a,
23(4):1267-1280,
2018
were classified according to Altman’s criteria41:
poor: -1 to 0.2; fair: 0.2 to 0.4; moderate: 0.4 to 0.6; good: 0.6 to 0.8; very good: 0.8 to 1.0.
Weighted Kappa was used to test concurrent validity because it represents the magnitude of overlapping between the semantic areas of the constructs of the status and MacArthur scales, given that the instructions of the status scale were constructed, a priori, to safeguard synonymy in relation to the MacArthur scale. Thus, a weighted Kappa value of 1.0 means that the areas of the constructs of the status and MacArthur scales are semantically equivalent (content synonymy) or, in other words, “congruent” and comparable, which are essential elements of valid tools42. It is
important to highlight that similar methodologi-cal procedures using Kappa are conducted in the field of corpus linguistics43.
Ordinal logistic regression was then per-formed to determine which sociodemographic characteristics were associated with the absolute differences in step selection between the respec-tive ladders of the status and MacArthur scales. Odds ratios (OR) and respective 95% confidence intervals were calculated to measure the magni-tude of association using the logit function. A univariate analysis was conducted followed by multivariate analysis with explanatory variables that obtained a value of p < 0.20 adopting a 5% significance level. The maximum likelihood test was used to test the proportional odds assump-tion.
Qualitative analysis
The face validity of the MacArthur scale was tested using empirically-based computational methods of corpus linguistics designed to care-fully collect and analyze linguistic data (also called corpora)28,29. The analysis was conducted
using AntConc (3.4.3w), a freeware concordance software program44.
First, the participants’ answers were tran-scribed in accordance with the norms of the Projeto da Norma Urbana Oral Culta do Rio de Janeiro (NURC)45. Since 62% of the participants
had completed higher education, interviews were randomly selected so as to not create dis-crepancies between the number of interviews of individuals who had not completed higher edu-cation. The selection process also considered dis-tribution by gender, given that there was a statis-tically significant association between these two variables and absolute differences in the
MacAr-thur and status scales. This balance in the size of the corpus is important to allow comparisons between subgroups28.
The transcriptions were organized into nine corpora: A) society (1. top, 2. middle, 3. bottom); B) neighborhood (idem); and C) work (idem). The AntConc keyword list tool was used to ex-tract 100 keywords central to each corpora, re-sulting in a total of 900 keywords. The analysis only considered nouns. Semantically redundant or empty words, such as “gente” (us or people) and “coisa” (thing), were ignored. This is because the semantic network is organized around con-cepts (or nodes) that structure knowledge38. The extraction of keywords requires a reference cor-pus28,29. For this study we used the Projeto Corpus
Brasileiro (GELC)46, which attempts to represent
contemporary Brazilian Portuguese and current-ly comprises almost one billion (989,012,584) words from different textual genres47. The
key-word tool basically conducts a statistical com-parison (log-likelihood) between the word lists of the study corpus and the distribution of the reference corpus.
Each of the keywords are then qualitative-ly anaqualitative-lyzed in the co-text using the program’s N-grams and concordance tools. The co-text is the textual setting in which the target word is found. The first tool lists the words that appear directly on the right (D) or left (E) of the nucle-us, for example “poder”, “poder aquisitivo”, “pod-er aquisitivo maior” (power, purchasing power, greater purchasing power) or “Eu tenho poder”, “tenho poder”, “poder” (I have power, have pow-er, power), while the second lists the keyword in the co-text, for example “(...) as pessoas com poder aquisitivo maior (...)” (people with great-er purchasing power). These strategies were used to capture the nuances of meaning (for example “doesn’t have access to education” is different to “didn’t have access to education”). These se-mantic frames were used to better describe the semantic fieldsin which they are found linked to keywords48.
quantifica-Fe
rr
eir
tions, for example “mais/menos rico” (more/less rich), and 3.2) categorizations, for example “casa própria/alugada”(own/rented house). This meth-odology is justified by the fact that grammatical structurereflects, at least partially, conceptualiza-tion processes49. Finally, the keywords belonging
to the same semantic field were grouped, for ex-ample, mais escolaridade: “instrução”, “educação” (higher level of schooling: “training”, “educa-tion”).
Results
Quantitative analysis
Over half of the 159 participants (54%) were men; 51% were aged between 39 and 52 years and 49% between 53 and 76 years; 62% had complet-ed higher complet-education; 33% had a family income of between nine and 10 minimum salaries, 29% be-tween five and eight minimum salaries, and 36% between one and four; 45% were upper class, 33% middle class, and 16% lower class; and 46% were retired.
With respect to the selected step, for the soci-ety ladder the mode for the MacArthur and sta-tus scale was 6 (25%) and 7 (24%), respectively, while the median was 6 for both scales. With re-spect to neighborhood, the mode was 8 for both scales (MacArthur scale, 26%; Status Scale, 27%), and the median was 6 and 5, respectively. Finally, for work the mode was 8 for both scales (MacAr-thur scale, 24%; status scale, 26%), and the medi-an was 6 medi-and 6.5, respectively.
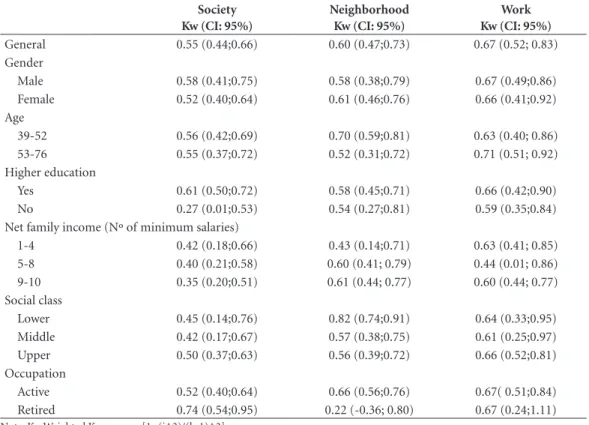
Based on the Kappa values, general agree-ment was shown to be moderate for the society ladder (0.55) and good for the neighborhood (0.60) and work (0.67) ladders (Table 1). No sta-tistically significant differences between kappa statistics for sociodemographic characteristics were observed across all ladders. However, in the society and neighborhood ladders agreement was weak for individuals who had not complet-ed higher complet-education (0.27) and who were retircomplet-ed (0.22), respectively.
The results of the multivariate analysis showed that there was an association between a difference of one or two steps and education on the society ladder and gender on the neighbor-hood ladder. No association was found between a difference of one or two steps and sociodemo-graphic variables on the work ladder. The results of the maximum likelihood test show that none
of the variables broke the proportional odds as-sumption (Table 2).
Qualitative analysis
Chart 1 shows the prototypes obtained for the society ladder of the MacArthur Scale. Pro-totypical examples at the top of the ladder were businessmen and politicians, compared to street dwellers, illiterate and unemployed individuals at the bottom. Prototypical examples in the middle of the ladder were salaried workers, public ser-vants and middle-class workers. With respect to indicators of status, “power” (“political”, “pur-chasing”, “economic” and of “persuasion”) and “prestige” emerged as keywords, while “honor” was not mentioned at any moment during the interviews.
Chart 2 shows the prototypes obtained for the neighborhood ladder. The prototypical ex-amples that remained were businessmen at the top of the ladder and street dwellers, the unem-ployed and individuals living in favelas (slums) at the bottom. In the middle of the ladder, the prototypes were workers and middle-class work-ers and former residents of the neighborhood or building. With respect to indicators of status, only “power” (“purchasing”, “economic” and “fi-nancial”) emerged as a keyword.
Chart 3 shows the prototypes obtained for the MacArthur work ladder. Prototypical exam-ples at the top of the ladder were principals, heads of department, unit directors, businessmen and others, while examples at the bottom were clean-ers, portclean-ers, servants, gardeners and outsourced workers. In the middle of the ladder, prototypes included technical-administrative workers, new teachers, heads of division, and civil servants.
Discussion
wom-aúd
e C
ole
tiv
a,
23(4):1267-1280,
2018
Table 2. Association between sociodemographic characteristics and absolute differences between selected steps in
the MacArthur and status scales, ELSA-Brasil.
Univariate analysis Multivariate analysis
Society Neighborhood Work Society* Neighborhood**
OR (CI: 95%) OR (CI: 95%) OR (CI: 95%) OR (CI: 95%) OR (CI: 95%)
Gender
Male 1.0 1.0 1.0 - 1.0
Female 1.56 (0.87;2.83) 1.91 (1.05;3.47) 1.01 (0.55;1.86) - 1.89 (1.03-3.45)
Ager
53-76 1.0 1.0 1.0 -
-39-52 1,41 (0,78;2,53) 0,81(0,45;1,46) 0,96 (0,52;1,75) -
-Higher education
Yes 1.0 1.0 1.0 1.0
-No 3.70 (1.97;6.95) 1,29 (0,70;2,38) 1,36 (0,73;2,55) 3,45 (1,21;9,82)
-Net family income (Nº of minimum salaries)
9-10 1.0 1.0 1.0 -
-5-8 0.99 (0.46;2.5) 2.16 (1.00;4.68) 1.79 (0.82;3.90) -
-1-4 2.76 (1.35;5.66) 2.27 (1.09;4.74) 1.70 (0.81;3.56) -
-Social class
Upper 1.0 1.0 1.0 -
-Middle 2.26 (1.13;4.50) 1.65 (0.83;3.26) 0.97 (0.48;1.95) -
-Lower 4.43 (1.85;10.65) 1.49 (0.63;3.52) 0.78 (0.32;1.92) -
-Occupation
Retired 1.0 1.0 1.0 -
-Active 1.33 (0.53;3.35) 1.11 (0.45;2.76) 1.03 (0.40;2.67) -
-Note. *Adjusted for net family income and social class. Likelihood: 0.3342. ** Adjusted for net family income 1-4 versus 5-10 salaries. Likelihood: 0.4447.
Table 1. Agreement between the MacArthur and status scales by sociodemographic characteristics, ELSA-Brasil.
Society Kw (CI: 95%)
Neighborhood Kw (CI: 95%)
Work Kw (CI: 95%)
General 0.55 (0.44;0.66) 0.60 (0.47;0.73) 0.67 (0.52; 0.83)
Gender
Male 0.58 (0.41;0.75) 0.58 (0.38;0.79) 0.67 (0.49;0.86)
Female 0.52 (0.40;0.64) 0.61 (0.46;0.76) 0.66 (0.41;0.92)
Age
39-52 0.56 (0.42;0.69) 0.70 (0.59;0.81) 0.63 (0.40; 0.86)
53-76 0.55 (0.37;0.72) 0.52 (0.31;0.72) 0.71 (0.51; 0.92)
Higher education
Yes 0.61 (0.50;0.72) 0.58 (0.45;0.71) 0.66 (0.42;0.90)
No 0.27 (0.01;0.53) 0.54 (0.27;0.81) 0.59 (0.35;0.84)
Net family income (Nº of minimum salaries)
1-4 0.42 (0.18;0.66) 0.43 (0.14;0.71) 0.63 (0.41; 0.85)
5-8 0.40 (0.21;0.58) 0.60 (0.41; 0.79) 0.44 (0.01; 0.86)
9-10 0.35 (0.20;0.51) 0.61 (0.44; 0.77) 0.60 (0.44; 0.77)
Social class
Lower 0.45 (0.14;0.76) 0.82 (0.74;0.91) 0.64 (0.33;0.95)
Middle 0.42 (0.17;0.67) 0.57 (0.38;0.75) 0.61 (0.25;0.97)
Upper 0.50 (0.37;0.63) 0.56 (0.39;0.72) 0.66 (0.52;0.81)
Occupation
Active 0.52 (0.40;0.64) 0.66 (0.56;0.76) 0.67( 0.51;0.84)
Retired 0.74 (0.54;0.95) 0.22 (-0.36; 0.80) 0.67 (0.24;1.11)
Fe
rr
eir
en in the neighborhood ladder. Although these results support our hypothesis that given that individuals from different social classes are likely to have different conceptions of the term “status”, they should be treated with caution. Differences of one step may just express preferences without any major connotation of socioeconomic posi-tion. It is also important to highlight that weight-ed Kappa showweight-ed that weight-education and gender did not have an influence in the society and neigh-borhood ladders, respectively.
The differences in step selection on the so-ciety ladder between the status and MacArthur scales may be explained by two hypotheses, one of which is based on cognitive linguistics and the other sociocultural. From a cognitive linguistics point of view, it is assumed that individuals who have not completed higher education have great-er difficulty in undgreat-erstanding the instructions of the MacArthur scale for the society ladder.The instructions of the MacArthur scale are more complex linguistically speaking since they have
Chart 1. Prototypes for the MacArthur society (general) ladder, ELSA-Brasil.
Bottom Middle Top
WORSE JOBS: have jobs: worse, without stability, without security;
have informal underpaid job; or
without job; less job offers;
LOWER LEVEL OF SCHOOLING: have less/little/or do not have
education/schooling;fundamental level of schooling; do not have/
did not have education or access to
education; have less/lower level of
training;
LOWER INCOME: have worse/
lower salaries; less than one or two
minimum salaries; low salary; or no salary; have very little /do not have
money; have low income; or do not have income;
WORSE LIVING CONDITIONS:
have poor/lost their health; do not
have private health; do not have health to earn his/her own living;
have/had less/few opportunities; do
not have food security or have no
job; without housing; do not have
their own home; are street dwellers;
or live on the street; do not have/did
not have access to things.
AVERAGE JOBS: have jobs: average, reasonable, satisfactory, better and formal; or have access to
and search for jobs; are employees:
average public or perhaps high-level;
AVERAGE LEVEL OF SCHOOLING: have secondary
education; or better access to
education today; have schooling;
a little schooling; completed only normal schooling;
AVERAGE INCOME: have/earn
salaries: medium; “get by” with little salary;
AVERAGE LIVING CONDITIONS: are from the
middle class: formerly middle,
lower or middle class; reach better
positions and climbed to better positions; have average purchasing
and political power; may reach
“the top”; achieved a certain
status; are from the in-crowd:
average and from the judiciary;
have life: moderate, dignified,
stable and improvable; have leisure
conditions.
BETTER JOBS: have jobs: better, stable and important; more jobs
(offers); are big businessmen:
businessmen who have schooling, many or some of them; are big
politicians;
HIGHER LEVEL OF
SCHOOLING: have more/better
training;privileged training; have
PhD; have/did degree/post-graduate
degree; have much/higher level of study; although practically the majority did not study; have much/
higher level of schooling; but also
some do not have much schooling;
have a lot of knowledge; also some
have little knowledge;
HIGH INCOME: have/earn a lot of/
more money; have higher salaries;
BETTER LIVING CONDITIONS:
have a lot of/more power: political,
purchasing, economic and of
persuasion; are from high society,
have important (“central”) jobs;
have a lot of/more prestige; social
prestige; some because they deserve
it/other not.
aúd
e C
ole
tiv
a,
23(4):1267-1280,
2018
long periods and subordinate constructions, thus requiring substantially greater cognitive skills. The short-term memory is limited and holds around seven (CI: 5-9) chunks of information38 and
var-ious linguistic constituents can overload it (for example: “more money”, “greater schooling”, etc.).
Chart 2. Prototypes for the MacArthur neighborhood (general) ladder, ELSA-Brasil.
Bottom Middle Top
LOWER STANDARD OF LIVING:
have lower/low standard of living; do
not manage to maintain a moderate standard of living;
WORSE HOUSING: have houses:
simple, rented, without maintenance; or do not have houses; can’t afford
their own house; have housing in
subhuman conditions; housing incompatible with what they deserve,
or no housing; are in/live in favelas;
live close to favelas; have to pay rent;
WORSE LIVING CONDITIONS: have worse, unstable lives; precarious
conditions; are in the neighborhood;
work in the neighborhood; or are from neighboring areas; are some
neighbors; from neighboring areas;
WORSE JOBS: have jobs: more simple, badly paid, disadvantaged, or do not have;
EXCLUDED: are from/in the
neighborhood; do not have any place
to live; each day in a different place; are street dwellers, are there or clean the street;
FEW OPPORTUNITIES: do not have/
did not have opportunities to enter the
job market, society or to be someone;
LESS SCHOOLING: have less/little/ no schooling; did not have education for ascend socially.
AVERAGE STANDARD OF LIVING have
a moderate standard of living; better and
more average; are middle class: middle,
lower-middle or poor; have salaries;
survive on them; around five salaries;
AVERAG HOUSING: have houses:
own, average size, reasonable and good;
have housing: good, comfortable; do
not own the house; are older buildings;
former residents of the building; do not
have to pay rent; or pay/live in rented
accommodation;
AVERAGE LIVING CONDITIONS: have stable, average, normal, but simple, more
average lives; managed to improve and “be
someone in life”;
AVERAGE JOBS: have jobs: fixed, good and average;
INCLUDED: are/stay in the neighborhood
(former residents); have ascended socially (with the consequent social ascension of the neighborhood); have intermediate
status in my neighborhood;
SAÚDE: do not have private health plan
and depend on health center
HIGH STANDARD OF LIVING:
have a higher/high standard of
living, much better, really higher; have greater purchasing, economic and financial power (much above); power “in their hands”; have a lot of
and spend a lot of/more money; to
show they have money; have better/
good salaries; salaries much better
than mine;
BETTER HOUSING: have houses:
own, better, very good, luxurious, with security guards; buy things for
the house; have more cars; very good
cars, in the garage; two, three cars; change cars;
BETTER LIVING CONDITIONS: have professional, defined, more
stable, comfortable lives; lucky in
life;
BETTER JOBS: have good/better
employment; got good jobs; are
businessmen; big businessmen;
INCLUDED/IMPORTANT: are
people within the neighborhood
(“central”); there are few neighbors;
or all the neighbors in the neighborhood
Note. Keywords in italic from the contemporary Portuguese language.
This hypothesis based on cognitive linguistics is tied with the fact that the performance of indi-viduals with lower levels of education in cognitive tests, including ELSA-Brasil, is generally worse50,51.
Fe
rr
eir
Chart 3. Prototypes for the MacArthur work (general) ladder, ELSA-Brasil.
Bottom Middle Top
SUPPORT WORKERS: are from
cleaning: servers, helpers, menial workers or employees; are from
cleaning/cleaners; are servants: construction or cleaning; are
gardeners; are porters; are from the support level, medium
support; work in maintenance; are
outsourced workers;
LABORERS: have services: menial,
domestic, support, simple, general
and less valued; have work: more
heavy work, less work time, influenced by the environment;
UNDERVALUED: have positions:
lower and less privileged; have/
earn lower/worse salaries; depend
on minimum salary; or don’t have salary;
LESS SCHOOLING: have lower
level of/less schooling; or do not
need it;
COMMERCIAL EMPLOYEES:
are employed in commerce; or
commercial services;
UNQUALIFIED: are people who
do/carry out their profession badly;
are employees: poorly qualified, more simple, not satisfied.
TECHNICAL-ADMINISTRATIVE
WORKERS: are technicians:
administrative, graduate; the majority are technical assistants; are
heads of divisions;
NEW TEACHERS: are teachers: that
have just started, assistants, give more classes; or do not progress;
SALARIED WORKERS: have a
salary: average, good, better and bigger; know how to control their
salary;
AVERAGELY PRESTIGIOUS: receive some form of recognition
for the service they provide; are of
secondary school level in my work;
have a defined profession; are from
maintenance;
CIVIL SERVANTS: are public
employees; some are very successful; some are of secondary school level.
IMPORTANT POSITIONS: are
principals/deans;are directors: of units, schools, sectors, hospitals, institutions, etc.; are from the management: general or
superintendent; are managers; are
in the institution: bosses, directors,
who decide the “direction” of the institution;
PROFESSORS WITH PHD: are
professors: university professors, heads, highly qualified, PhD;
CENTRAL/IMPORTANT: are
within my work (“central”), in
the environment; or do not have
anyone above them; are “parts”
that cannot be “discarded”, indispensable.
EXECUTIVE POSTS: are heads: of
department, institutions, services,
hospitals; are coordinators; are
from the management of the sector;
are engineers; are some work
colleagues;
BUSINESSMEN: are businessmen;
senior businessmen;
POLITICIANS: are involved in
politics; inuniversity politics.
Note. Keywords in italic from the contemporary Portuguese language.
who have not completed higher education the conception of status is not exactly the same as that proposed by the MacArthur scale. This hypothe-sis, which is less likely to be true, is tied to the fact that Brazil is made up of various cultural matri-ces18. Despite these considerations, our findings
show that the society ladder of the MacArthur scale can be used as an indicator of subjective so-cial status, principally because it represents a cog-nitive average of the indicators of socioeconomic
position throughout life and captures aspects that go beyond objective indicators14.
wom-aúd
e C
ole
tiv
a,
23(4):1267-1280,
2018
en generally have better verbal skills, perceptual speed and short-term memory52. Therefore, the
difference is unlikely to be due to differences in cognitive levels and linguistic abilities. It should be noted that the strength of association between gender and differences in step selection was weak and, moreover, we did not note any major dif-ference between the prototypes selected by men and women in the open-ended interviews for the neighborhood ladder of the MacArthur scale. Therefore, our results suggest that this ladder can be used as an indicator of subjective social status, principally because it captures the nuanced per-ceptions of poorer individuals3.
With respect to the MacArthur scale, the work ladder was shown to have the best con-current validity of the three ladders and can also be used as an indicator of subjective social status, principally because it relativizes percep-tions within occupational hierarchies. The three ladders of the MacArthur scale obtained good results for face validity, showing that they really capture status. The main indicator of status for the society ladder was power (political, economic or of persuasion), followed by prestige. The main prototypes of high status in society were big busi-nessmen, politicians and individuals with a PhD. Prestige was not mentioned in the neighborhood ladder of the MacArthur scale, with power (eco-nomic, purchasing and financial) being the only indicator of status and businessmen and owners (housing, vehicles, etc.) as the prototypes of high status. Finally, although the indicators of status did not appear explicitly in the work ladder, they may be semantically deduced (for example the higher the level of education and income, the greater the tendency towards higher status). The prototypes of high status were principals, deans, directors and heads of department, together with businessmen. It is worth mentioning that “hon-or” was not mentioned during the interviews and was the indicator that least characterizes status among the study population.
The results regarding face validity are in line with those found in the literature, which is to be expected given that the aim of the MacArthur scale is to capture the common sense of social status across indicators of socioeconomic po-sition3. According to Adler and Stew3, the most
common indicator of status in the society ladder was material wealth (90%), followed by occu-pation (72%), and education (62%). It is inter-esting to note that ethical, spiritual and altruis-tic aspects were also reported (~25%) as being important elements in the characterization of
status. Our findings are consistent with those of Adler and Stew3, since the responses regarding
the society ladder of the MacArthur scale en-compassed “merit”, “opportunity”, and “access” in addition to wealth, education and occupation. With respect to the neighborhood ladder, Adler and Stew showed that wealth (25%), occupation (22%) and education (7%) were less important than aspects such as helping others (87%) (vol-unteers, donators, good citizens, etc.) and being well-seen or respected (52%). In contrast, our re-sults show that the prototypes for neighborhood give priority to aspects related to material wealth, such as purchasing power, money, and having a luxurious house, and that the only ethical, spiri-tual or altruistic aspect mentioned in the neigh-borhood ladder was the keyword “opportunity”.
It is worth highlighting that the Status Scale was used as the criterion test to measure the con-current validity of the MacArthur scale due to the lack of other validated scales in the literature. From the point of view of pragmatics39, given
the fact that the word “status” is explicit in the instructions, the status scale has greater validity for capturing SSS since it requires cognitive and semantic processing and deductive reasoning, while the instructions of the MacArthur scale (where only indicators such as “money”, “school-ing” and “work” are explicit) require cognitive and pragmatic processing and inferential reason-ing, which, to be effective and correct, depend not solely on linguistic instructions, but also on the context of use and world knowledge39. Thus,
we believe that the instructions of the status scale are more objective, referential and direct than those of the MacArthur scale when it comes to measuring SSS, given that the content of the test is not judged only by its title or by what it says it is measuring53.
One of the main limitations of this study is the small number of participants, which result-ed in a limitresult-ed statistical power for the stratifiresult-ed analyses of education and gender. Furthermore, the ordinal nature of the ladder may have re-duced the accuracy of the responses and inre-duced a preference for the middle (on or around step 5). This response centralization bias is a common phenomenon in studies and tests that require choices to be made based on numeric scales or figures such as a ladder or slide rule54. Finally, it is
Fe
rr
eir
Collaborations
WA Ferreira, SM Barreto, L Giatti and RC Figue-iredo outlined the study, conducted the analysis and prepared the final version of the manuscript. WA Ferreira performed the data collection. HR Mello contributed in the analysis, discussion and final version of the manuscript (expert in linguis-tics and corpus). The paper is part of the doctoral thesis of WA Ferreira (public health, epidemiol-ogy area).
Acknowledgments
aúd
e C
ole
tiv
a,
23(4):1267-1280,
2018
References
1. Krieger N, Williams D, Moss, N. Measuring social class in US public health research: concepts, methodologies and guidelines. Annu Rev Public Health 1997; 18:341-78.
2. Weber M. Ensaios de sociologia. Rio de Janeiro: LTC; 1982.
3. Adler NE, Stewart J. The MacArthur scale of subjective so-cial status [Internet]. 2007; [cited 2014 Jun 4]. Available from: http://www.macses.ucsf.edu/research/psychoso-cial/subjective.php.
4. Demakakos P, Nazroo J, Breeze E, Marmot M. Socio-economic status and health: the role of subjective social status. Soc Sci Med 2008; 67(2):330-340.
5. Jackman MR, Jackman RW. An interpretation of the relation between objective and subjective social status.
American Sociological Review 1973; 38(5):569-582. 6. Arcaya MC, Arcaya AL, Subramanian SV. Inequalities
in health: definitions, concepts, and theories. Global Health Action 2015; 8:27106.
7. Morin P. Rank and health: a conceptual discussion of subjective health and psychological perceptions of so-cial status. Psychother Politics Int 2006; 4(1):42-54. 8. Euteneuer F. Subjective social status and health. Curr
Opin Psychiatry 2014; 27(5):337-342.
9. Miyakawa M, Magnusson HLL, Theorell T, Wester-lund H. Subjective social status: its determinants and association with health in the Swedish working pop-ulation (the SLOSH study). Eur J Public Health 2012; 22(4):593-597.
10. Camelo LV, Giatti L, Barreto SM. Subjective social sta-tus, self-rated health and tobacco smoking: Brazilian Longitudinal Study of Adult Health (ELSA-Brasil). J Health Psychol 2014; 19(11):1388-1399.
11. Chen B, Covinsky KE, Stijacic Cenzer I, Adler N, Wil-liams BA. Subjective social status and functional de-cline in older adults. J Gen Intern Med 2012; 27(6):693-699.
12. Coher S, Alper CM, Doyle WJ, Adler N, Treanor JJ, Turner RB. Objective and subjective socioeconomic status and susceptibility to the common cold. Health Psychol 2008; 27(2):268-274.
13. Gong F, Xu J, Takeuchi DT. Beyond conventional so-cioeconomic status: examining subjective and ob-jective social status with self-reported health among Asian immigrants. J Behav Med 2012; 35(4):407-419. 14. Singh-Manoux A, Marmot MG, Adler NE. Does sub-jective social status predict health and change in health status better than objective status? Psychosom Med
2005; 67(6):855-861.
15. Giatti L, Camelo LV, Rodrigues JFC, Barreto SM. Re-liability of the MacArthur scale of subjective social status - Brazilian Longitudinal Study of Adult Health (ELSA-Brasil). BMC Public Health 2012; 12:1096. 16. Evans V, Green M. Cognitive linguistics. Edinburgh:
Ed-inburgh University Press; 2006.
17. Geeraerts D, Cuyckens H, editors. The oxford handbook of cognitive linguistics. Oxford: Oxford University Press; 2007.
18. Ribeiro D. O povo brasileiro: a formação e o sentido do Brasil. São Paulo: Companhia das Letras; 1995. 19. Fausto B. História do Brasil. São Paulo: EdUSP; 2012.
20. Lakoff G. Women, fire and dangerous things: what cat-egories reveal about the mind. Chicago: University of Chicago Press; 1987.
21. Evans V. A glossary of cognitive linguistics. Edinburgh: Edinburgh University Press; 2007.
22. Underhill JW. Humboldt, worldview and language. Ed-inburgh: Edinburgh University Press; 2009.
23. Dicionário Caldas Aulete [Internet]. Status; [cited 2014 Jun 4]. Available from: http://www.aulete.com.br/sta-tus.
24. Ferreira ABH. Novo dicionário eletrônico Aurélio [CD -ROM]. Versão 5.0. Curitiba: Positivo; 2004.
25. Dictionary.Com [Internet]. Status; [cited 2014 Jun 4]. Available from: http://dictionary.reference.com/ browse/status?s=t.
26. Etymoline [Internet]. Status; [cited 2014 Jun 4]. Avail-able from: http://www.etymonline.com/index.php?ter-m=status.
27. Johnson AG. Dicionário de sociologia: guia prático da linguagem sociológica. Rio de Janeiro: Zahar; 1997. 28. Baker P. Sociolinguistics and corpus linguistics.
Edin-burgh: Edinburgh University Press; 2010.
29. Sardinha TB. Lingüística de corpus. São Paulo: Manole; 2004.
30. Aquino EM, Barreto SM, Bensenor IM, Carvalho MS, Chor D, Duncan BB, Lotufo PA, Mill JG, Moli-na Mdel C, Mota EL, Passos VM, Schmidt MI, Szklo M. Brazilian Longitudinal Study of Adult Health (EL-SA-Brasil): objectives and design. Am J Epidemiol 2012; 175(4):315-324.
31. Schmidt MI, Duncan BB, Mill JG, Lotufo PA, Chor D, Barreto SM, Aquino EM, Passos VM, Matos SM, Moli-na Mdel C, Carvalho MS, Bensenor IM. Cohort profile: Longitudinal Study of Adult Health (ELSA-Brasil). Int J Epidemiol 2015; 44(1):68-75.
32. Lakoff G. The contemporary theory of metaphor. In: Ortony A, editor. Metaphor and thought. Cambridge: Cambridge University Press; 1993. p. 202-251. 33. Lakoff G, Johnson M. Why cognitive linguistics
re-quires embodied realism. Cognitive Linguistics 2002; 13(3):245-263.
34. Lakoff G, Johnson M. Metaphors we live by. Chicago: University of Chicago Press; 1980.
35. Lakoff G, Johnson M. Philosophy in the flesh: the em-bodied mind and its challenge to western thought. New York: Basic Books; 1999.
36. Kövecses Z. Metaphor: a practical introduction. New York: Oxford University Press; 2002.
37. Kövecses Z. Metaphor in culture: universality and varia-tion. New York: Cambridge University Press; 2006. 38. Sternberg RJ. Psicologia cognitiva. Porto Alegre:
Art-med; 2000.
39. Levinson S. Pragmática. São Paulo: Martins Fontes; 2007.
40. Fleiss JL, Cohen J. The equivalence of weighted kappa and the intraclass correlation coefficient as measures of reliability. Education and Psychological Measurement
1973; 33:613-619.
Fe
rr
eir
42. Pasquali L. Psicometria: teoria dos testes na psicologia e na educação. Petrópolis: Vozes; 2013.
43. Karletta J. Assessing agreement on classification tasks: the kappa statistics. In: Sampson G, McCarthy D, edi-tors. Corpus linguistics: reading in a widening discipline. London: Continuum; 2004. p. 335-339.
44. Anthony L. AntConc [CD-ROM]. Version 3.4.3w. To-kyo: Waseda University; 2014.
45. Preti D, editor. O discurso oral culto. São Paulo: Huma-nitas Publicações; 1999.
46. Grupo GELC. Projeto corpus brasileiro [Internet]. São Paulo: Pontifícia Universidade Católica de São Paulo.
Programa de Pós-Graduação em Linguística Aplicada, Centro de Pesquisas, Recursos e Informação de Lingua-gem; 2014 [cited 2014 Jun 4]. Available from: http:// corpusbrasileiro.pucsp.br/cb/Inicial.html.
47. Costa L, Santos D, Cardoso N, editors. Perspectivas so-bre a Linguateca. Actas do Encontro Linguateca: 10 anos. Aveiro: Linguateca; 2008.
48. Brandt PA. The architecture of semantic domains: A grounding hypothesis in cognitive semiotics. Revista Portuguesa de Humanidades 2000; 4(1-2):11-51. 49. Langacker RW. Foundations of cognitive grammar:
theoretical prerequisites. Stanford: Stanford University Press; 1987.
50. Araújo LF, Giatti L, Chor D, Passos VM, Barreto SM. Maternal education, anthropometric markers of mal-nutrition and cognitive function (ELSA-Brasil). BMC Public Health 2014; 14:673.
51. Passos VMA, Giatti L, Benseñor I, Tiemeier H, Ikram MA, Figueiredo RC, Chor D, Schmidt MI, Barreto SM. Education plays a greater role than age in cognitive test performance among participants of the Brazilian Lon-gitudinal Study of Adult Health (ELSA-Brasil). BMC Neurol 2015; 15:191.
52. Flores-Mendoza C. Diferenças intelectuais entre ho-mens e mulheres: uma breve revisão da literatura. Psi-cólogo Informação 2000; 4(4):25-34.
53. Urbina S. Fundamentos da testagem psicológica. Rio Grande do Sul: Artmed; 2007.
54. Valenzuela A, Raghubir P. Position-based beliefs: the center-stage effect. Journal of Consumer Psychology
2009; 19(2):185-196.
Article submitted 28/11/2015 Approved 04/07/2016
Final version submitted 06/07/2016
This is an Open Access article distributed under the terms of the Creative Commons Attribution License