Alvaro J IdrovoI
Myriam Ruiz-RodríguezII
Abigail P Manzano-PatiñoIII
I Centro de Investigación en Sistemas de Salud. Instituto Nacional de Salud Pública. Cuernavaca, México
II Departamento de Salud Pública.
Facultad de Salud. Universidad Industrial de Santander. Bucaramanga, Colombia III Dirección General de Evaluación Educativa.
Universidad Nacional Autónoma de México. México DF, México Correspondência | Correspondence: Alvaro J. Idrovo
Instituto Nacional de Salud Pública Av. Universidad, 655
Colonia Santa Maria Ahuacatitlán 62100 Cuernavaca, México E-mail: [email protected] Received: 6/24/2009 Approved: 2/5/2010
Artigo disponível em português | inglês em www.scielo.br/rsp
Beyond the income inequality
hypothesis and human health: a
worldwide exploration
Além da hipótese de desigualdade de
renda e infl uência na saúde humana:
uma exploração global
ABSTRACT
OBJECTIVE: To analyze whether the relationship between income inequality
and human health is mediated through social capital, and whether political regime determines differences in income inequality and social capital among countries.
METHODS: Path analysis of cross sectional ecological data from 110 countries.
Life expectancy at birth was the outcome variable, and income inequality (measured by the Gini coeffi cient), social capital (measured by the Corruption Perceptions Index or generalized trust), and political regime (measured by the Index of Freedom) were the predictor variables. Corruption Perceptions Index (an indirect indicator of social capital) was used to include more developing countries in the analysis. The correlation between Gini coeffi cient and predictor variables was calculated using Spearman’s coeffi cients. The path analysis was designed to assess the effect of income inequality, social capital proxies and political regime on life expectancy.
RESULTS: The path coeffi cients suggest that income inequality has a greater
direct effect on life expectancy at birth than through social capital. Political regime acts on life expectancy at birth through income inequality.
CONCLUSIONS: Income inequality and social capital have direct effects on
life expectancy at birth. The “class/welfare regime model” can be useful for understanding social and health inequalities between countries, whereas the “income inequality hypothesis” which is only a partial approach is especially useful for analyzing differences within countries.
DESCRIPTORS: Income. Social Inequity. Health Inequalities. Economic
The “income inequality hypothesis” suggests that the greater the inequality the more resulting adverse effects on health,21 and this effect is deemed to occur through
social capital.2,14 Putnam’s defi nition of social capital
is the most commonly used in epidemiology. Social capital is conceived as a community level resource defined by features ofsocial organization such as networks, norms and social trust, facilitating coordi-nation and cooperation for mutual benefi t.17 However
other defi nitions are equally important (e.g. Bourdieu & Coleman, cited by Baum & Ziersch4), but they are rarely
used in social epidemiology due to a lack of awareness or the non-availability of quantitative indicators. The majority of studies based on the “income inequality hypothesis” have been exploratory and do not explicitly consider the possible causal pathways. Previous studies, which provided evidence that social capital acts as an intermediate variable, were carried out in the United States.11,14, However a general theory to explain the
relationship between human health, social capital and income inequality requires testing in different contexts and levels of aggregation. This is very important to
RESUMO
OBJETIVO: Analisar se a relação entre a desigualdade de renda e a saúde
humana é mediada pelo capital social, assim como a infl uência do regime político na distribuição de renda nos países.
MÉTODOS: Estudo ecológico de trajetórias utilizando dados transversais
de 110 países. A variável de desfecho foi a esperança de vida ao nascer; as variáveis independentes foram: desigualdade de renda (medida pelo índice de Gini), capital social (medido pelo índice de percepção de corrupção ou confi ança generalizada) e regime político (medido pelo Índice de Liberdade). O Índice de Percepção de Corrupção (um indicador indireto do capital social) foi usado para incluir mais países em desenvolvimento na análise. Foram calculados os coefi cientes de correlação de Spearman entre o índice de Gini com as demais variáveis independentes. A análise de trajetória foi realizada para avaliar o efeito da desigualdade de renda, dos proxys de social capital e do regime político na expectativa de vida.
RESULTADOS: Os coefi cientes de trajetória sugerem que a desigualdade de
renda tem maior impacto direto sobre a esperança de vida ao nascer do que por meio do capital social. O regime político atua sobre a esperança de vida ao nascer por meio da desigualdade de renda.
CONCLUSÕES: A desigualdade de renda e o capital social têm efeitos diretos
sobre a esperança de vida ao nascer. O modelo de regime de “classe/bem-estar” pode ser útil para entender as desigualdades sociais e de saúde entre países, enquanto a hipótese de desigualdade de renda se limita a uma aproximação parcial útil para analisar diferenças dentro dos países.
DESCRITORES: Renda. Iniquidade Social. Desigualdades em Saúde.
Desenvolvimento Econômico. Política Social. Sociologia.
INTRODUCTION
developing countries, such as those in Latin America, because they tend to be excluded in studies carried out in developed countries, constituting a selection bias against more vulnerable populations.
The present study sought to empirically evaluate the causal pathways that allow income inequality to affect human health and to explore the effect of political regime on health, through income distribution and level of social capital. This approach partially follows the “class/welfare regime model”,7 since an explicit
exploration of this model would require data not actu-ally available. Testing alternative models is important due to recent evidence suggesting that the “income inequality hypothesis” is not fully supported.13
METHODS
a United Nations Development Programme. Human Development Report 2004. [cited 2009 Jul 8] Available from: http://hdr.undp.org/en/ reports/global/hdr2004/)
b Transparency International. Annual report 2004. [cited 2009 Aug 15] Available from: http://www.transparency.org/publications/publications/ annual_reports/annual_report_2004;
rest of their life.2 Given that life expectancy is strongly
dependent on the criteria used for selecting groups, in areas of high infant mortality LEB refl ects a high risk of death in the fi rst years of life. We selected LEB in order to consider a latency period between exposure and event. LEB also refl ects infant mortality, a good indication of contemporary conditions.7 Data on LEB were obtained
from the United Nations Development Programme.a
Countries included in the study, by continent, were: Africa: Algeria*, Botswana, Cameroon, Cote d’Ivoire, Egypt*, Ethiopia, Gambia, Ghana*, Kenya, Madagascar, Malawi, Mali, Morocco*, Mozambique, Namibia, Niger, Nigeria*, Senegal, Sierra Leone, South Africa*, Tanzania*, Tunisia, Uganda*, Zambia, and Zimbabwe*; America: Argentina*, Bolivia, Brazil*, Canada*, Chile*, Colombia*, Costa Rica*, Dominican Republic*, Ecuador*, El Salvador*, Guatemala, Honduras, Jamaica, Mexico*, Nicaragua, Panama, Paraguay, Peru*, Trinidad and Tobago, United States of America*, and Venezuela*; Asia: Bangladesh*, China, India*, Indonesia*, Iran*, Israel*, Japan*, Jordan*, Kazakhstan, Korea, Republic (south), Kyrgyzstan, Malaysia, Mongolia, Nepal, Pakistan*, Philippines*, Singapore*, Sri Lanka, Tajikistan, Thailand, Turkey*, Turkmenistan, Uzbekistan, and Viet Nam*; Europe: Albania*, Armenia*, Austria*, Azerbaijan*, Belgium*, Bosnia and Herzegovina*, Bulgaria*, Croatia*, Czech Republic*, Denmark*, Estonia*, Finland*, France*, Georgia*, Germany*, Greece*, Hungary*, Ireland*, Italy*, Latvia*, Lithuania*, Luxembourg*, Macedonia*, Moldova*, Netherlands*, Norway*, Poland*, Portugal*, Romania*, Russian Federation*, Slovakia*, Slovenia*, Spain*, Sweden*, Switzerland*, Ukraine*, and United Kingdom*; and Oceania: Australia*, New Zealand*, and Papua New Guinea. The countries with “*” were analyzed using generalized trust as a proxy for social capital (n=73). Social capital was measured in terms of generalized trust (direct indi-cator) and perceived corruption (indirect indiindi-cator).5,6
The former measure, one of the most frequently used unidimensional indicators of social capital, was taken from a previous study using the World Value Surveys.5
The generalized trust is given by the percentage of the population that answered yes to the question: “In general, do you think that most people can be trusted, or is it the case that you can’t be too careful?”.5
The bases for using perceived corruption as an indirect indicator of social capital are available in sociological or economic publications.5,8,16, For instance, Narayan &
Cassidy indicated and empirically validated that corrup-tion is an outcome of low social capital.16 Bjørnskov5
considered social capital as a multidimensional
construct, in which perceived corruption had higher factor loading than generalized trust and civic partici-pation.5 Moreover, according to this author social trust
and social norms are different; the former is robustly associated with lower corruption while the latter is not related to corruption.5 Note that Putnam’s defi nition of
social capital includes social trust and social norms; thus they are two different dimensions of the same construct. Despite its limitations, there is no other indicator available to increase the sample size. Prevalent corruption in each country was determined using the Corruption Perceptions Index (CPI) 2004, obtained from the Transparency International webpage. This index ranges between 0 and 10, respectively repre-senting the highest and the lowest perceived corruption. It should include information from 2002 and 2004 from three different sources and include 18 surveys and interviews, undertaken by different institutions. These interviews of the country’s experts (analysts and businessmen), resident and non-resident, were used to create an average score on a points system. A detailed explanation of the construction of the CPI 2004, as well as some data on its reliability, is available at the Transparency International webpage.b
Based on evidence indicating that corruption depends on the cultural context,20 we used the measurement of
ethnic fractionalization (MET), proposed by Alesina et al.1 This variable was used in a recent study exploring
the association between income inequality and popu-lation health indicators, because ethnic heterogeneity in health models may bias the associations.18 The
MET consists of a number between 0 and 1 which indicates the degree of ethnic fractionalization; values nearer zero indicate greater homogeneity and those nearer one, greater heterogeneity. MET is calculated as one minus the Herfi ndahl index of ethnic groups’ population shares. An important characteristic of this indicator is that it includes a greater cross-country sample than any other.18
Income inequality was measured using the Gini coef-fi cient, which values ranges between 0 and 1; higher values indicate greater concentration of wealth and lower values, a more even distribution of income. For the purpose of this analysis, the original data from UNDP were converted to percentages, and interpreted in the same way. The political regimes of each country were evaluated using the Index of Freedom from Freedom House International, proposed by Franco et al9 which allows for the classifi cation of nations
rights and the other civil liberties. Each may display values between 1 and 7 with the value being lower where there is greater liberty.
Spearman’s correlation coeffi cients were calculated using the Gini coeffi cient, the CPI 2004, the MET, the Index of Freedom, generalized trust, and LEB. Then, path analyses were used to assess the effect of income inequality, the proxies for social capital, and political regime upon life expectancy at birth. The models were fi tted with EQS 6.1 (Multivariate Software, Encino, California), using maximum likelihood estimators. When we used the CPI 2004 in the analysis, the entire sample was included (n=110); when we used general-ized trust, 73 countries were included.
RESULTS
The correlations between the variables studied were statistically signifi cant (p<0.05) and displayed the desired tendency (Table 1). Where LEB was lower, income inequality, political rights and civil liberties or ethnic fractionalization were greater. In addition, LEB was higher when less corruption was perceived and where there are more generalized trust. The Gini coeffi cient was greater where ethnic fractionalization was greater and lower where there was less perceived corruption. The Gini coeffi cient was negatively corre-lated with generalized trust and the CPI 2004, and it was positively correlated with ethnic fractionalization and the Index of Freedom. The correlations between the CPI
Table 1. Spearman correlations between life expectancy at birth, income inequality, perception of corruption, ethnic fractionalization, the Index of Freedom and generalized trust, from 110 countries.
Index n Life expectancy
at birth
Gini coeffi cient
Corruption perceptions index
Ethnic fractionalization
Index of Freedom
Gini coeffi cient 110 -0.46* 1
Corruption Perceptions 110 0.73* -0.28* 1
Ethnic fractionalization 110 -0.62* 0.35* -0.43* 1
Index of Freedom 110 -0.67* 0.29* -0.74* 0.39* 1
Generalized trust 73 0.39* -0.44* 0.42* -0.27* * -0.28* *
* p<0.01; * * p<0.05.
Table 2. Goodness of fi t of analyzed models for the causal pathways of political regime, income inequality and social capital upon life expectancy at birth.
Index
Models using the Corruption Perceptions Index
Models using generalized trust
Initiala Intermediateb Finalc Initiald Finale
P-value (x2) Undefi ned <0.001 <0.001 Undefi ned <0.001
Bentler-Bonett normed fi t index 1 0.796 0.791 1 0.741
Bentler-Bonett non-normed fi t index - -0.236 0.320 - -0.599
Comparative fi t index - 0.794 0.796 - 0.733
Bollen fi t index - 0.802 0.804 - 0.750
McDonald fi t index - 0.891 0.845 - 0.914
Lisrel GFI fi t index - 0.903 0.890 - 0.920
Lisrel AGFI index - 0.033 0.452 - 0.204
Standardized Root Mean-Square Residual - 0.096 0.133 - 0.103
Function (minimum) 0 0.24108 0.36650 0 0.19000
r2 0.441 0.441 0.429 0.321 0.321
a The level of perceived corruption acts as an intermediate variable in the relationship between income inequality and life
expectancy at birth (see Figure 1 – initial model). Saturated model; not possible to calculate the indices.
b Same as the previous model but the variable for fractionalization as a predictor of the level of perceived corruption (see
Figure 1 – intermediate model).
c Same as the previous model plus the proxy variable for the political regime as the predictor for income inequality, ethnic
fractionalization and perceived corruption (see Figure 1 – fi nal model).
d The level of generalized trust acts as an intermediate variable in the relationship between income inequality and life
expectancy (see Figure 2 – initial model).
e Same as the previous model plus the proxy variable for political regime as a predictor of income inequality and
2004 and the Index of Freedom or ethnic fractionaliza-tion were negative, indicating that fracfractionaliza-tionalizafractionaliza-tion and political rights and civil liberties were greater, where less corruption was perceived. Ethnic fractionalization was positively correlated with the Index of Freedom and negatively correlated with generalized confi dence. Finally, the Index of Freedom was negatively correlated with generalized trust.
The construction of the model for CPI 2004 (Figure 1) was initiated using the perception of corruption as an intermediate variable in the relationship between income inequality and LEB. Here it was observed that income inequality has a greater direct effect than an indirect effect, taking into account perceived corrup-tion. When ethnic fractionalization was included as a predictor of corruption (intermediate model), it was observed that the direct effect of income inequality on
LEB is maintained to a greater extent than the indirect effect, when arrived at by means of the proxy of social capital. When political regime was included as a predic-tive variable of income inequality, corruption and ethnic fractionalization, it was observed that the Index of Freedom has a greater effect when considered to be a causal pathway for inequality than ethnic fractionaliza-tion and the CPI 2004.
The model that used generalized trust as a proxy for social capital (Figure 2) initially showed that the direct effect of income inequality on LEB was greater when considered as a causal pathway for generalized trust. When the proxy of political regime was included, it was observed that the effect is greater through income inequality than through generalized trust. During the construction of the two models, all the coeffi cients of the trajectory were found to be statistically signifi cant
Figure 1. Construction of path analysis of relationship between income inequality, corruption perception, ethnic fractionaliza-tion, political regime, and life expectancy at birth.
-0.551* -0.151*
-0.311*
-0.337*
0.477*
0.477*
-0.369*
-0.191*
-0.337*
0.325*
0.173
-0.205*
0.328*
-0.341*
0.478*
Life expectancy at birth
Life expectancy at birth Gini
coeficient
Gini coeficient
Gini coeficient Political
Regime
Ethnic fractionalization
Ethnic fractionalization
Corruption perceptions index
Corruption Perceptions Index
Corruption Perceptions Index
Life expectancy at birth Initial model
Final model Intermediate model
* Path coefficients (p<0.05).
Social capital
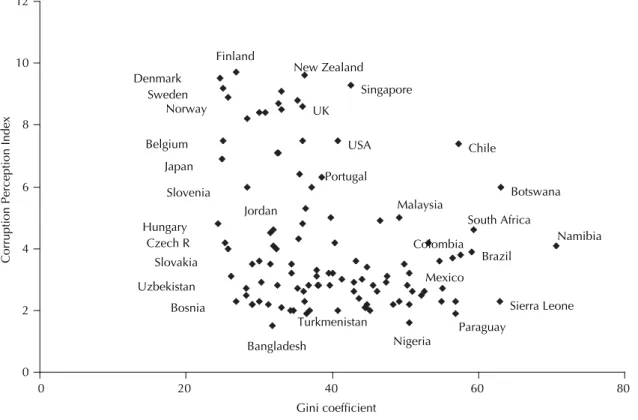
(p<0.05), except for those of political regime to income inequality and political regime to generalized trust, which were only marginally signifi cant. The extent to which each of these models fi t are in Table 2. Figure 3 presents some examples of countries according to
income inequality and social capital levels. Studies undertaken in developed countries, which support the “income inequality hypothesis”, show relatively minor differences in income (which is also frequently the case within countries).
Figure 2. Construction of path analysis of relationship between income inequality, generalized trust, political regime, and life expectancy at birth.
Initial model
Final model
* Path coefficients (p<0.05).
0.234*
-0.415*
-0.301*
Life expectancy at birth Gini
coeficient
Generalized trust
0.255*
0.173
0.190*
-0.415*
-0.301*
Life expectancy at birth Gini
coeficient
Corruption perceptions index Political
Regime
Figure 3. Representative examples of countries according to income inequality and perception of corruption levels.
Turkmenistan Portugal
Jordan
Mexico Malaysia
Slovakia Czech R
Uzbekistan
Bosnia
UK
Nigeria
Paraguay South Africa Japan
Belgium USA
Hungary Norway Sweden
Brazil Colombia Denmark
Finland
Bangladesh Slovenia
New Zealand
Sierra Leone Singapore
Botswana
Namibia Chile
0 2 4 6 8 10 12
0 20 40 60 80
Gini coefficient
DISCUSSION
The most important fi ndings in this study are: 1) income inequality seems to have a direct effect on LEB, which is greater than when social capital is considered as a causal pathway; and 2) political regime has a greater effect considering income inequality than does social capital. In interpreting these fi ndings, considerations such as path analysis and ecological design should be taken into account. The extent to which the models fi t was considered to be acceptable considering the reduced size of our sample, even though we used all countries providing adequate information. This suggests that the “class/welfare regime model” may be more adequate than the “income inequality hypothesis” for explaining the relationship studied, even though it may be necessary to incorporate new variables in order to construct a general theory.
The main challenge in this study was the measurement of social capital,4-6,16 a multidimensional conceptwhere
outcome depends on the components selected. In this study we use perceived corruption as an indirect proxy of social capital,5,6 thus increasing sample size,
espe-cially for developing countries, although general trust is used to make comparisons. The result when using social capital was possibly due to an error in measure-ment; this is a problem without solution in path analysis, but its impact on path coeffi cients can be analyzed if multiple measures of the variables are used. In this study, it was possible to observe consistency in fi nd-ings using “perception of corruption” and “generalized trust” suggesting that the relationship studied follows the described causal pathways.
The use of ecological variables only allows us to infer results at a national level, and one must avoid drawing conclusions at lower aggregation levels as they may represent a cross-level fallacy. Moreover, it is important to recognize that the measurement of social determinants as used in our study is controversial. The multidimensionality of social constructs, where the choice of a proxy allows for the identifi cation of some results, could conceal other relationships.22 In this sense
our results should be regarded as exploratory of non-hegemonic models.
Two previous studies on the causal pathways between income inequality and human health concluded the contrary of our fi ndings. These studies undertaken in the US11,14 used states as a unit of analysis and thus
only permit comparisons within this country, which suggests that fi ndings depend on the level of aggrega-tion and possibly the level of economic development. This is consistent with a systematic review where social capital tends to have more impact in intra-country levels of aggregation than within countries.12 However,
evidence from foraging-farming Tsimane societies in the Bolivian Amazon indicates that income inequality
acts on health through other paths besides social capi-tal.10 This suggests that populations from non-Western
societies could have other causal ways between social determinants and health outcomes. For this reason, generalizations based only on evidence obtained in developed countries could bias results.
Our study includes a great variety of countries with varying levels of economic development, allowing differences between countries to be observed. Thus, the determinants of health conditions vary according to the level of aggregation, a fi nding which is not discrepant, since the causes of illness in an individual are not always the same as those affecting incidence among the general population.19 We exploredthrough
stratification whether there were different causal pathways among countries with high or low economic development (measured by gross domestic product per capita adjusted for purchasing power parity). However, with the reduced sample size, it was not possible to fi nd statistically signifi cant results.
Our fi ndings suggest that the “class/welfare regime model” is useful for understanding the inequalities which exist when comparing nations. The “hypothesis of income inequality” only partially explains health discrepancies and does not indicate reasons for income inequality or social capital. It is important to remember that recent studies on income inequality and health include some (potentially confounding) variables, because an important discussion about the associations between income inequality, social capital and health could be considered spurious.
According to other authors, these “fundamental causes” are possibly related to the ideas and policies of global capitalism,15 which tend to reinforce multinational
markets in developed countries, where subsidies for agriculture and industry are provided at the cost of devel-oping countries which remain unprotected. This problem was addressed in the G8 summit, 2005, which resulted in the formulation of the Millennium Development Goals. Studies of developing countries or regions with high income inequality may demonstrate varying results. Thus, a general causal theory would be better understood if it were to incorporate all levels of income inequality and the determinants of these social inequalities. The results presented here justify policies which result in a better distribution of income as a prerequisite for the improvement of social capital among the popula-tion. Thus the consequence is that life expectancy will increase by actions on both determinants. Results of studies on the impact of income inequality on health are strong, consistent, statistically significant and non-artifactual,3 while studies on social capital are
1. Alesina A, Easterly W, Kurlat S, Wacziarg R.
Fractionalization. J Econ Growth. 2003;8(2):155-94.
DOI:10.1023/A:1024471506938
2. Arriaga EE. Measuring and explaining the change in
life expectancies. Demography. 1984;21(1):83-96.
DOI:10.2307/2061029
3. Babones SJ. Income inequality and population
health: correlation and causality. Soc Sci
Med. 2008;66(7):1614-26. DOI:10.1016/j.
socscimed.2007.12.012
4. Baum FE, Ziersch AM. Social capital. J Epidemiol
Community Health. 2003;57(5):320-3. DOI:10.1136/ jech.57.5.320
5. Bjørnskov C. The happy few. Cross-country evidence
on social capital and life satisfaction. Kyklos.
2003;56(1):3-16. DOI:10.1111/1467-6435.00207
6. Bjørnskov C. The multiple facets of social capital. Eur J Pol Econ. 2006;22(1):22-40. DOI:10.1016/j. ejpoleco.2005.05.006
7. Coburn D. Beyond the income inequality hypothesis:
class, neo-liberalism, and health inequalities. Soc
Sci Med. 2004;58(1):41-56. DOI:10.1016/S0277-9536(03)00159-X
8. Della Porta D. Social capital, beliefs in government, and political corruption. In: Pharr SJ, Putnam RD, editors Disaffected democracies: What’s troubling the trilateral countries? Princeton: Princeton University Press; 2000. p.202-8.
9. Franco A, Alvarez-Dardet C, Ruiz MT. Effect of democracy on health: ecological study.
BMJ. 2004;329(7480):1421-3. DOI:10.1136/
bmj.329.7480.1421
10. Godoy RA, Reyes-Garcia V, McDade T, Huanca T, Leonard WR, Tanner S, Vadez V. Does village inequality in modern income harm the psyche? Anger, fear, sadness, and alcohol consumption in a
pre-industrial society. Soc Sci Med. 2006;63(2):359-72.
DOI:10.1016/j.socscimed.2006.01.021
11. Gold R, Kennedy B, Connell F, Kawachi I. Teen births, income inequality, and social capital: developing
an understanding of the causal pathway. Health
Place. 2002;8(2):77-83. DOI:10.1016/S1353-8292(01)00027-2
12. Islam MK, Merlo J, Kawachi I, Lindström M, Gerdtham UG. Social capital and health: does egalitarianism
matter? A literature review. Int J Equity Health.
2006;5:3. DOI:10.1186/1475-9276-5-3
13. Jen MH, Jones K, Johnston R. Global variations in health: evaluating Wilkinson’s income inequality
hypothesis using the World Values Survey. Soc
Sci Med. 2009;68(4):643-53. DOI:10.1016/j. socscimed.2008.11.026
14. Kawachi I, Kennedy BP, Lochner K, Prothrow-Stith D.
Social capital, income inequality, and mortality. Am
J Public Health. 1997;87(9):1491-8. DOI:10.2105/ AJPH.87.9.1491
15. Muntaner C, Lynch J. Income inequality, social cohesion, and class relations: a critique of Wilkinson’s
neo-Durkheimian research program. Int J Health Serv.
1999;29(1):59-81. DOI:10.2190/G8QW-TT09-67PL-QTNC
16. Narayan D, Cassidy MF. A dimensional approach to measuring social capital: development and validation of a social capital
inventory. Curr Sociol. 2001;49(2):59-105.
DOI:10.1177/0011392101049002006
17. Putnam RD. Bowling alone: America’s declining social
capital. J Democr. 1995;6(1):65-78. DOI:10.1353/
jod.1995.0002
18. Ram R. Further examination of the cross-country association between income inequality and
population health. Soc Sci Med. 2006;62(3):779-91.
DOI:10.1016/j.socscimed.2005.06.034
19. Rose G. Sick individuals and sick populations. Int J
Epidemiol. 1985;14(1):32-8. DOI:10.1093/ije/14.1.32
20. Treisman D. The causes of corruption: a
cross-national study. J Public Econ. 2000;76(3):399-457.
DOI:10.1016/S0047-2727(99)00092-4
21. Wilkinson RG, Pickett KE. Income inequality and population health: a review and explanation of
the evidence. Soc Sci Med. 2006;62(7):1768-84.
DOI:10.1016/j.socscimed.2005.08.036
22. Ziersch AM, Baum FE, MacDougall C, Putland C. Neighbourhood life and social capital: the implications
for health. Soc Sci Med. 2005;60(1):71-86.
DOI:10.1016/j.socscimed.2004.04.027
REFERENCES
health conditions to the population,15 and upholds the
increasingly evident need to remedy poor distribution of income and its causes. Future studies might explore other “fundamental causes” of social inequality and