.
Vegetation structure, carbon sequestration potential and species
conservation in four agroforestry systems in Cameroon (Tropical Africa)
Valery Noiha Noumi
1*
, Victor Awe Djongmo
1, Boris Nyeck
1, Roger Bruno Tabue Mbobda
2,3and Louis Zapfack
2Received: July 29, 2017 Accepted: November 29, 2017
ABSTRACT
As the rate of forest degradation continues to rise, agroforestry may serve as a way of conserving species and carbon sinks. Th e aim of this study was to assess agrobiodiversity and carbon sequestration potential in agrosystems in Cameroon. Th ree age groups of agrosystems were studied. Data were collected in 100x50 m2 quadrates. Density
ranged from 53.17±0.08 to 1463±50.11; basal area from 2.07±0.00 to 988.39±16.13 m2/ha; Shannon diversity
from 3.3±0.71 to 3.68±0.72; Carbon storage from 12.1±0.27 to 54.65±1.38 t C/ha for 1-10-year-old agrosystems with lowest values in neem; 34.78±0.87 to 71.34±1.6 t C/ha for 10-20-year-old stands with lowest values in cashew; 28.24±0.04 to 108.51±2.46 t C/ha for +20-year-old stands with highest values in eucalyptus; Carbon sequestration potential from 296.7±1.98 to 859.33±10.01 t CO2eq/ha. Th e highest carbon stocks were found in eucalyptus stands (p<0.05). Several endogenous species, especially Afzelia bipindensis (EN), Leptoderris ledermannii (EN), Mansonia altissima (EN), Entandrophragma cylindricum (VU), Nesogordonia papaverifera (VU), Quassia sanguinea (VU), Vitellaria paradoxa (VU), Afzelia africana (VU), Erythrina senegalensis (LC), Detarium microcarpum (LC), senna spectabilis (LC), were assessed. Other overexploited species, especially Carissa edulis, Zanthoxylum zanthoxyloides, Adansonia digitata, Securidaca longepedonculata, were assessed as well. Th e studied systems are signifi cant CO2eq sinks and refuge centre for agrobiodiversity.
Keywords: agrosystems, conservation, CDM, IUCN, sinks
1 Laboratory of Biodiversity and Sustainable Development, Department of Biological Sciences, Faculty of Science, University of Ngaoundere, P.O. Box 454, Ngaoundere, Cameroon
2 Department of Plant Biology, Faculty of Science, University of Yaounde I, P.O. Box 812, Yaounde, Cameroon
3 Ministry of Forestry and Wildlife/Dja Biosphere Reserve, P.O. Box 34430,Yaoundé, Cameroon
* Corresponding author:[email protected]; [email protected]
Introduction
From the clauses agreed at CoP21 and CoP22, agrosystems can off er palliative solutions to the detrimental eff ects resulting from the deterioration of the climate system. As part of the fi ght against climate change through mitigation of greenhouse gas (GHG) emissions, many African countries, and particularly Cameroon, have signed and ratifi ed treaties and conventions. Th ese countries have also validated their REDD+ preparation document through the Forest Carbon Partners Facility (FCPF) Participants Committee.
REDD is not always limited to emissions that occur from the increase and decrease of carbon stocks in forests.
Some proposals indicate that REDD should be integrated into a broader approach that includes the use of other lands. Also, in order to optimize the fi ght against climate change, the northern industrial countries should invest in the Clean Development Mechanism (CDM) projects put up by southern countries. Th ese projects aim at reducing emission of CO2, which in turn implies reception of “carbon credits” by southern countries. A link between REED and CDM could exist given that forest plantations reduce pressure on the forest resource. We have associated CDM sequestration component of CO2eq and REDD+.
carbon stocks in agrosystems in Africa (Sonwa et al. 2001; 2007; Zapfack et al. 2002; 2013; 2016; Saint-André et al. 2005; Ngueguim et al. 2009; Adamou 2010; Mapongmetsem et al. 2011; Mohamed et al. 2011; Kemeuze et al. 2015; Manfo et al. 2015; Noiha et al. 2015a; b; 2017; Djongmo 2016; Jiagho et al. 2016; Hamadou 2016; Ngossomo 2016; Witanou 2016); the latter, carried out in the various agroforests existing in Africa, describe these systems very little, and very few of these studies present a comparative study of the sequestration potential of these artificial ecological systems among themselves. At this time when natural ecosystems are disappearing at an alarming rate, it is clearly necessary today to outline the carbon sequestration potential of agrosystems; so that, their compensatory role in the mitigation process of Climate change be made known. The atmospheric CO2 concentration has increased to 31% since 1750. This increase which is due to fossil fuel combustion and land use change which necessitates an identification of strategies to mitigate the threat of global warming. Deforestation, biomass burning, conversion of natural to agricultural ecosystems, drainage of wetlands and soil cultivation are the principal causes of greenhouse gas emissions (Lal 2004). Several works have showed the role of agroforestry systems as an opportunity to reduce CO2 concentrations in the atmosphere by increasing carbon (C) stocks in agricultural lands (Zapfack et al. 2002; 2013; 2016; Albrecht & Kandji 2003; Oelbermann et al. 2005; Saint-André et al. 2005; Lufafa et al. 2008; Takimoto et al. 2008; Singh & Lodhiyal 2009; Torres et al. 2010; Kumar et al. 2011; Hergoualc’h et al. 2012; Kuyah et al. 2012; Thangata & Hildebrand 2012; Somarriba et al. 2013; Kemeuze et al. 2015; Manfo et al. 2015; Jiagho et al. 2016; Noiha et al. 2017).
Afforestation might be a measure to balance emissions from naturel ecosystem degradation. Re-planted areas could probably be true carbon sinks and refuge centres for endogenic species which are threatened by the anarchical exploitation of natural ecosystems. With these hypotheses in mind, the present study was carried out with the main goal to assess and compare both agrobiodiversity and C sequestration potential in four agroforestry systems in Cameroon.
Materials and methods
Study site
This study was carried out in Central Africa principally in Cameroon. The choice of the site was based on the availability of agroforestry systems in Cameroon. The main criterion of agrosystems selection was based on predominance; in the Far North region, agroforests based on Azadirachta indica (neem) were predominant, in the north region, those
with Anacardium occidentale (cashew) were abundant, and the stands of Eucalyptus spp. were predominant in the Adamawa region. In the southern part of the country we selected cocoa stands (Fig. 1). The ages of the stands were taken into account in the choice to predict the evolution of the amount of carbon stored. So, the stands were then subdivided into three age groups each: ]0-10[; [10-20[ and ≥ 20 years.
Data collection
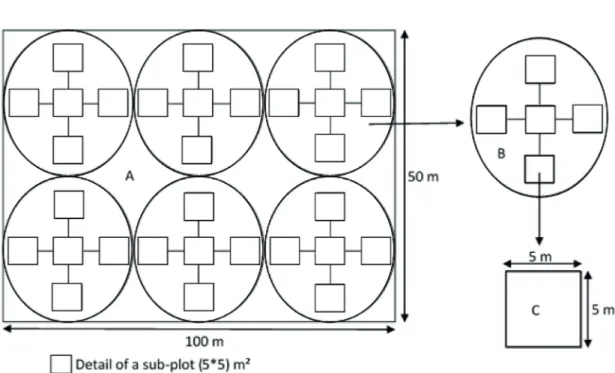
For each stand of the chosen agroecosystems, three types of land covers were selected according to the age of the stands. Each agroforest stand was 0-10 years old; 10-20 years and over 20 years. Community sampling units were established to enumerate and identify floristic composition. For each agroforestry system areas, three sites were selected (three times replicated for each site) to establish four 100 × 50 m sampling plots of three stages (0-10, 10-20 and 20+ year old) respectively (Fig. 2). This methodology was similar to that of Du et al. (2015) even though they established nine 20 x 50 m sampling plots of five stages. The survey area was 2 ha per site. Several blocks or squares (quadrates) with definite size (5 x 5 m²) were established in the stands and savannah to identify total number of timbers (Some trees were identified directly in the field using monograph; for other trees, specimens were collected and compared to those available in the National herbarium of Cameroon). The Spatial data layers contours (altitude, slope and aspect) and vegetation types were extracted from topo sheet. Suunto Hypsometer was used for measuring the height of the trees. Likewise, for measuring diameter and circumferences, instruments like Caliper, Finnish Caliper and measuring tape were employed for all woody species (dbh≥2 cm). GPS and compass were used to install and locate stands. The diameter was measured at 1.30 m aboveground for trees and at 0.30 m and 0.50 m for shrublets and shrubs respectively.
Data analysis
Figure 1. Sites localization.
Stand diversity and structure
The analysis of the stand diversity has focused on: 1. The diversity of Shannon (ISH) index (Frontier & Pichod-Viale 1992):
2 ISH= - niLog ni
N N
∑
with ni= number of the species i, N = number of all species; ISH is expressed in bit. 2. The equitability of Piélou (1966)
EQ .3
2
= ISH
Log N. 3. Coefficient of similarity of Sorensen (K) (1948)
apud Ngueguim et al. 2009: K= 2 100, +
c x
a b with a = number of species of the statement 1, b = number of species of the statement 2, c = number of species common to the two statements. 4. Index of Ecological Importance (IVI) (Curtis & Macintosh (1950) apud Adjonou et al. 2010). IVI= relative Dominance (species) + relative Density (species) + relative Frequency (species). 5. Density (D): This is the number of individuals per ha. In the plots, the density (D) is calculated based on the formula: D=n
S ; D: density (trees/ha), n: number of trees present on the considered surface and S: reporting surface (ha). 6. Basal Area (BA): This allows presenting in m²/ha the surface of each species at 1.30 m (dbh); the formula:
2 2
i i
1 1
1
BA
d
C
4
4
π
π
= =
=
∑
n=
∑
ni i
with BA: basal area (m²/ha), d: diameter (m), C: (m) circumference. 7. Size-class distribution: to catch the diametric structure in the understories of the eucalyptus stands, timbers were grouped in class of diameters with amplitude of 10 cm. Thereby, the aspect of the evolution of species in the understories was forecasted through a histogram of distribution.
Carbon stocks assessment
Aboveground biomass (AGB) of woody species was evaluated according to the allometric equation developed by Brown et al. (1997) for dry tropical climates: AGB=e[-1.996+2.32*ln(DBH)]; with AGB: aboveground biomass (kg),
DBH: diameters at breast height (cm) for Far north and north stands. In Adamawa and Center sites, we used the allometric model of Chave et al. (2005): Aboveground biomass (AGB): AGB= αe[-1.499 + 2.148*ln(DBH) + 0.207*(ln(DBH)2 – 0.0281*(ln(DBH))3]; where α is
the specific density of woody species. From these biomasses, the amount of carbon (Kg/ha) is obtained by multiplying biomasses by a conversion factor of 0.47.
Belowground biomass (BGB) was extrapolated from AGB according to the allometric equation developed by Cairns et al. (1997): BGB =e[-1.0587+0.8836*ln (AGB)].
Total carbon: TB = AGB + BGB (FAO 2011); with TB: total biomass (kg); AGB: aboveground biomass and BGB: belowground biomass.
Sequestration potential assessment
The total stock of carbon estimated in t/ha was converted into equivalent amount of CO2eq absorbed using the ratio 44/12 corresponding to the CO2eq/C report. This value was subsequently evaluated in monetary value using the ecological service value estimated at 10 USD/t CO2eq (Ecosystems Marketplace 2016).
Conservation state: an overview of species
conservation in the studied stands
To be able to assess the conservation status of all recorded species, we did a literature review and checked the red data list of the species catalogued by the IUCN through the link: www.iucnredlist.org/search.
Results
Floristic structure
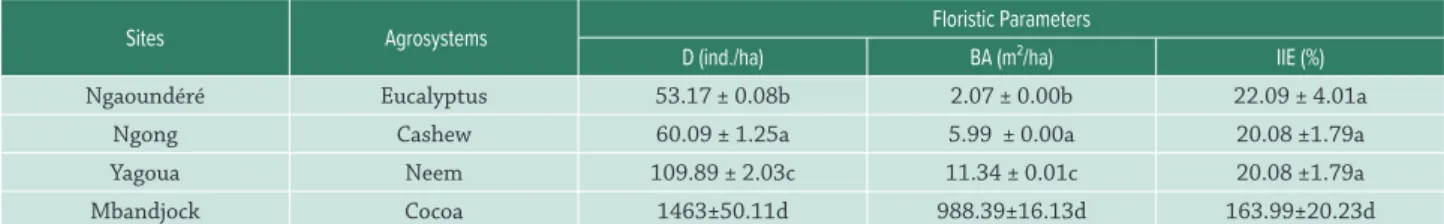
There were significant differences in density and basal area amongst the selected sites (p<0.05). Density ranged from 53.17±0.08 to 1463±50.11 timbers/ha. Basal area ranged from 2.07±0.00 to 988.39±16.13 m2/ha. For each
of these parameters, the most important values were found in neem stands (Tab. 1).
There was no significant difference in plant diversity amongst the sites and therefore amongst the selected
Table I. Floristic parameters amongst the studied agrosystems.
Sites Agrosystems Floristic Parameters
D (ind./ha) BA (m²/ha) IIE (%)
Ngaoundéré Eucalyptus 53.17 ± 0.08b 2.07 ± 0.00b 22.09 ± 4.01a
Ngong Cashew 60.09 ± 1.25a 5.99 ± 0.00a 20.08 ±1.79a
Yagoua Neem 109.89 ± 2.03c 11.34 ± 0.01c 20.08 ±1.79a
Mbandjock Cocoa 1463±50.11d 988.39±16.13d 163.99±20.23d
Table II. Floristic diversity amongst the studied agrosystems.
Sites Agrosystems Species richness ISH EQ
Ngaoundéré Eucalyptus 42 ± 1.58b 3.57 ± 0.29a 0.99 ± 0.3a
Ngong Cashew 44 ± 1.25a 3.60 ± 0.70a 1 ± 0.1a
Yagoua Neem 39 ± 0.95c 3.3 ± 0.71a 1 ± 0.1a
Mbandjock Cocoa 46±0.91d 3.68±0.72a 0.98±0.1a
Notes: In the same column, values affected with the same letter are not statistically different. ISH: Shannon index; EQ: Piélou evenness
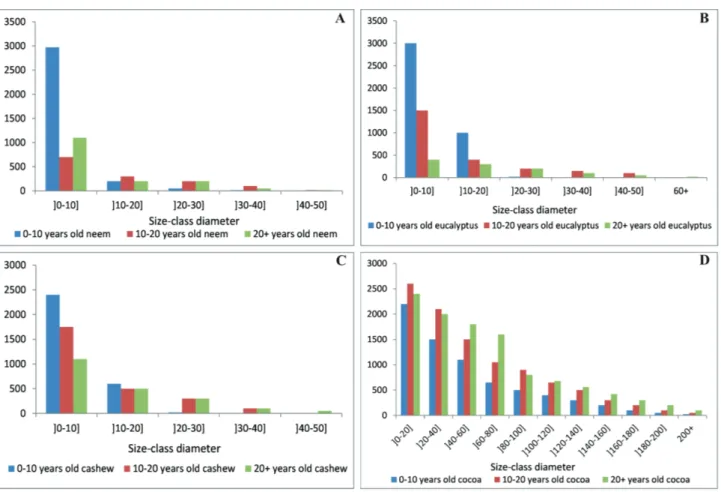
Figure 3. Size-classed diameter distribution. A. Neem stand; B. Eucalyptus stand; C. cashew stand; D. Cocoa stand. Please see PDF version for color reference
agrosystems (p>0.05) (EQ of the order of 1 in Tab. 2); Shannon index ranged from 3.3±0.71 to 3.68±0.72.
Sorensen’s coefficients of floristic similarities amongst the northern sites were generally high (>50).
From the analysis, each stand exhibits a classic exponential decay distribution (of Sharp “L” or “J” if inverted). This exponential decay reflects the predominance of individuals with small diameters (Fig. 3). This structure shows that, there is a strong regeneration of the undergrowth of the stands by the presence of several individuals with a small diameter (<10 cm). This is the main characteristic of forest stands assumed to be in equilibrium, with many small-diameter individuals and few large-small-diameter individuals.
Factor analysis of correspondence (CFA) of carbon stock amongst species in different types of the studied plots showed a 99.88% correlation along the F1 and F2 axis
Carbon storage and sequestration potential
For the same age groups, there was a significant difference amongst the agrosystems studied both in the above and belowground stocks (p=0.0000). Eucalyptus stands of all age groups stored more carbon compared to other systems (Tab. 3).
The sequestration potential varied significantly among the stands (p<0.05). CO2 sequestration was more important
in eucalyptus stands (Tab. 3).
Density and basal area affected carbon stocks. For each considered parameter, the Pearson’s coefficient was very strong (r>0.5); indicating an influence of the number of species and density on the carbon sequestration potential (Tab. 4). This correlation, as can be seen, was more significant with the basal area (r=0.987; p<0.0001) being proportional to the breast height diameter (dbh) which is an important factor in the biomass stock.
The number of individuals per hectare can influence biomass by a summation effect; this explains the significant correlation observed in the number of species and density (p<0.0001).
Furthermore, the Economic value was correlated with aboveground carbon (r=0.697; p<0.0001). A significant correlation equal to the threshold of 0.5 was found between
the economic value and the belowground stocks (r=0.594; p<0.0001). Also, a strong and significant correlation between economic value and total carbon stocks (r=0.901; p<0.0001) was found, which showed that these different plantations are large reservoirs of carbon (Tab. 5).
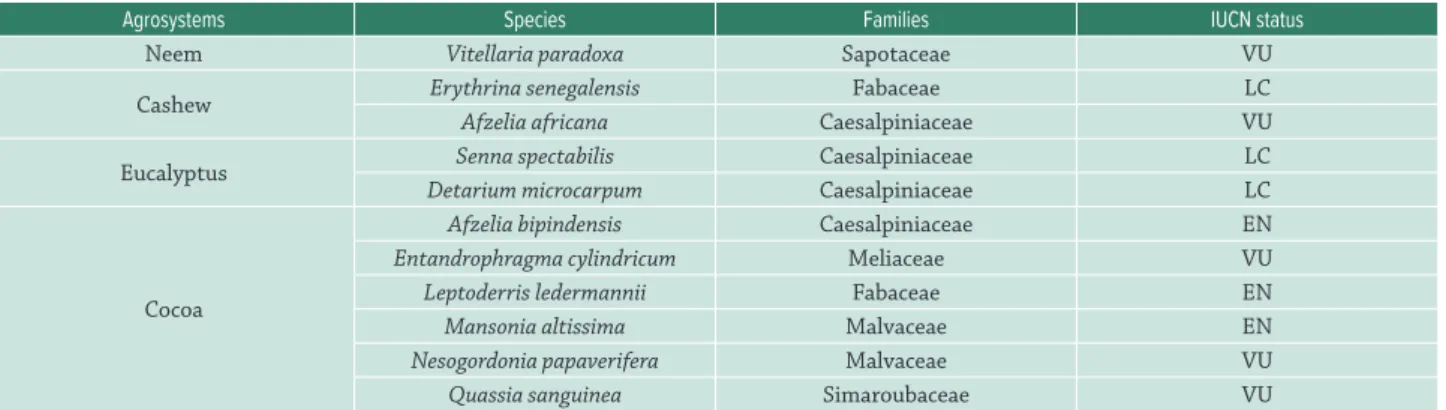
Overview for the biodiversity conservation
Floristic diversity in each agrosystem was assessed and the list was compared with that of IUCN catalogued species. Among the species listed in the understory, some have IUCN status (see www.iucnredlist.org/search; Tab. 6). Many other species from the IUCN catalogue with no status were assessed; Carissa edulis, Zanthoxylum zanthoxyloides, Adansonia digitata, and Securidaca longepedoncula.
Discussion
The Shannon diversity of understory which has the value of 3 in each agrosystem indicated the presence of pre-existing savannah species in the stands of the studied systems and these associated species were equitably and homogeneously distributed. Based on the axis of symmetry, the species were grouped into four. This cloud observed
Table V.Comparison of sequestration potential amongst the studied agrosystems
Sites Agrosystems Total Carbon (t/ha) QCO2eq (t/ha) VE (Dollars)
Ngong Cashew 89.31 327.47 ± 2.07b 3274.70 ± 79.80b
Ngaoundéré Eucalyptus 234.36 859.33 ± 10.01a 8593.30 ± 189.00a
Yagoua Neem 80.92 296.70 ± 1.98c 2967.00 ± 50.67c
Mbandjock Cocoa 147.23 539.87 ± 8.01d 5398.70 ± 210.00d
Notes: In the same column, values affected with the same letter are not statistically different. QCO2eq: sequestration potential; VE: economic value.
Table VI.Catalogued species of the IUCN red data list in the agrosystems’ understory.
Agrosystems Species Families IUCN status
Neem Vitellaria paradoxa Sapotaceae VU
Cashew Erythrina senegalensis Fabaceae LC
Afzelia africana Caesalpiniaceae VU
Eucalyptus Senna spectabilis Caesalpiniaceae LC
Detarium microcarpum Caesalpiniaceae LC
Cocoa
Afzelia bipindensis Caesalpiniaceae EN
Entandrophragma cylindricum Meliaceae VU
Leptoderris ledermannii Fabaceae EN
Mansonia altissima Malvaceae EN
Nesogordonia papaverifera Malvaceae VU
Quassia sanguinea Simaroubaceae VU
Note: EN, En danger; VU, vulnerable; LC, least concern.
Table III.Comparison of stocks in respect to stands and age.
Age of Stands Parcels Sites Parameters
AGB (t/ha) BGB (t/ha) Total carbon (t/ha)
≤10
Cashew Ngong 11.41 ± 0.01b 3.10 ± 0.00b 14.51 ± 0.11b
Neem Yagoua 10.20 ± 0.03a 1.90 ± 0.01a 12.10 ±0.27a
Eucalyptus Ngaoundéré 44.69 ± 0.98c 9.96 ± 0.08c 54.65 ± 1.38c
Cocoa Mbandjock 11.13 ± 0.11d 2.67±0.13d 13.80±0.13d
10-20
Cashew Ngong 28.29 ± 0.28b 6.49±0.00b 34.78 ± 0.87b
Neem Yagoua 31.90 ± 1.59a 8.69 ±0.00a 40.58 ± 1.98a
Eucalyptus Ngaoundéré 58.67 ± 1.02c 12.67±0.13c 71.34 ± 1.60c
Cocoa Mbandjock 44.24 ± 0.07d 10.61±0.02d 54.86±0.09a
>20
Cashew Ngong 32.56 ± 0.52b 7.46 ±0.09b 40.02 ± 0.09b
Neem Yagoua 23.94 ± 0.72a 4.30 ± 0.04a 28.24 ± 0.04a
Eucalyptus Ngaoundéré 90.02 ± 3.51c 18.49 ±0.19c 108.51 ± 2.46c
Cocoa Mbandjock 63.25 ± 0.06d 15.18±0.01d 78.43±0.07d
Notes: In the same column, values affected with the same letter are not statistically different. AGB: aboveground biomass; BGB: belowground biomass.
Table IV.Relationship amongst carbon reservoir, species richness, density and basal area.
Parameters Coefficient of Pearson’s correlation (r)
AGB BGB Total Carbon
Species richness 0.701 0.697 0.798
(p < 0.0001) (p < 0.0001) (p < 0.0001)
Density 0.611 0.799 0.569
(p = 0.0000) (p < 0.0001) (p = 0.0000)
Basal area 0.895 0.754 0.987
(p < 0.0001) (p < 0.0001) (p < 0.0001)
Note: AGB: aboveground biomass; BGB: belowground biomass.
in figure 4 means that the correlation between carbon stocks and economic value was very high. There was equally a significant variation of the C sequestration potential among the stands (p<0.05). CO2 sequestration was higher in eucalyptus stands. Density and basal area affected
the size-classed diameter distribution as shown in the figure 3 showed that the largest diameters in the neem stands do not exceed 50 cm and the same is true in cashew stands where individuals rarely reach 50 cm. However, in eucalyptus stands, individuals may exceed 110 cm. These observations are in agreement with the works of Zapfack et al. (2016) and Noiha et al. (2017) in the Lobéké National Park in southeastern Cameroon and in the cashew of Ngong in northern Cameroon respectively.
The largest value of aboveground carbon found in the cashew stand of over 20 years (32.56 ± 0.31 t/ha) was greater than the 21.73 t/ha from the work of Thiombiano (2010) in the cashew plantations of 22 years in Burkina Faso. This difference is likely related to the methodology of counting, but it could mainly be due to the variability of the density of the understory, which depends on the level of maturity of the cashew plantations. The stock of aboveground carbon from the control (Savannah, 10.71 ± 0.14 t/ha) did not corroborate the work of Tchobsala et al. (2016) in two shrubby savannah of Ngaoundéré (Cameroon) with respectively 40.89 ± 1.09 t/ha and 45.03 ± 1.22 t/ha in aboveground carbon. This difference could be as a result of the strong anthropogenic pressure in the control. These data were as important as those from the work carried out in Tanzania in some agroecosystems such as parklands, homegardens and woodlot (Singh & Lodhiyal 2009; Fonseca et al. 2011; Chavan & Rasal 2012).
Stocks of carbon in neem plantations of 0-10 years (12.10 t C/ha); 10-20 years (40.58 t C/ha) and more than 20 years (28.24 t C/ha) were higher than those obtained by Kanmegne (2004) in the dense rainforests of southern Cameroon (5.31 t C/ha; 6.11 t C/ha and 5.03 t C/ha respectively in primary forest, in banana plantations and old fallows). In the Savannah, carbon stocks (13.68 t C/ha) were higher than those of Mosango (1991) in the Democratic Republic of Congo (6.63 t C/ha).
Aboveground carbon in eucalyptus varied from 10.78 t C/ha to 90.02 t C/ha. In total, 204.16 t C/ha was estimated; this was higher than 57.34 t C/ha from young secondary forests of Congo, 89.31 t C/ha in cashew stands from north Cameroon and 186.92 t C/ha of degraded secondary forests of Cameroon Center region (Noiha et al. 2017; Mosango 1991; Zapfack 2005). This amount of carbon storage was far superior compared to those assessed in several cocoa agrosystems (Zapfack et al. 2016; Ngossomo 2016). The average aboveground carbon stocks in the old Eucalyptus stands (26.27 ± 0.13 t C/ha), medium Eucalyptus stands (16.47 ± 0.19 t C/ha), young Eucalyptus stands (11.3 ± 0.088 t C/ha) and Savannah (3.03 ± 0.015 t C / ha) were higher than those of Kanmegne (2004) in the moist forests of Southern Cameroon (5.31 t C/ha; 6.11 t C/ha and 5.03 t C/ha respectively in primary forest, banana plantation and old fallow).
The C sequestration potential was higher in eucalyptus stands (398.25 t CO2eq/ha) than in the savannah (50.05 t
CO2eq/ha). In total 956.82 t CO2eq/ha were sequestered for an economic value of $9,568.45/ha against 50.05 t CO2eq/ha corresponding to $500.56/ha in the Savannah. Eucalyptus stands are considered as carbon sinks which could be an opportunity for financial benefits in the event of payment for environmental services in the context of the CDM.
One of the central questions of conservation is the fate of endogenous species when ecosystems are being manipulated by activities such as deforestation and permanent degradation at an alarming rate. In the Sudano-Sahelian zone of Cameroon, where the climate is severe, agroforests are installed on bare and often degraded areas. An inventory of the undergrowth of the assessed stands revealed an apparent presence of the species of the preexisting ecosystems which find refuge in these stands. Of the 7850 plant species that make up Cameroon’s floristic wealth, 815 of them (10.38%) are threatened of extinction which have long term effect on the global climate. This alarm sprouted from research jointly conducted by the Agricultural Research Institute for Development (ARID) and the Royal Botanical Garden of London, England. This study named Red Data Plan Cameroon, denounces among other factors the cause of this potential disaster, the destruction of habitats due to human activities (urbanization, agriculture, etc.), natural disasters and climate change. From our results, agroforest stands typically provide shelter to endogenous species which are already threatened by anthropogenic pressures on natural ecosystems.
Conclusion
Carbon sequestration in agroforestry systems plays an important role in climate change regulation. Also, agroforestry is one of the most effective ways of reducing poverty and forest degradation. It is a systematic planting of trees together with crops with the aim of providing both long- and short-term benefits to local populations, and to enhance the carbon storage capacity for the environmental stability. In systems of more than 20 years, the potential of sequestration was comparable to that of some dense wet forests of tropical Africa. It is said that, a well-maintained system can offer both short and long-term of the important ecosystem services. The agrosystems are true carbon sinks on the one hand and a place of refuge for the endogenous species endangered by human actions on the other hand. To sum up, having seen the role agroforestry has played both biologically and socially, agroforestry can be typical centres for biodiversity conservation.
Acknowledgements
We also thank colleagues whose contributions were very important for the improvement of this manuscript. We equally render immense thanks to Yamseh Nganjo Odette for her presence which contributed highly to the quality amelioration of this document.
References
Adamou MB. 2010. Biodiversité et séquestration du carbone dans les cacaoyères à la périphérie ouest du parc national de Lobéké. MSc Thesis, Université de Yaoundé, Yaoundé.
Adjonou K, Djiwa O, Kombate Y, Kokutse AD, Kokou K. 2010. Etude de la dynamique spatiale et structure des forêts denses sèches reliques du Togo: implications pour une gestion durable des aires protégées. International Journal of Biological and Chemical Sciences 4: 168-183. Albrecht A, Serigne TK. 2003. Carbon sequestration in tropical agroforestry
systems. Agriculture, Ecosystems & Environment 99: 15-27. Brown S, Gilespie AJR, Lugo AE. 1997. Biomass estimation methods
for tropical forest with application to forest inventory data. Forest Science 35: 881-902.
Cairns MA, Brown S, Helmer EH, Baumgardner GA. 1997. Root biomass allocation in the world’s upland forests. Oecologia 111: 1-11. Chavan BL, Rasal GB. 2012. Carbon sequestration potential of young A
reticulate and Annona squamosa from University campus of Aurangabad. International Journal of Physical and Social Sciences 2: 193-198. Chave J, Andalo C, Brown S, et al. 2005. Tree allometry and improved
estimation of carbon stocks and balance in tropical forests. Oecologia 145: 87- 99.
Djongmo VA. 2016. Diversité floristique et stocks de carbone dans les agrosystèmes à Anacardium occidentale (Anacardiaceae) du domaine soudano-sahélien. MSc Thesis, Université de Ngaoundéré, Ngaoundéré. Ecosystems Marketplace. 2016. State of the voluntary carbon market.
New York, Forest Trends’ Ecosystem Marketplace. FAO 2011. State of the world’s forests. Rome, FAO.
Fonseca W, Alice FE, Rey-Benayas JM. 2011. Carbon accumulation in aboveground and belowground biomass and soil of different age native forest plantations in the humid tropical lowlands of Costa Rica. New Forests 43: 197-211.
Frontier S, Pichod-Viale D. 1992. Ecosystème: structure, fonctionnement, évolution. Paris, Masson.
Hamadou RM. 2016. Diversité floristique et stocks de carbone dans les agrosystèmes à Eucalyptussaligna (Myrtaceae) du domaine soudanien d’altitude. MSc Thesis, Université de Ngaoundéré, Ngaoundéré. Hergoualc’h K, Blanchart E, Skiba U, Hénault C, Harmand J-M. 2012.
Changes in carbon stock and greenhouse gas balance in a coffee (Coffea arabica) monoculture versus an agroforestry system with Inga
densiflora, in Costa Rica. Agriculture, Ecosystems & Environment
148: 102-110.
Du H, Zeng F, Peng W, et al. 2015. Carbon storage in a Eucalyptus plantation chronosequence in Southern China. Forests 6: 1763-1778. Jiagho ER, Zapfack L, Kabelong BRPL, Tsayem-Demaze M, Corbonnois J,
Tchawa P. 2016. Diversité de la flore ligneuse à la périphérie du Parc national de Waza (Cameroun). La Revue Electronique en Sciences de L’Environnement 6: 17200-17249.
Kanmegne J. 2004. Slash and burn agriculture in the humid forest zone of southern Cameroon: Soil quality dynamics, improved fallow, management and farmers’ perception. MSc Thesis, Wageningen University, Wageningen.
Kemeuze VA, Mapongmetsem PM, Sonwa D, Fongnzossie E, Nkongmeneck BA. 2015. Plant diversity and carbon stock in sacred groves of semi-arid areas of Cameroon: case study of Mandara mountains. International Journal of Environment 6: 308-318.
Kumar MB. 2011. Species richness and aboveground carbon stocks in the homegardens of central Kerala, India. Agriculture, Ecosystems & Environment 140: 430-440.
Kuyah S, Dietz J, Muthuri C, et al. 2012. Allometric equations for estimating biomass in agricultural landscapes: I. Aboveground biomass. Agriculture, Ecosystems & Environment 158: 216-224.
Lal R. 2004. Soil carbon sequestration to mitigate climate change. Geoderma 123: 1-22.
Lufafa AI, Diédhiou SAN, Samba M, et al. 2008. Carbon stocks and patterns in native shrub communities of Senegal’s Peanut Basin. Geoderma 146: 75-82.
Manfo DA, Tchindjang M, Youta HJ. 2015. Systèmes agroforestiers et conservation de la biodiversité dans un milieu fortement anthropisé: le cas d’Obala. Revue Scientifique et Technique Forêt et Environnement du Bassin du Congo 5: 22-34.
Mapongmetsem PM, Nkongmeneck BA., Rongoumi G, Nguemo D, Dongmo B. 2011. Impact des systèmes d’utilisation des terres sur la conservation de Vitellaria paradoxa dans les savannes
soudano-guinéennes. International Journal of Environmental Studies 68:
851-872.
Mohamed MC, Lô M, Bassène E, Akpo LE. 2011. Caractéristiques de la flore et de la végétation ligneuses des forêts communautaires de la zone soudano-sahélienne au Sénégal. Journal des Écologies et Technologies 9: 145-152.
Mosango M. 1991. Contribution à l’étude botanique et biogéochimique de l’écosystème forêt en région tropicale (île Kongolo, Zaïre). Belgian Journal of Botany 124 : 167-194.
Ngossomo JD. 2016. Diversité floristique et évaluation des stocks de carbone dans les agrosystèmes cacaoyers de la localité de Mbandjock (Région du Center). MSc Thesis, Université de Ngaoundéré, Ngaoundéré. Ngueguim JR, Zapfack L, Youmbi E, et al. 2009. Diversité floristique sous
canopée en plantation forestière de Mangombe-Edea (Cameroun). Biotechnologie, Agronomie, Société et Environnement 1: 167-176. Noiha NV, Zapfack L, Mbade LF. 2015a. Biodiversity management and plant
dynamic in a cocoa agroforêts (Cameroon). International Journal of Plant and Soil Science 6: 101-108.
Noiha NV, Zapfack L, Ngueguim JR, Tabue MRB, Ibrahima A, Mapongmetsem PM.2015b. Sequestered standing carbon stock in selective exploited timbers grown in tropical forest: a case study from the national park of Lobeke (Cameroon). Journal of Botanical Sciences 4: 19-24.
Noiha NV,Zapfack L, Awe DV, et al. 2017. Floristic structure and sequestration potential of cashew agroecosystems in Africa: a case study from Cameroon. Journal of Sustainable Forestry 36: 277-288. Oelbermann M, Voroney RP, Kass DCL, Schlönvoigt AM. 2005. Above and belowground carbon inputs in 19-, 10- and 4-year-old Costa Rican Alley cropping systems. Agriculture, Ecosystems & Environment 105: 163-172.
Piélou EC. 1966. The measurement of diversity in different types of biological collections. Journal of Theoretical Biology 13: 131-144. Saint-André L, MiBou AT, Mabiala A, et al. 2005. Age-related equations for
above- and below-ground biomass of a Eucalyptus hybrid in Congo. Forest Ecology and Management 205: 199-214.
Singh PR, Lodhiyal LS. 2009. Biomass and carbon allocation in 8-year-old poplar (Populus deltoides Marsh) plantation in Tarai agroforestry systems of Central Himalaya, India. New York Science Journal 2: 49-53.
Somarriba E, Cerda R, Orozco L, et al. 2013. Carbon stocks and cocoa yields in agroforestry systems of Central America. Agriculture, Ecosystems & Environment 173: 46-57.
Sonwa D, Weise SF, Tchatat M, et al. 2001. Rôle des agroforêts cacao dans la foresterie paysanne et communautaire au Sud-Cameroun. London, Réseau de Foresterie pour le Développement Rural.
Sonwa DJ, Nkongmeneck AB, Weise SF, Tchatat M, Adesina AA, Janssens JM. 2007. Diversity of plants in cocoa agro forests in humid forest zone of southern Cameroon. Biodiversity and Conservation 16: 2385-2400. Takimoto APK, Ramachandran N, Vimala DN. 2008. Carbon stock and sequestration potential of traditional and improved agroforestry systems in the West African Sahel. Agriculture, Ecosystems & Environment 125: 159-166.
Tchobsala MC, Dongock ND, Nyasiri J, Ibrahima A. 2016. Carbon storage of anthropoid’s vegetation on the Ngaoundéré escarpment (Adamawa, Cameroon). Journal of Advances in Biology 9: 1845-1854. Thangata PH, Hildebrand PE. 2012. Carbon stock and sequestration
deforestation and forest degradation’ (REDD+). Agriculture, Ecosystems & Environment 158: 172-183.
Thiombiano ST. 2010. Contribution à la facilitation de l’accès des petits producteurs d’anacarde aux crédits carbone au Burkina Faso. MSc Thesis, Institut International d’Ingénierie de l’Eau et de l’Environnement, Uagadugu.
Torres AB, Marchant R, Lovett JC, Smart JCR, Tipper R. 2010. Analysis of the carbon sequestration costs of afforestation and reforestation agroforestry practices and the use of cost curves to evaluate their potential for implementation of climate change mitigation. Ecological Economics 69: 469-477.
Witanou N. 2016. Diversité floristique et stocks de carbone dans les agrosystèmes à Azadirachta indica (Meliaceae) du domaine sahélien. MSc Thesis, Université de Ngaoundéré, Ngaoundéré.
Zapfack L. 2005. Impact de l’agriculture itinérante sur brûlis sur la biodiversité végétales et la séquestration du carbone. PhD Thesis, Université de Yaoundé, Yaoundé.
Zapfack L, Djomo CC, Noumi VN, Zekeng JC, Daghela GRM, Mbobda RBT. 2016. Correlation between associated trees, cocoa trees and carbon stocks potential in cocoa agroforests of Southern Cameroon. Sustainability in Environment 1: 71-84.
Zapfack L, Engwald S, Sonké B, Achoundong G, Madong BA. 2002. The impact of land conversion on plant biodiversity in the forest zone of Cameroon. Biodiversity and Conservation 11: 2047-2061. Zapfack L, Noumi VN, Kwouossu PJS, Zemagho L, Fomete NT. 2013.