ABSTRACT: Manual phenotyping for papaya Carica papaya (L) breeding purposes limits the evalu-ation of a great number of plants and hampers selection of superior genotypes. This study aimed to validate two methodologies for the phenotyping of morpho-agronomic plant traits using image analysis and fruit traits through image processing. In plants of the ‘THB’ variety and ‘UENF/ Caliman-01’ hybrid two images (A and B) were analyzed to estimate commercial and irregularly shaped fruits. Image A was also used in the estimation of plant height, stem diameter and the first fruit insertion height. In ‘THB’ fruits, largest and smallest diameters, length, and volume were estimated by using a caliper and image processing (IP). Volume was obtained by water column displacement (WCD) and by the expression of ellipsoid approximation (EA). Correlations above 0.85 between manual and image measurements were obtained for all traits. The aver-ages of the morpho-agronomic traits, estimated by using imaver-ages, were similar when compared to the averages measured manually. In addition, the errors of the proposed methodologies were low compared to manual phenotyping. Bland-Altman’s approach indicated agreement between the volume estimated by WCD and EA using caliper and IP. The strong association obtained between volume and fruit weight suggests the use of regression to estimate this trait. Thus, the expectation is that image-based phenotyping can be used to expand the experiments, thereby maintaining accuracy and providing greater genetic gains in the selection of superior genotypes. Keywords: Carica papaya, phenomics, digital image processing
Model-assisted phenotyping by digital images in papaya breeding program
Diego Fernando Marmolejo Cortes1*, Renato Santa Catarina1, Gislanne Brito de Araújo Barros1, Fernanda Abreu Santana Arêdes1, Silvaldo Felipe da Silveira2, Geraldo Antônio Ferreguetti3, Helaine Christine Cancela Ramos1, Alexandre Pio Viana1, Messias Gonzaga Pereira1
1State University of North Fluminense “Darcy Ribeiro” − Genetic and Plant Breeding Lab., Av. Alberto Lamego, 2000 − 28013-602 − Campos dos Goytacazes, RJ − Brazil. 2State University of North Fluminense “Darcy Ribeiro” − Entomology and Phytopathology Lab.
3Caliman AgrícolaSA, BR 101, km 111 − Linhares, ES − Brazil.
*Corresponding author <[email protected]>
Edited by: Roberto Fritsche Neto
Received April 04, 2016 Accepted July 25, 2016
Introduction
Although Brazil is the second largest producer of papaya Carica papaya (L) (FAO, 2015), there is still limited genetic variability in commercial plantations (Oliveira et al., 2010), making it necessary to increase the supply of cultivars through the selection of superior genotypes. This fruit tree has a relatively long reproductive cycle, in which repeated measurements must be taken on each individual under different environmental conditions. Therefore, the experiments required several replications, a large number of treatments, and rigor and precision in selecting methods. Currently, manual phenotyping for traits of interest entails intensive labor demands and is time consuming. Thus, manual phenotyping limits the assessment of large numbers of individuals, and may decrease experimental precision, reduce the chances of selecting superior genotypes as well as obtaining genetic gain (Rosher et al., 2014).
In order to improve the efficiency of phenotyp-ing for traits of interest, methodologies were developed based on analysis and image processing. It is expected that the application of these methodologies allows for high performance phenotyping in order to increase the number of assessed genotypes, improving the acquisi-tion and analysis of data and minimizing the experimen-tal error (Li et al., 2014; Roscher et al., 2014). A method-ology based on digital image analysis was validated by Ferreira et al. (2012) to measure plant height, stem base diameter and diameter at breast height in Australian red cedar (Toona ciliata). The authors obtained similar
aver-age results for measurements performed manually. Al-gorithms of digital image processing have been validated with a high degree of accuracy to estimate the number of commercial fruits in apple-tree (Aggelopoulou et al., 2011), mango (Payne et al., 2013) and vine (Roscher et al., 2014). Likewise, processing algorithms have been vali-dated to estimate length, diameter and volume of fruit in watermelon (Koc, 2007), orange (Khojastehnazhand et al., 2009) and cantaloupe (Rashidi et al., 2009). As a re-sult, this study aimed to validate two methodologies for the phenotyping of morpho-agronomic plant traits using image analysis and fruit traits through image processing.
Materials and Methods
Genetic material
The experiment was conducted in Linhares, in the state of Espírito Santo, Brazil (19º06’ and 19º18’ S, 39º45’ and 40º19’ W, altitude 30 m). One hundred and fifty plants of the ‘UENF/Caliman-01’ hybrid and 150 plants of the ‘THB’ variety were randomly selected from two commercial plots.
caliper, and was expressed in millimeters. The number of commercial fruits (NCF) and the number of irregular-ly shaped fruits (NDF) were also evaluated. In the fruit counting, only those with a defined format were con-sidered, and were marked as the last fruit evaluated to facilitate the digital counting. In this study, the pentan-dric, carpelloid and bananoid fruits were classified as ir-regularly shaped.
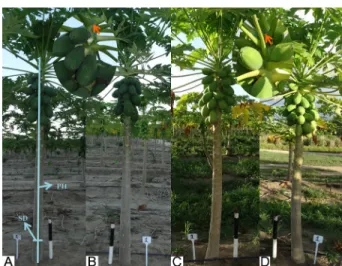
For digital phenotyping, a conventional camera was used. Each plant was photographed in two different positions, one of them perpendicular to the plant (Image A) (Figures 1A and C) considering the axis of the row, and the other one considering the opposite side of the same plant (Image B) used in image A (Figures 1B and D). The pictures were obtained by taking them at a dis-tance of 2.5 m from the plant row. Image A was used to measure PH, FFIH and SD (Figure 1A); and both images (Image A + Image B) were used to estimate NCF and NDF (Figure 1A, B, C and D).
The images were analyzed using the public do-main image-processing program ImageJ. In each plant photographed, a ruler was placed as a reference to facili-tate calibration using the software function set scale. The NFC and NDF traits were estimated using the plugin
Cell Counter, which is part of ImageJ.
Phenotyping of the morpho-agronomic fruit traits For this study, 50 fruits were selected from the ‘THB’ variety in which the traits’ fruit length (FL), the
largest fruit diameter (D1F), and the smallest fruit di-ameter (D2F) were measured. The measurements were carried out by digital caliper (DC), and the results ex-pressed in millimeters. The fruits were weighed using an analytical balance. The fruit volume was calculated by the water column displacement (WCD) method. This method required each fruit to be immersed in a gradu-ated volumetric container of 10 L containing an initial known volume of water (initial volume); the fruit vol-ume was obtained by calculating the difference between the initial and final volume.
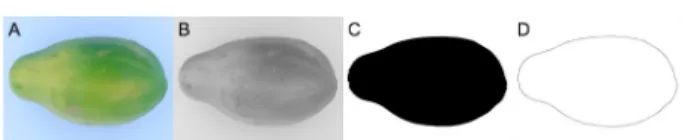
The image processing (IP) system consisted of a box with dimensions of 50 × 60 × 60 cm, with the inner walls covered with white cardboard, and illumi-nated with two 20 W PL bulbs; a webcam placed on the top of the box; and a laptop equipped with the Im-ageJ program. Each fruit was placed in the center of the camera’s field of view and two RGB color images were captured after manually turning the fruit 90º around its longitudinal axis. A measuring tape was placed on the fruit surface and the calibration was performed using the set scale function of the ImageJ software. The origi-nal image of each fruit was converted to an eight-bit grayscale image. By using the thresholding technique, the region of interest in the grayscale image was seg-mented using the Otsu algorithm. After that, a binary image with pixel values of 0 (black) or 250 (white) was obtained. From the grayscale image, values lower than 144 were converted to 0 (black) and values greater than 144 were converted to 250 (white), which led to obtain-ing a binary image for each fruit. The Canny filter was used to detect the edges in each image. The image-pro-cessing flowchart is illustrated in Figure 2A, B, C and D. The number of pixels that represent the length and the width of the fruits was measured in the binarized image (Figure 2D).
The parameters major and minor of the ImageJ were used to validate the measurements of FL, D1F and D2F. Thus, the parameter major was compared to the FL trait and the parameter minor was compared to the D1F and D2F traits. Major and minor 1 were obtained from the first image and minor 2 was measured using the image obtained after rotating the fruit 90º around its longitudinal axis.
In order to estimate the volume using the dimen-sions of the fruit obtained via digital image and those ob-tained using a caliper, each papaya fruit was considered as a uniform ellipsoid. Thus, fruit volume was estimated from the length (FL), the largest diameter (D1F) and the smallest diameter (D2F) to construct the equation of el-lipsoid approximation (EA) (Koc, 2007):
v= FL D F× ×D F
π 1 2
6
(1)
Statistical Analysis
Statistical analysis was performed using SAS Stu-dio software (SAS Institute, Cary, NC, USA).
Table 1 − Estimates of average, average difference confidence interval (CI), average relative error of the methodology assisted by digital images (Error %) and Pearson correlations (r) for traits: the plant height (PH), the first fruit insertion height (FFIH), the stem diameter (SD), the number of commercial fruits (NCF) and the number of irregular shaped fruits (NDF), measured in the ‘UENF/ Caliman-01’ hybrid and the ‘THB’ variety using manual and image analysis methodologies.
Trait
Measurement Average CI Error (%) r ‘UENF/
Caliman-01’
PH Manual 224.85 a
[-1.23; 1.10] 0 0.98
PH Image 224.91 a
SD Manual 113.39 a
[-1.02; 2.24] 1 0.97
SD Image 112.78 a
FFIH Manual 78.06 a
[-0.63; 0.09] 0 0.98
FFIH Image 77.79 a
NCF Manual 21.97 a
[-1.05; 1.40] 1 0.98 NCF Image A + Image B 21.79 a
NCF Image A × 2 22.19 a [-1.50; 1.06] 1 0.93 NCF Image B × 2 21.40 a [-0.76; 1.89] 3 0.92
NDF Manual 4.60 a
NDF Image A + Image B 4.50 a [-0.10; 0.30] 2 0.87 NDF Image A × 2 4.52 a [-0.26; 0.42] 2 0.79 NDF Image B × 2 4.48 a [-0.23; 0.27] 3 0.71 ‘THB’
PH Manual 190.61 a
[-1.42; 0.07] 0 0.98
PH Image 191.29 a
SD Manual 101.40 a
[-0.06; 3.03] 1 0.97
SD Image 99.91 a
FFIH Manual 74.03 a
[-0.66; 0.19] 0 0.97
FFIH Image 73.80 a
NCF Manual 40.75 a
[-0.55; 0.42]
NCF Image A + Image B 40.90 a 0 0.97
NCF Image A × 2 40.60 a [-0.72; 1.21] 0 0.90 NCF Image B × 2 41.20 a [-1.20; 0.44] 1 0.92
NDF Manual 3.81 a
NDF Image A + Image B 3.63 a [-0.08; 0.33] 5 0.87 NDF Image A × 2 4.33 b [-0.77; -0.27] 14 0.70 NDF Image B × 2 2.92 b [0.55; 0.93] 23 0.70 The same letters in the column do not differ (paired t test, p > 0.05); The PH and the FFIH is expressed in cm, the SD in mm.
In order to verify whether the phenotyping meth-odologies of morpho-agronomic traits assisted by digi-tal images statistically differ from manual methodology, Student’s t test was applied to assess differences in popu-lation averages for paired data (same popupopu-lation: manual phenotyping and phenotyping via digital image). In addi-tion, confidence intervals were constructed for the aver-age difference of methodologies (paired data).
The average relative error of the digital images methodologies was calculated according to the following equation (Zhang, 2000):
Error x x x m i
m
(%)= − ×100, (2)
where: xm is the average of the trait obtained using the
manual methodology and xi is the average of the trait
obtained via digital image.
Pearson correlations between the manual mea-surements and those obtained through the digital images were calculated for the traits assessed.
Since this is a study aiming to validate a pheno-typing methodology to be applied to breeding, a simula-tion was performed to establish the minimum number of plants that should be used in the experimental plots based on the results observed in the validation of the proposed methodology. The simulation was performed for the number of commercial fruits (NCF) due to its agronomic importance. Thus, the relative average differ-ence of NCF was calculated simulating a different num-ber of plants, measured with two images (Image A + Image B) and one composite image (Image A and Image B). In each simulation, samples with size k (1, 2, 4, 5, 8, 10, 20, 30, 40, 50, 60, 70, 80, 90, 100, 110, 120, 130, 140 and 150) were generated.
The Bland and Altman (1999) approach was adopt-ed to plot the agreement between the papaya fruit vol-ume measured by WCD and EA. This approach is used to analyze the agreement between two different meth-ods that measure the same variable with the same unit of measurement. Thus, it was possible to decide whether the differences between the measurements of the two methods might be acceptable and equivalent.
Results and Discussion
Phenotyping of the morpho-agronomic plant traits Table 1 shows the statistics obtained from the analysis of both manual and image analysis phenotyp-ing of the morpho-agronomic plant traits measured in
the ‘THB’ variety and ‘UENF/Caliman-01’ hybrid. For the two genotypes, similar averages were obtained for plant height (PH), stem diameter (SD), and first fruit in-sertion height (FFIH) (p > 0.05). Similarly, these results were obtained at intervals constructed for the average difference of methodologies (Table 1). Because all inter-vals contain zero, the estimated averages of these traits are the same considering the two methodologies. These results indicate that trait phenotyping assisted by digital images can be used to replace the traditional methodol-ogy. Digital image analysis has also been used in other crops with the purpose of evaluating traits of interest. For example, Ferreira et al. (2012) found no significant differences between the averages of the morphological traits in Australian red cedar measured manually and Figure 2 − Digital image processing. A) Original RGB color image of
those measured by digital image analysis. In turn, Sri-tarapipat et al. (2014) and Miller et al. (2015) validated algorithms of digital image processing to estimate the plant height of rice and Tilia platypyllos, Acer campestre,
Acer rubrum, Juglans regia, respectively, obtaining similar results to those found using the traditional methodology.
The average relative error of the methodology as-sisted by digital images was zero for the PH and FFIH traits in the the ‘UENF/Caliman-01’hybrid and the ‘THB’ cultivar (Table 1). For the SD trait, the average relative error was 1 % for ‘UENF/Caliman-01’ and 1 % for ‘THB’ (Table 1). These errors are lower than those reported for diameter estimations found by Shimizu et al. (2014), who measured this trait in Japanese cedars using an algorithm of analysis and processing, finding a minimum error of 2 % and a maximum of 7%.
These results show that the phenotyping of mor-phological papaya traits based on digital image analysis enables accurate estimations. The image analysis er-rors may be due to the irregular architecture of certain plants. For example, cylindrical stems can be measured more accurately than those in irregularly shaped stems. It could be seen that the correlations between the man-ual measurements and those using digital image analy-sis for the morphological traits were high, ranging from 0.97 to 0.98 in both genotypes and showing that the two-phenotyping methodologies presented good constancy.
As for the NCF and NDF traits, where two images were used (Image A + Image B) there were no differences (p > 0.05) between the averages. Furthermore, the confi-dence intervals for the average difference of methodolo-gies presented zero, confirming equality between the av-erages (Table 1). Thus,digital image analysis methodology could be used for the phenotyping of these traits.
The average relative error was low for the NCF trait (1 %) for the ‘UENF/Caliman-01’ hybrid and zero % for the ‘THB’ variety. However, for NDF the average relative error was 2 % for the hybrid and 5 % for the variety (Table 1).
High correlations between the NCF averages were obtained using two images and the averages obtained manually, being 0.98 for the hybrid and 0.97 for the va-riety. In its turn, for NDF correlations were found with a magnitude of 0.87 in both genotypes. These correla-tions are greater than those found in fruit trees using phenotyping methodologies based on digital images. For example, Payne et al. (2013) developed an algorithm for estimating the number of fruits in mango tree, obtain-ing a correlation of 0.74 compared to manual countobtain-ing. In apple trees, Zhou et al. (2012) validated an algorithm used to estimate the production of light green and red fruits, and found correlations of 0.80 and 0.85 compared to manual counting. In vines, Roscher et al. (2014) devel-oped an algorithm for estimating the number and size of berries at different development stages. The algorithm identified the berries with an average difference in di-ameter of 1 mm and a correlation of 0.88 compared to measurements taken using a caliper.
In order to determine how many images can be used in phenotyping the NCF and NDF traits, the A and B images were compared to assess the symmetry between the photographed sides. For this, the number of fruits obtained in each image was multiplied by two (Image A × 2 and Image B × 2) and the estimated aver-ages were compared to those obtained manually by the
t test for paired data. In relation to NCF, the averages obtained using Image A × 2 or Image B × 2 showed no differences (p > 0.05) in the averages obtained by manual measurements in both genotypes. Furthermore, the average relative error was low and close to that cal-culated with the two images in the ‘THB’ variety and ‘UENF/Caliman-01’ hybrid. These results indicate that the number of commercial fruits can be obtained by us-ing an image without loss of experimental precision.
Although these trait estimation errors are low in the ‘THB’ variety and ‘UENF/Caliman-01’ hybrid, there are differences between them, with greater accuracy in the variety compared to the hybrid. This fact may be due to greater fruit occlusion in the hybrid compared to the variety. In some cases, a fruit is not completely visible because the leaves, branches, or other fruits ham-per its viewability, or more fruits may be growing in the same node. Thus, fruit occlusion can decrease their vis-ible area and make their detection in the image difficult. Fruit occlusion has been widely commented on in re-search studies of fruit detection through methodologies based on digital images (Aggelopoulou et al., 2011; Dorj et al., 2013; Payne et al., 2013; Roscher et al., 2014).
The correlations between NCF estimated by man-ual methodologies and using an image (Image A × 2 and Image B × 2) were high, showing that consistency be-tween methodologies can be maintained using an image. The good consistency between the two methodologies is very important for yield prediction purposes in commer-cial plantations since commercommer-cial fruit counting via digi-tal image can be used to feed mathematical models of yield prediction, and generate useful information to im-prove activities in harvest, post-harvest, packinghouse, and commercialization (Aggelopoulou et al., 2011).
(Image B × 2). The NDF trait in the hybrid may be esti-mated using an image, indicating that the photographed sides are symmetrical. However, in the ‘THB’ variety the photographed sides presented differences, showing that they are not symmetrical. These differences may be due to greater variation in this trait in the variety. Another possible explanation is that in ‘THB’ there is greater difficulty in identifying the portion of the fruit that exhibits the anomaly. For example, carpelloid fruits can be confused with commercial fruits. In the case of pentandric and bananoid fruits, identification is easier due to their characteristic shape. However, a trained and experienced evaluator can identify most of the irregular-ly shaped fruits from the image, thereby reducing errors attributable to the methodology.
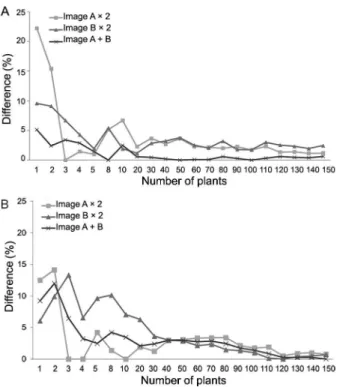
The results in the simulation of the minimum number of plants that should be used in the experimen-tal plots for estimating the NCF trait are shown in Fig-ure 3A and B. For the ‘UENF/Caliman-01’ hybrid when using two images and a plant, the relative difference was 5 %; this difference was lower with the increase in sample size. Taking this into consideration, a minimum number of two plants and a maximum of 10 plants may constitute the experimental plots for papaya; these re-sults show that digital image analysis methodology can be used to estimate this trait in experimental plots. In the simulation performed by using an image, with the
increase in sample size, the relative difference also de-creases. However, the relative difference is higher com-pared to the results obtained using two images. Thus, using Image A × 2 and a plant, the difference was 22 %; on the other hand, using Image B × 2, yielded a dif-ference of 9 %. When two plants were used, the relative difference using Image A × 2 was 15 % and 9 % using Image B × 2; and when using four plants, the difference was 1 % using Image A × 2 and 4 % using Image B × 2.
For the ‘THB’ variety, using two images and a plant, the relative difference was 9 %, which decreased as the sample size increased. When an image is used, as the sample size increases the relative difference also de-creases. However, the relative difference is higher when compared to the results obtained using two images. Thus, using Image A × 2 and a plant, the difference was 22 %, while using Image B × 2, the difference was 9 %. In turn, by simulating two plants, the difference obtained using Image A × 2 was 14 % and 10 % when using Image B × 2. In addition, when using four plants the difference found was 4 % using Image A × 2 and 6 % using Image B × 2.
These results suggest that in experiments formed by plots with few plants (k = 2, 3), the estimation of NCF can be performed with two images; on the other hand, in experiments with larger plots (k ≥ 4), this trait can be assessed using one image.
Phenotyping of the morpho-agronomic fruit traits The averages of the FL, D1F and D2F traits mea-sured with a caliper showed no differences (p > 0.05) from the averages of the parameters major, minor 1 and
minor 2, respectively (Table 2). These results indicate that the parameters major and minor are equivalent to the length and diameter of the papaya fruits; thus, they could be used to estimate these traits by digital image processing (IP). The estimate error using digital images was zero in all three traits, showing that this method could be deployed to estimate them with a high degree of accuracy. Several authors have reported success in es-timating the diameter and length of fruits using digital images. For instance, Koc (2007) validated these traits in watermelon with the use of digital images, obtaining av-erages similar to the measurements taken with a caliper.
Table 2 − Estimates of average, average difference confidence interval (CI), average relative error of image processing (Error %) for traits: The fruit length (FL), the largest fruit diameter (D1F) and the smallest fruit diameter (D2F), measured in the ‘THB’ variety using digital caliper (DC) and image processing (IP).
Trait Average CI Error (%)
DC IP
FL 13.50 a 13.53 a [-0.1; 0.02] 0
D1F 8.40 a 8.42 a [-0.1; 0.03] 0
D2F 8.16 a 8.19 a [-0.07; 0.12] 0
The same letters in the row do not differ (paired t test, p > 0.05); The traits are expressed in cm.
Similarly, Khojastehnazhand et al. (2009), when evaluat-ing oranges, and Rashidi et al. (2009), when evaluatevaluat-ing cantaloupe, found that the fruit averages obtained with IP were similar to those measured with a caliper.
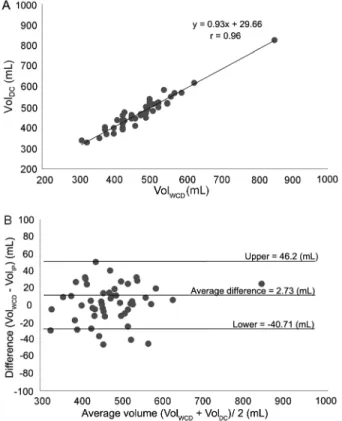
The correlation between the volume calculated by WCD and by the EA using the dimensions obtained with a digital caliper was high (r = 0.96) (Figure 4A). According to the Bland and Altman (1999) approach, these methods are consistent, which means that the volume of papaya fruits may be estimated using EA with the dimensions of the fruit obtained with a cali-per. Agreement was obtained when only the smallest diameter and the length of the fruit were used in EA. The average difference (AD) between the estimated volume using the dimensions obtained with a digital caliper and by WCD was 2.73 mL (Figure 4B). The stan-dard deviation of the volume (SDev) differences was 22.17 mL. The volume of the papaya fruit measured from WCD and the volume estimated with a caliper was similar (p > 0.05) (Table 3). Ninety-five percent
of the volume differences are expected to be between the AD at -1.96 SDev and AD + 1.96 SDev, known as the limits of agreement (Bland and Altman, 1999). The limits of agreement of the differences between the vol-ume calculated by WCD and EA were -40.71 and 46.2 mL (Figure 4B). The volumes by expression of ellipsoid approximation can be lower than 40.71 mL or 46.2 mL higher than the volumes calculated by WCD. The er-rors in this methodology may be due to the use of an approach expression, which is based on the assumption that the fruits have a perfectly ellipsoid shape. There-fore, irregularly shaped fruits serve to increment the errors of this methodology. This was evidenced in the use of EA, in which the volume is validated only when the smallest fruit diameter was used.
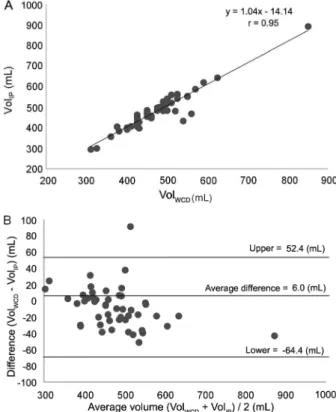
The correlation between the volume calculated by WCD and EA using the dimensions obtained by IP was high (r = 0.95) (Figure 5A). The Bland and Altman (1999) agreement between the two methods was also ob-tained when only the smallest diameter and the length of the fruit in the approximation expression were used. The average difference between the estimated volume using IP and WCD was where AD = 6 mL (Figure 5B). The standard deviation of the volume differences was where SDev = 29.78 mL. The volume of the papaya fruit measured from WCD and the volume estimated by IP was similar (p > 0.05) (Table 3). The limits of 95 % of agreement of the differences between the two methods were -64.4 and 52.4 mL (Figure 5B). The volumes by EA may be lower than 64.4 mL or 52.4 mL higher than the volumes calculated by WCD.
The Bland and Altman (1999) approach has been used to validate the volume and area of fruits using analysis and digital image processing. Thus, it has been used, for example, in validating the volume estimate of watermelon (Koc, 2007), orange (Khojastehnazhand et al., 2009) and the surface area of zucchini (Arjenaki et al., 2012).
Methodology errors based on digital images can also be due to the use of EA, as evidenced in volumes estimated with a caliper. The accuracy of the expression of ellipsoid approximation decreased in line with incre-ments in the irregularity of the fruits’ shape. Because of this fact, the fruit volume may be validated using its smallest diameter and length only.
Figure 4 – A) Correlation between estimated volume values by water column displacement (WCD) method and the expression of ellipsoid approximation (EA) using dimensions performed with digital caliper (DC); B) Bland-Altman plot for the comparison of papaya volumes measured with water column displacement (WCD) method and the expression of ellipsoid approximation (EA) using dimensions performed with digital caliper (DC); outer lines indicate the 95 % limits (upper and lower) of agreement and the center line shows the average difference.
Table 3 − Estimates of average, average difference confidence interval (CI), average relative error of image processing (Error %) to the volume of papaya fruit, measured in the ‘THB’ variety using the water column displacement (WCD) method, and the expression of ellipsoid approximation using measurements performed with digital caliper (DC) and image processing (IP).
Average CI Error (%)
WCD DC IP DC IP DC IP
The accuracy of fruit volume estimated by means of the dimensions obtained by IP was lower than that observed using the dimensions obtained with a caliper. This problem can be attributeded to the use of just a single camera. Thus, with increases in fruit size, the distance changes, resulting in an overestimation of the estimated volume for IP. Although the distance between the camera and the measurement box was constant, the distance between the fruit surface and the camera re-duced with increasing fruit size. Koc (2007), who also at-tributed image estimation errors to the distance change as fruit size increased, reported this problem in water-melon. According to Khojastehnazhand et al. (2009), this problem can be solved by using several cameras and de-veloping more complex algorithms, so that a 3D fruit silhouette can be reconstructed. Recently, more accurate methods such as the Monte Carlo simulation have been used in estimating the volume of irregularly shaped fruit (Siswantoro et al., 2014).
Fruit mass is a very important trait for papaya breeding due to its relationship with production and use
Figure 5 − Correlation between estimated volume values by water column displacement (WCD) method and the expression of ellipsoid approximation (EA) using dimensions performed with image processing (IP); B) Bland-Altman plot for the comparison of papaya volumes measured with water column displacement (WCD) method and the expression of ellipsoid approximation (EA) using dimensions performed with image processing (IP); outer lines indicate the 95 % limits (upper and lower) of agreement and center line shows the average difference.
Figure 6 − Regression between the volumes calculated by the expression of ellipsoid approximation (EA) and the fruit mass. A) The result for the volume estimated using dimensions performed with digital caliper (DC); B) The result for the volume estimated using dimensions performed with image processing (IP).
as a standard quality of fruits. Fruit mass is also used to monitor fruit development in the field, yield prediction and the estimating of fertilization and irrigation levels, planning activities in the packinghouse, transport and commercialization (Sabliov et al., 2002; Koc, 2007). Fruit mass can be determined from volume if its density is known. In this study, fruit volume estimated by EA us-ing measurements taken with a caliper and IP was re-lated to fruit mass. The results show that there is a high association between volume and mass for both methods. In this sense, the regression equations with R2 = 0.94
from measurements taken with a caliper and R2 =0.87
for those taken with IP (Figure 6A and B) were obtained. From the regression analysis, the following equations were obtained:
M = 0.85 VolDC + 5.12 (3)
and
M = 0.72 VolIP + 59.43, (4)
Thus, these simple equations can be used to es-timate the mass of papaya fruit from the volume esti-mate obtained by EA using a caliper and IP. Similarly, Khojastehnazhand et al. (2009) observed for orange fruits a high association where R2 =0.93 between their
mass and volume. These authors also obtained a regres-sion equation to estimate fruit weight from the volume obtained with IP.
Methodologies based on digital images are promising tools that can be used to assist the pheno-typing of interest traits in the papaya crop. Images are captured with a conventional camera, which is simple, inexpensive, and easily handled and trans-ported. In addition, the images can be stored in a computer for later analysis. All these traits reduce the work force and the time spent in the field and laboratory measurements, and improve the pheno-typing process. For example, in this study, two ob-servers spent on average 96.8 s to estimate manual morpho-agronomics traits per plant, whereas the same observers spent 15.8 s to capture two images per plant and 30 s for image analysis. In other words, the proposed image-based phenotyping is about twice as much quicker. Thus, the digital phenotyping proposed in this study is a much less time consuming process. The expectation is that image-based pheno-typing methodologies allow for expanding the experi-ments, performing phenotypic evaluation quickly and precisely, contributing to increases in selection differential and the heritability coefficient, with a di-rect effect on genetic gain. When applied to breeding populations, the precise quantification of phenotype increments the proportion of variance due to genetic effects and genetic gain in the selection of superior genotypes (Honsdorf et al., 2014; Parent et al., 2015; Pauli et al., 2016). Thus, it can be used at several stages of papaya breeding programs such as for germ-plasm evaluation, inbred line development and yield trial evaluations in general. Also, image-based phe-notyping can be used to facilitate genome-wide selec-tion (GWS), genome-wide associaselec-tion studies (GWAS) and marker-assisted selection (MAS).
Acknowledgements
The authors are grateful to the Caliman Agrícola S/A and the Brazilian National Council for Scientific and Technological Development (CNPq) for financial sup-port. We are also grateful to the Coordination for the Improvement of Higher Level Personnel (CAPES) for scholarships granted to the students.
References
Aggelopoulou, A.D.; Bochtis, D.; Fountas, S.; Swain, K.C.; Gemtos, T.A.; Nanos, G.D. 2011. Yield prediction in apple orchards based on image processing. Precision Agriculture 12: 448-56.
Arjenaki, O.O.; Asad, M.M.; Parviz, A.M. 2012. A new method for estimating surface area of cylindrical fruits (zucchini) using digital image processing. Australian Journal of Crop Science 6: 1332-1336.
Bland, J.M.; Altman, D.G. 1999. Measuring agreement in method comparison studies. Statistical Methods in Medical Research 8: 135-160.
Dorj, U.; Malrey, L.; Sangsub, H. 2013. A comparative study on tangerine detection, counting and yield estimation algorithm. International Journal of Security and Its Applications 7: 405-412.
Ferreira, R.T.; Viana, A.P.; Barroso, D.G.; Resende, M.D.V.; Amaral Júnior, A.T. 2012. Toona ciliata genotype selection with the use of individual BLUP with repeated measures. Scientia Agricola 69: 210-216.
Food and Agriculture Organization [FAO]. 2015. Browse data. Available at: http://faostat3.fao.org/browse/Q/QC/E [Accessed Dec 10, 2015]
Honsdorf, N.; March, T.M.; Berger, B.; Tester, M.; Pillen, K. 2014. High-throughput phenotyping to detect drought tolerance QTL in wild barley introgression lines. PLOS One 9: e97047. Khojastehnazhand, M.; Omid, M.; Tabatabaeefar, A. 2009.
Determination of orange volume and surface area using image processing technique. International Agrophysics 2000: 237-242.
Koc, A.B. 2007. Determination of watermelon volume using ellipsoid approximation and image processing. Postharvest Biology and Technology 45: 366-371.
Li, L.; Qin, Z.; Danfeng, H. 2014. A review of imaging techniques for plant phenotyping. Sensors 14: 20078-20111.
Miller, J.; Morgenroth, J.; Gomez, C. 2015. 3D modelling of individual trees using handheld camera: accuracy of height, diameter and volume estimates. Urban Forestry and Urban Greening 14: 932-940.
Oliveira, E.J.; Amorim, V.B.O.; Matos, E.L.S.; Costa, J.L.; Castellen, M.S.; Pádua, J.G.; Dantas, J.L.L. 2010. Polymorphism of microsatellite markers in papaya (Carica papaya L.). Plant Molecular Biology Reporter 28: 519-530. Pauli, D.; Sanchez-Andrade, P.; Carmo-Silva, E.; Gazave, E.;
French, A.N.; Heun, J.; Hunsaker, D.J.; Lipka, A.E.; Setter, T.L.; Strand, R.J.; Thorp, K.R.; Wang, S.; White, J.W.; Gore, M.A. 2016. Field-based high-throughput plant phenotyping reveals the temporal patterns of quantitative trait loci associated with stress-responsive traits in cotton. G3: 865-879.
Parent, B.; Shahinnia, F.; Maphosa, L.; Berger, B.; Rabie, H.; Ken, H.; Kovalchuk, A.; Langridge, P.; Fleury, D. 2015. Combining field performance with controlled environment plant imaging to identify the genetic control of growth and transpiration underlying yield response to water-deficit stress in wheat. Journal of Experimental Botany 66: 5481-5492.
Payne, A.B.; Walsh, K.B.; Subedi, P.P.; Darvis, P.P. 2013. Estimation of mango crop yield using image analysis: segmentation method. Computers and Electronics in Agriculture 91: 57-64.
Roscher, R.; Herzog, K.; Kunkel, A.; Kicherer, A.; Töpfer, R.; Förstner, W. 2014. Automated image analysis framework for high-throughput determination of grapevine berry sizes using conditional random fields. Computers and Electronics in Agriculture 100: 148-158.
Sabliov, C.M.; Boldor, D.; Keener, K.M.; Farkas, B.E. 2002. Image processing method to determine surface area and volume of axi-symmetric agricultural products. International Journal of Food Properties 5: 641-653.
Shimizu, A.; Yamada, S.; Arita,Y. 2014. Diameter measurements of the upper parts of trees using an ultra-telephoto digital photography system. Open Journal of Forestry 4: 316-326. Siswantoro, J.; Prabuwono, A.S.; Abdullah, A.; Idrus, B. 2014.
Monte Carlo method with heuristic adjustment for irregularly shaped food product volume measurement. The Scientific World Journal 2014: 1-10.
Sritarapipat, T.; Rakwatin, P.; Kasetkasem, T. 2014. Automatic rice crop height measurement using a field server and digital image processing. Sensors 14: 900-926.
Zhang, Z. 2000. A flexible new technique for camera calibration. IEEE Transactions on Pattern Analysis and Machine Intelligence 22: 1330-1334.