Spatial distribution of Diaphorina citri Kuwayama (Hemiptera:
Psyllidae) in citrus orchards
Marilia Gregolin Costa
1; José Carlos Barbosa
2; Pedro Takao Yamamoto
3*; Renata Moreira
Leal
41
UNESP/FCAV – Programa de Pós-Graduação em Entomologia Agrícola. 2
UNESP/FCAV – Depto. de Ciências Exatas, Via de Acesso Prof. Paulo Donato Castellane, s/n – 14884-900 – Jaboticabal, SP – Brasil.
3
USP/ESALQ – Depto. de Entomologia e Acarologia, C.P. 9 – 13418-900 – Piracicaba, SP – Brasil. 4
UNESP/FCAV – Programa de Pós-Graduação em Produção Vegetal. *Corresponding author <pedro.yamamoto@usp.br>
ABSTRACT: The psyllid Diaphorina citri Kuwayama is one of the most important pests of citrus, mainly because it is the vector of the bacterium that causes huanglongbing (HLB) or ‘Greening’ disease. To study the spatial distribution of nymphs and adults of this pest, an experiment was carried out in two ‘Valencia’ sweet orange orchards, four and 12 years of age, established in Matão, central area of São Paulo state, Brazil. The following dispersion indices were used to study pest aggregation in the citrus plants: variance/mean relationship (I), index of Morisita (Iδ), coefficient of Green (Cx), the k exponent of negative binomial distribution, common k (kc) and Taylor’s Power Law for each sampling. The negative binomial distribution was more representative of the spatial distribution of this psyllid, for both nymphs and adults. For most samplings, psyllid nymphs found in branches and adults caught in traps had an aggregated distribution.
Key words: Citrus sinensis, psyllid, probability distributions, negative binomial distribution
Distribuição espacial de Diaphorina citri Kuwayama (Hemiptera: Psyllidae)
em pomares de citros
RESUMO: O psilídeo Diaphorina citri Kuwayama tornou-se nos últimos anos uma das mais importantes pragas na cultura de citros, principalmente pelos prejuízos causados às plantas por ser o transmissor da bactéria causadora da doença Huanglongbing (HLB) ou ‘Greening’. Com a finalidade de estudar a distribuição espacial de ninfas e adultos desta praga, instalaram-se experimentos em duas áreas de citros com histórico de ocorrência de HLB, no município de Matão (região central do Estado de São Paulo), em plantas de laranja ‘Valência’, com quatro e 12 anos de idade. Para estudo da agregação da população nas plantas, foram utilizados os seguintes índices de dispersão: razão variância/média (I), índice de Morisita (Iδ), coeficiente de Green (Cx) e expoente k da distribuição binomial negativa, k comum (kc) e lei da potência de Taylor para cada amostragem. A distribuição binomial negativa foi o modelo mais adequado para representar a distribuição espacial do psilídeo, tanto para ninfas como para adultos. Na maioria das amostragens, as ninfas encontradas nas brotações e os adultos capturados nas armadilhas apresentaram distribuição agregada.
Palavras-chave: Citrus sinensis, psilídeo, distribuições de probabilidade, distribuição binomial negativa
Introduction
The psyllid Diaphorina citri Kuwayama (Hemiptera: Psyllidae) is currently one of the most important pests of world citriculture. It was discovered in 1907 in Tai-wan and is today distributed across several countries of South Asia, regions of the Middle East, the Southern re-gion of the United States, and in Central America, the Caribbean, and South America (Halbert and Manjunath, 2004).
This insect has become greatly important because it is the vector of the bacteria that causes huanglongbing, that is restricted to the phloem vessels of plants (Gravena, 2005). The bacteria Candidatus Liberibacter spp. is transmitted by the psyllid Trioza erytreae (Del Guercio) and D. citri; the first is associated with the Af-rican form of the disease (Candidatus Liberibacter
africanus), while the second is associated with the Asian (Candidatus Liberibacter asiaticus) (Capoor et al., 1967) and the American forms (Candidatus Liberibacter americanus); the latter is only found in Brazil (Coletta-Filho et al., 2004; Teixeira et al., 2005a, b). The psyllid D. citri can be found throughout the year, with popula-tion peaks in the spring and summer, the periods of great-est vegetative flushes in citrus plants (Gravena, 2005; Yamamoto et al., 2001).
nymphs and adults in citrus, in order to provide support information for the rational control of this pest.
Material and Methods
The study was carried out in Matão, state of São Paulo, Brazil (21°36’ S; 48°21' W), in two ‘Valencia’ sweet orange (Citrus sinensis (L.) Osbeck) plots, grafted on Rangpur Lime; one area had four year old plants (area 1 - stand 9A), while the other had 12 year old plants (area 2 - stand 99). Both received the management prac-tices (fertilization, hoeing, and herbicide application) and phytosanitary measures (application of acaricides, insecticides, and fungicides) recommended for the crop. To survey D. citri adults and nymphs, area 1 was di-vided into 88 sampling units or plots consisting of 21 plants each (seven rows × three plants), while area 2 was divided into 84 plots containing 21 plants each (three rows × seven plants). The spacing between the plants in the two experimental areas was 7 m among lines and 3 m among plants, totalizing 1,848 plants (3.9 ha) in area 1 and 1,764 (3.7 ha) in area 2. To evaluate the num-ber of adults, double sided yellow sticky traps (Hall et al., 2007) were placed on the central plant of each plot at a height of approximately 1.5 m from the ground, and to nymphs, were evaluated by sampling a shoot (up to 10 cm in length) taken at random from the middle re-gion of the central plant of each plot in both areas.
The study was carried out in the 2005/2006 and 2006/ 2007 cropping seasons. Nymph samplings were carried out two week periods during the period of greatest veg-etative flush (December 2005 to April 2006 and Novem-ber 2006 to March 2007). Adults were sampled during two weeks in the period of greatest emission of shoots (November through March) and one month in the rest of the period. Sprays with insecticides and acaricides/ insecticides were applied in area 1 on 01/10/06 (abamectin), 09/12/06 (dimethoate), 12/19/06 (abamectin), 08/07/07 (thiamethoxam), and 11/28/07 (abamectin). In area 2, applications were made on 09/ 26/06 (dimethoate) and 01/12/07 (abamectin).
The data were analyzed by calculating the mean (m)
and variance (s2) for all samplings, as well as the
follow-ing dispersion indices:
Variance/mean relationship (I) - used to measure de-parture from a randomness arrangement, where values equal to one indicate a random spatial distribution; val-ues smaller than one indicate a regular or uniform dis-tribution; and values greater than one indicate an aggre-gate or contagious distribution according to Rabinovich (1980), and is given by:
,
where: s2 = sampling variance; = sampling mean; x
i
= number of psyllids found in the sampling units; n = number of sampling units.
Departure from randomness can be tested by the chi-square test with n-1 degrees of freedom, by means of the expression:
X2 = I. (n–1)
that is,
Randomness is rejected when X2≥χ2 (n–1).
Index of Morisita (Iδδδδδ) - it indicates that a distribution is random when it is equal to 1, aggregate when it is higher than 1, and regular when it is smaller than 1. Morisita (1962) developed the following formula:
where: n= number of sampling units; x = number of psyllids found in the sampling units; ∑x=sum of indi-viduals present in the sampling units.
Departure from randomness can be tested by:
.
If , the hypothesis of a random distribu-tion is rejected.
Coefficient of Green (Cx) - This index is acceptable for comparisons between contagious distributions, rang-ing from 0 for random distributions to 1 for maximum contagion (Green, 1966). It is based on the distribution’s variance/mean ratio and is given by:
Departure from randomness can be tested by:
Randomness is rejected when Cx > Cx(1-α) (Davis, 1993).
K exponent of negative binomial distribution (k)
-This index should only be used when the data fit the negative binomial distribution. When k values are low and positive (k < 2) they indicate a highly aggregate ar-rangement; k values ranging from 2 to 8 indicate moder-ate aggregation; and values higher than 8 (k > 8) indi-cate a random arrangement (Elliott, 1979; Southwood, 1978). k values were calculated by the moments meth-ods (Anscombe, 1949), given by:
2
ˆ ˆ ˆ
/
k=m s2-m
where: N = number of sampling units; ln = Napierian logarithm; = sampling mean; = k value estimate; xi
= number of psyllids found in sampling units; A(xi) = sum of frequencies of values higher than xi; nc = num-ber of classes in the frequency distribution.
The estimation method is interactive, by trial and er-ror, until equality is achieved between both members of the equation, with a previously-established margin of error. The calculation can be started from the k value obtained by the method of moments, thus allowing con-vergence to be achieved more quickly.
Estimation of the common exponent k (kc) - To find a common value of k that represented most of the dates of sampling, we used the method proposed by Bliss & Owen (1958), known as method of weighted regression. For the calculation of kc of nymphs and adults, the sam-pling of the two areas were analyzed together, and were excluded some samples with values that were very dis-crepant from the others, represented by null, very low or very high values of occurrence of the pest.
Taylor’s power law - the relationship between the vari-ance and the average was expressed through the power of the Taylor Law, amended by:
The parameter b of Taylor’s Law is an index of ag-gregation, and the population is aggregated when b > 1, random when b = 1 and uniform when b <1 (Tay-lor, 1961).
Probabilistic models for studying the pest’s spatial distribution - The data of each sampling in each area evaluated were tested to see if they fitted Poisson’s dis-tribution; the hypothesis is that all individuals have the same probability of occupying a given space and the presence of an individual does not affect the presence of another, with variance equal to the mean (σ2 = m)
ac-cording Barbosa and Perecin (1982); or if they fitted the negative binomial distribution, where the occurrence of an individual limits the occurrence of neighboring indi-viduals in the same unit, with variance higher than the mean (σ2 > m) according to Perecin and Barbosa (1992).
The model fits the original data adequately when the observed and expected frequencies are in close proxim-ity. Such proximity was tested by the chi-square test, given by:
where: FOi = observed frequency in class I; FEi =
Ex-pected frequency in class i; nc = number of classes in the frequency distribution.
The number of degrees of freedom in the χ2 test is
given by:
d.f. = nc- np- 1.
where: np = number of parameters estimated in the sample.
The test criterion adopted was that the fitting of the distribution under study should be rejected at the α% probability level if:
X2 ≥ χ2 (nc - np - 1;α)
Results and Discussion
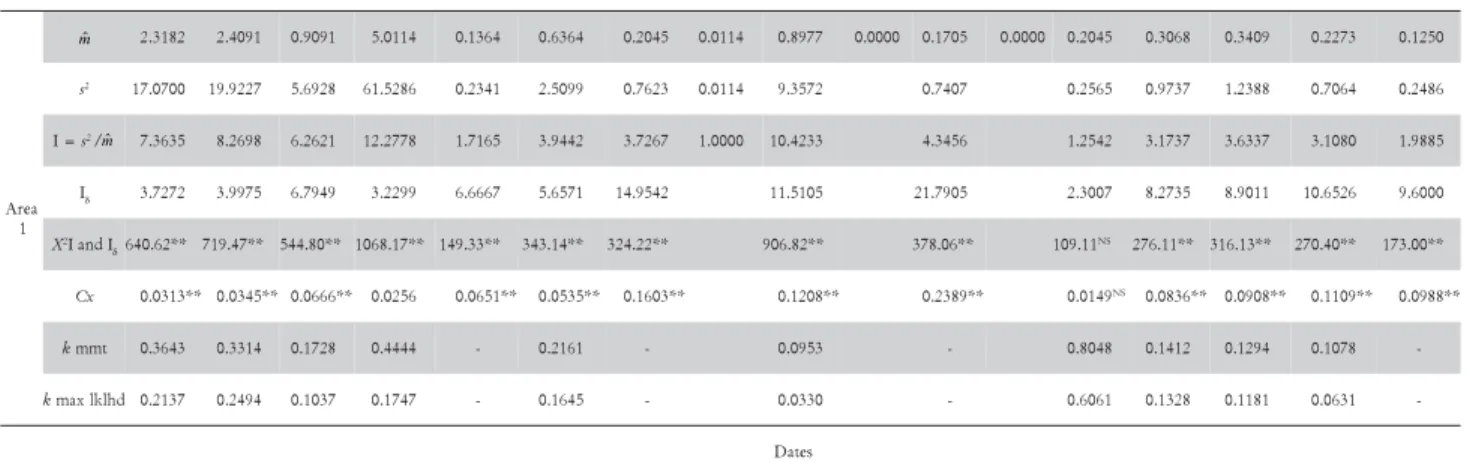
The dispersion index results for numbers of D. citri nymphs found in shoots indicate that, in area 1 (younger plants), the mean numbers of nymphs found were much higher than in area 2 (older plants), with population peaks in January 2006 for both. The average numbers of nymphs in areas 1 and 2 were 5.01 and 0.87, respectively. In the following year, infestation was not as high, but in the summer months the nymphal population was higher in area 1, with means ranging from 0.20 in January to 0.12 in March 2007, while in area 2 means ranged from 0.06 in January to 0.01 in March (Table 1). Such pres-ence of nymphs in those months is justified by the greater numbers of shoots, which are preferred for oviposition, together with weather conditions favorable for insect development (Gallo et al., 2002). The nymphal popula-tion difference between areas 1 and 2 was also due to greater emission of shoots in the young orchard, which made it more attractive to the vector. In general, branch vigor and number of shoots are much higher in younger orchards than in older ones.
The values obtained for the variance/mean ratio (I) were greater than one in almost all samplings in both areas, with the exception of those sampled on 03/28/06 in area 1 and on 12/21/06 in area 2, showing that nymph distribution was aggregate in both areas. The values ob-tained for Morisita’s index (Id) also indicated nymphal aggregation, since all samplings in area 1 and almost all samplings in area 2 had values higher than one (Table 1).
Green’s coefficient (Cx) analysis showed that the val-ues found in almost all samplings in both areas were higher than zero, indicating, according to Davis (1993), that the population had an aggregate distribution. This type of distribution was confirmed by the parameter k values of the negative binomial distribution by the maxi-mum likelihood method, which had positive, smaller than 2 values in all nymph evaluation dates, indicating high aggregation, according to Elliott (1979) (Table 1).
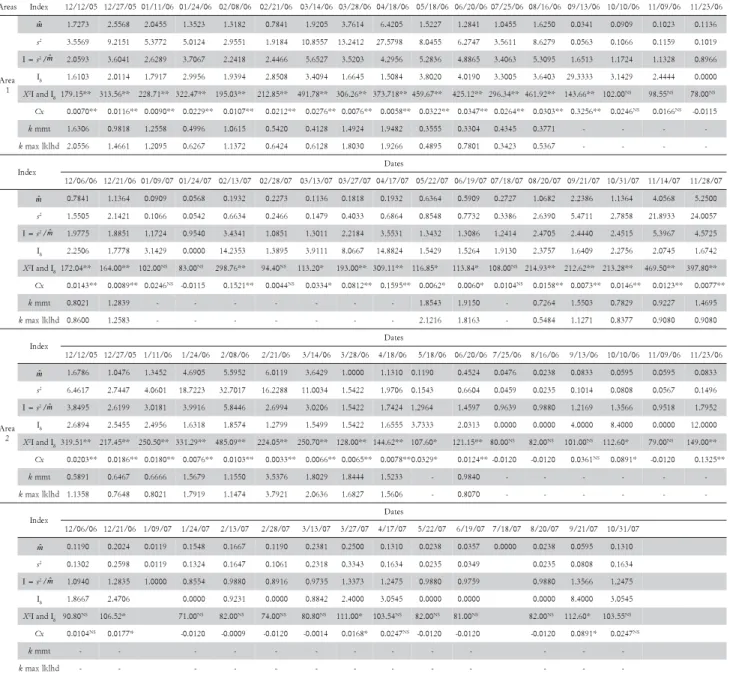
a tall peak in February 2006, with an average of 5.59 and 6.01 adults in the traps evaluated; the population then decreased and almost no oscillations occurred from May 2006 (mean of 1.13 adult) until the end of the ex-periment, in October 2007 (mean of 0.13 adult) (Table 2).
For adults collected in area 1, with the exception of two samplings, all other 32 had variance/mean index (I) and Morisita’s index (Iδ) values higher than one, indicat-ing that the adult population of psyllids had an aggre-gate distribution. In area 2, most samplings had values higher than one for those indices (Table 2).
Green’s coefficient (Cx) values were positive for adult psyllids in most samplings in area 1 and in more than one half of the samplings in area 2. As to the k pa-rameter of the negative binomial distribution, the val-ues obtained by the maximum likelihood method ranged from 0.34 to 2.12 in area 1, and from 0.76 to 2.06 in area 2. In area 1, where values were lower, there was stron-ger aggregation, since maximum contagion occurs when the value tends to zero (Elliot, 1979). The higher I and Id values also indicate greater aggregation of adults in area 1, with 4 year old plants (Table 2).
Several authors have reported aggregate distributions of insect pests in some crops, such as Selenaspidus articulatus (Morgan) (Perruso and Cassino, 1997), Dilobopterus costalimai Young (Maruyama et al., 2002), and Orthezia praelonga Douglas (Costa et al., 2006) in cit-rus, and small Spodoptera frugiperda (J.E. Smith) cater-pillars in corn (Farias et al., 2001). Initially, data were tested to observe whether they fitted Poisson’s distribu-tion; later, since the means were smaller than the vari-ances in most D. citri nymph and adult samplings, we tested the data to see if they fitted the negative binomial distribution.
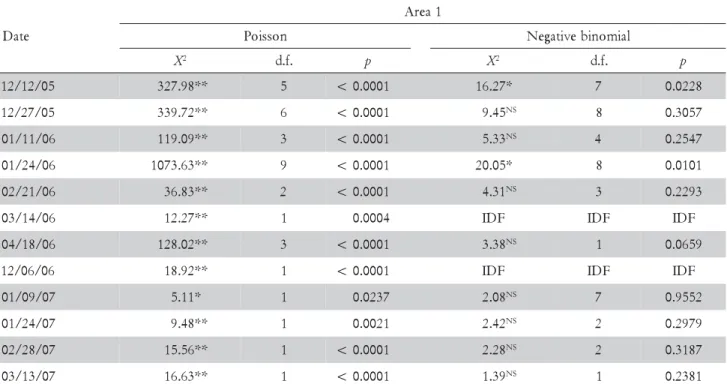
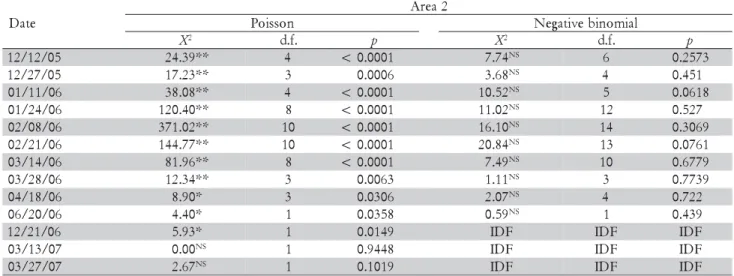
For nymphs, in all evaluations where the degree of freedom was sufficient for analysis, chi-square test values were significant at 1% or 5% probability when fitting Poisson’s distribution in both areas, demonstrating that their distribution is not random. When we attempted to fit the data to the negative bi-nomial distribution, the values were non-significant in 80% of the samplings in area 1 and in 100% of the samplings in area 2, thus confirming that the spatial distribution of D. citri nymphs was aggregated (Tables 3 and 4).
Table 1 – Means, variances, and dispersion indices for the mean numbers of D. citri nymphs found in citrus shoots. Matão – SP, Brazil 2005/2006/2007.
= sample mean; s2= sample variance; I = variance/mean relationship; I
δ= index of Morisita; X2 I and Iδ= randomness deviations test; Cx = coefficient of Green; k mmt = k by the moments method; k max lklhd. = k by the maximum likelihood method; *Significant at 5% probability; **Significant at 1% probability; NS Non-significant at 5% probability;
s a e r
A Index 12/12/05 12/27/0501/11/06 01/24/06 02/08/06 02/21/06 03/14/06 03/28/06 04/18/0611/23/0612/06/0612/21/0601/09/07 01/24/07 02/28/07 03/13/07 03/27/07
a e r A
1
2 8 1 3 .
2 2.4091 0.9091 5.0114 0.1364 0.6364 0.2045 0.0114 0.8977 0.0000 0.1705 0.0000 0.2045 0.3068 0.3409 0.2273 0.1250
s2 17.0700 19.9227 5.6928 61.5286 0.2341 2.5099 0.7623 0.0114 9.3572 0.7407 0.2565 0.9737 1.2388 0.7064 0.2486
=
I s2/ 7.3635 8.2698 6.2621 12.2778 1.7165 3.9442 3.7267 1.0000 10.4233 4.3456 1.2542 3.1737 3.6337 3.1080 1.9885
Iδ 3.7272 3.9975 6.7949 3.2299 6.6667 5.6571 14.9542 11.5105 21.7905 2.3007 8.2735 8.9011 10.6526 9.6000 X2IandI
δ640.62** 719.47** 544.80** 1068.17** 149.33** 343.14** 324.22** 906.82** 378.06** 109.11
S
N 276.11** 316.13** 270.40** 173.00**
x
C 0.0313** 0.0345** 0.0666** 0.0256 0.0651** 0.0535** 0.1603** 0.1208** 0.2389** 0.0149NS 0.0836** 0.0908** 0.1109** 0.0988**
kmmt 0.3643 0.3314 0.1728 0.4444 - 0.2161 - 0.0953 - 0.8048 0.1412 0.1294 0.1078
-kmaxlklhd 0.2137 0.2494 0.1037 0.1747 - 0.1645 - 0.0330 - 0.6061 0.1328 0.1181 0.0631
-x e d n I
s e t a D 5
0 / 2 1 / 2
1 12/27/0501/11/06 01/24/06 02/08/06 02/21/06 03/14/06 03/28/06 04/18/0611/23/0612/06/0612/21/0601/09/07 01/24/07 02/28/07 03/13/07 03/27/07
a e r A
2
0 0 0 0 .
0 0.0000 0.2500 0.8690 0.4167 0.2262 0.0595 0.0238 0.0595 0.0000 0.0238 0.0238 0.0595 0.0595 0.2738 0.0238 0.0119
s2 0.8886 7.9465 5.0894 0.7314 0.1530 0.0476 0.1048 0.0476 0.0235 0.0808 0.0808 0.7073 0.0476 0.0119
=
I s2/ 3.5542 9.1439 12.2145 3.2334 2.5711 2.0000 1.7614 2.0000 0.9880 1.3566 1.3566 2.5830 2.0000 1.0000
I
δ 23.3171 10.3881 28.3765 23.4566 26.4444 84.0000 16.8000 84.0000 0.0000 8.4000 8.4000 6.9723 84.0000 X2IandI
δ 998.00** 758.94** 1013.80** 914.89** 313.00** 166.00** 146.20** 166.00** 82.00
S
N 112.60* 112.60* 214.39** 166.00**
x
C 0.0623** 0.1131** 0.3298** 0.0603** 0.1746** 1.0000** 0.1903** 1.0000** -0.0120 0.0891* 0.0891* 0.0719** 1.0000**
kmmt - 0.1067 0.0372 - - -
-By studying the fitting of adult data to Poisson’s dis-tribution, the chi-square test values were significant at 1% or 5% probability in 78% of the samplings in area 1 and 85% in area 2, indicating that their distribution was not random. As to the negative binomial distribution, 95% of the samplings fitted the distribution in area 1 and 100% of the samplings fitted the distribution in area 2 (Tables 5 and 6).
The younger the plant, the most frequent and in-tense its vegetative flushes, especially in periods of high moisture and high temperature; consequently, such plants become more attractive for adult feeding
s a e r
A Index 12/12/05 12/27/0501/11/06 01/24/06 02/08/06 02/21/06 03/14/0603/28/0604/18/06 05/18/06 06/20/0607/25/06 08/16/06 09/13/06 10/10/06 11/09/06 11/23/06
a e r A
1
3 7 2 7 .
1 2.5568 2.0455 1.3523 1.3182 0.7841 1.9205 3.7614 6.4205 1.5227 1.2841 1.0455 1.6250 0.0341 0.0909 0.1023 0.1136
s2 3.5569 9.2151 5.3772 5.0124 2.9551 1.9184 10.8557 13.2412 27.5798 8.0455 6.2747 3.5611 8.6279 0.0563 0.1066 0.1159 0.1019 =
I s2/ 2.0593 3.6041 2.6289 3.7067 2.2418 2.4466 5.6527 3.5203 4.2956 5.2836 4.8865 3.4063 5.3095 1.6513 1.1724 1.1328 0.8966
I
δ 1.6103 2.0114 1.7917 2.9956 1.9394 2.8508 3.4094 1.6645 1.5084 3.8020 4.0190 3.3005 3.6403 29.3333 3.1429 2.4444 0.0000 X2IandI
δ179.15** 313.56** 228.71** 322.47** 195.03** 212.85** 491.78** 306.26** 373.718**459.67** 425.12** 296.34** 461.92** 143.66** 102.00
S
N 98.55NS 78.00NS
x
C 0.0070** 0.0116** 0.0090** 0.0229** 0.0107** 0.0212** 0.0276**0.0076** 0.0058** 0.0322** 0.0347** 0.0264** 0.0303** 0.3256** 0.0246NS 0.0166NS -0.0115
kmmt 1.6306 0.9818 1.2558 0.4996 1.0615 0.5420 0.4128 1.4924 1.9482 0.3555 0.3304 0.4345 0.3771 - - -
-kmaxlklhd 2.0556 1.4661 1.2095 0.6267 1.1372 0.6424 0.6128 1.8030 1.9266 0.4895 0.7801 0.3423 0.5367 - - -
-x e d n I
s e t a D 6
0 / 6 0 / 2
1 12/21/0601/09/07 01/24/07 02/13/07 02/28/07 03/13/07 03/27/0704/17/07 05/22/07 06/19/0707/18/0708/20/07 09/21/07 10/31/07 11/14/07 11/28/07 1
4 8 7 .
0 1.1364 0.0909 0.0568 0.1932 0.2273 0.1136 0.1818 0.1932 0.6364 0.5909 0.2727 1.0682 2.2386 1.1364 4.0568 5.2500
s2 1.5505 2.1421 0.1066 0.0542 0.6634 0.2466 0.1479 0.4033 0.6864 0.8548 0.7732 0.3386 2.6390 5.4711 2.7858 21.8933 24.0057 =
I s2/ 1.9775 1.8851 1.1724 0.9540 3.4341 1.0851 1.3011 2.2184 3.5531 1.3432 1.3086 1.2414 2.4705 2.4440 2.4515 5.3967 4.5725
I
δ 2.2506 1.7778 3.1429 0.0000 14.2353 1.3895 3.9111 8.0667 14.8824 1.5429 1.5264 1.9130 2.3757 1.6409 2.2756 2.0745 1.6742 X2IandI
δ172.04** 164.00** 102.00
S
N 83.00NS 298.76** 94.40NS 113.20* 193.00** 309.11** 116.85* 113.84* 108.00NS 214.93** 212.62** 213.28** 469.50** 397.80**
x
C 0.0143** 0.0089** 0.0246NS -0.0115 0.1521** 0.0044NS 0.0334* 0.0812** 0.1595** 0.0062* 0.0060* 0.0104NS 0.0158** 0.0073** 0.0146** 0.0123** 0.0077**
kmmt 0.8021 1.2839 - - - 1.8543 1.9150 - 0.7264 1.5503 0.7829 0.9227 1.4695
kmaxlklhd 0.8600 1.2583 - - - 2.1216 1.8163 - 0.5484 1.1271 0.8377 0.9080 0.9080
x e d n I
s e t a D 5
0 / 2 1 / 2
1 12/27/05 1/11/06 1/24/06 2/08/06 2/21/06 3/14/06 3/28/06 4/18/06 5/18/06 06/20/06 7/25/06 8/16/06 9/13/06 10/10/06 11/09/06 11/23/06
a e r A
2
6 8 7 6 .
1 1.0476 1.3452 4.6905 5.5952 6.0119 3.6429 1.0000 1.1310 0.1190 0.4524 0.0476 0.0238 0.0833 0.0595 0.0595 0.0833
s2 6.4617 2.7447 4.0601 18.7223 32.7017 16.2288 11.0034 1.5422 1.9706 0.1543 0.6604 0.0459 0.0235 0.1014 0.0808 0.0567 0.1496 =
I s2/ 3.8495 2.6199 3.0181 3.9916 5.8446 2.6994 3.0206 1.5422 1.7424 1.2964 1.4597 0.9639 0.9880 1.2169 1.3566 0.9518 1.7952
I
δ 2.6894 2.5455 2.4956 1.6318 1.8574 1.2799 1.5499 1.5422 1.6555 3.7333 2.0313 0.0000 0.0000 4.0000 8.4000 0.0000 12.0000 X2IandI
δ319.51** 217.45** 250.50** 331.29** 485.09** 224.05** 250.70** 128.00** 144.62** 107.60* 121.15** 80.00
S
N 82.00NS 101.00NS 112.60* 79.00NS 149.00**
x
C 0.0203** 0.0186** 0.0180** 0.0076** 0.0103** 0.0033** 0.0066**0.0065** 0.0078**0.0329* 0.0124**-0.0120 -0.0120 0.0361NS 0.0891* -0.0120 0.1325**
kmmt 0.5891 0.6467 0.6666 1.5679 1.1550 3.5376 1.8029 1.8444 1.5233 - 0.9840 - - -
-kmaxlklhd 1.1358 0.7648 0.8021 1.7919 1.1474 3.7921 2.0636 1.6827 1.5606 - 0.8070 - - -
-x e d n I
s e t a D 6
0 / 6 0 / 2
1 12/21/06 1/09/07 1/24/07 2/13/07 2/28/07 3/13/07 3/27/07 4/17/07 5/22/07 6/19/07 7/18/07 8/20/07 9/21/07 10/31/07 0
9 1 1 .
0 0.2024 0.0119 0.1548 0.1667 0.1190 0.2381 0.2500 0.1310 0.0238 0.0357 0.0000 0.0238 0.0595 0.1310
s2 0.1302 0.2598 0.0119 0.1324 0.1647 0.1061 0.2318 0.3343 0.1634 0.0235 0.0349 0.0235 0.0808 0.1634
=
I s2/ 1.0940 1.2835 1.0000 0.8554 0.9880 0.8916 0.9735 1.3373 1.2475 0.9880 0.9759 0.9880 1.3566 1.2475
I
δ 1.8667 2.4706 0.0000 0.9231 0.0000 0.8842 2.4000 3.0545 0.0000 0.0000 0.0000 8.4000 3.0545 X2IandI
δ 90.80
S
N 106.52* 71.00NS 82.00NS 74.00NS 80.80NS 111.00* 103.54NS 82.00NS 81.00NS 82.00NS 112.60* 103.55NS
x
C 0.0104NS 0.0177* -0.0120 -0.0009 -0.0120 -0.0014 0.0168* 0.0247NS -0.0120 -0.0120 -0.0120 0.0891* 0.0247NS
kmmt - - -
-kmaxlklhd - - -
-= sample mean; s2= sample variance; I = variance/mean relationship; I
δ= index of Morisita; X2 I and Iδ= randomness deviations test; Cx = coefficient of Green; k mmt = k by the moments method; k max lklhd. = k by the maximum likelihood method; *Significant at 5% probability; **Significant at 1% probability; NS Non-significant at 5% probability.
Table 2 – Means, variances, and dispersion indices for the mean numbers of D. citri adults collected with traps in citrus orchards. Matão – SP, Brazil 2005/2006/2007.
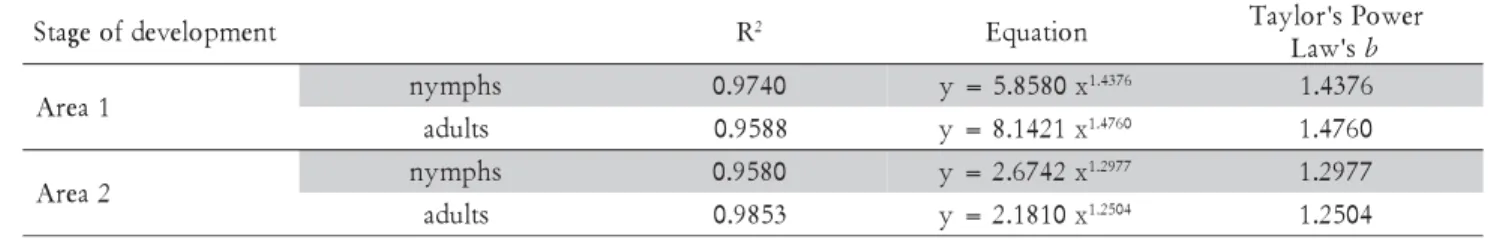
The values of Taylor’s Power Law’s b were greater than the unity, 1.4376 for nymphs and 1.4760 for adults in Area 1, and 1.2977 for nymphs and 1.2504 for adults in Area 2, showing aggregated distribution for both nymphs and adults of D. citri, with values of coeffi-cient of determination (R2) ranging from 0.9580 to
0.9853 (Table 8). Similar results were obtained by Sétamou et al. (2008), where the index obtained was 1.73 for nymphs and 1.38 for adults, and R2 higher than
0.90.
The fitting of most samplings to the negative bino-mial distribution is in accordance with the dispersion
indices tested, which had an aggregate distribution of D. citri in most samplings, both in area 1 with younger plants, and in area 2 with adult plants.Such distribu-tion was mendistribu-tioned by Tsai et al. (2000) in orange jes-samine plants (Murraya paniculata) in southern Florida, USA, and by Sétamou et al. (2008) in grapefruit (Citrus paradisi Macfad) and sweet oranges (Citrus sinensis (L). Osbeck) in Texas, USA, when the authors evaluated D. citri adults (both authors) and nymphs and eggs (the second author) and observed Taylor’s Power Law’s b and Iwao’s â coefficient values higher than one, indi-cating insect aggregation.
Table 3 – Results obtained by the chi-square test to fit Poisson and negative binomial distributions to data on numbers
of D. citri nymphs found in citrus shoots in area 1 (four years). Matão – SP, Brazil 2005/2006/2007.
X2 = Chi-square statistic; d.f. = number of degrees of freedom in the chi-square test; p = probability level of the chi-square test; *Significant at 5% probability; **Significant at 1% probability; NS Non-significant at 5% probability; IDF = insufficient degrees of
freedom.
e t a D
1 a e r A
n o s s i o
P Negativebinomial
X2 d.f. p X2 d.f. p
5 0 / 2 1 / 2
1 327.98** 5 <0.0001 16.27* 7 0.0228
5 0 / 7 2 / 2
1 339.72** 6 <0.0001 9.45NS 8 0.3057
6 0 / 1 1 / 1
0 119.09** 3 <0.0001 5.33NS 4 0.2547
6 0 / 4 2 / 1
0 1073.63** 9 <0.0001 20.05* 8 0.0101
6 0 / 1 2 / 2
0 36.83** 2 <0.0001 4.31NS 3 0.2293
6 0 / 4 1 / 3
0 12.27** 1 0.0004 IDF IDF IDF
6 0 / 8 1 / 4
0 128.02** 3 <0.0001 3.38NS 1 0.0659
6 0 / 6 0 / 2
1 18.92** 1 <0.0001 IDF IDF IDF
7 0 / 9 0 / 1
0 5.11* 1 0.0237 2.08NS 7 0.9552
7 0 / 4 2 / 1
0 9.48** 1 0.0021 2.42NS 2 0.2979
7 0 / 8 2 / 2
0 15.56** 1 <0.0001 2.28NS 2 0.3187
7 0 / 3 1 / 3
0 16.63** 1 <0.0001 1.39NS 1 0.2381
Table 4 – Results obtained by the chi-square test to fit Poisson and negative binomial distributions to data on numbers
of D. citri nymphs found in citrus shoots in area 2 (12 years). Matão – SP, Brazil 2005/2006/2007.
X2 = Chi-square statistic; d.f. = number of degrees of freedom in the chi-square test; p = probability level of the chi-square test; * Significant at 5% probability; ** Significant at 1% probability; NS Non-significant at 5% probability; IDF = insufficient degrees of
freedom
e t a D
2 a e r A n
o s s i o
P Negativebinomial
X2 d.f. p X2 d.f. p
6 0 / 1 1 / 1
0 22.86** 1 <0.0001 IDF IDF IDF
6 0 / 4 2 / 1
0 127.67** 3 <0.0001 5.78NS 2 0.0553
6 0 / 8 0 / 2
0 22.77** 1 <0.0001 0.45NS 1 0.4995
6 0 / 1 2 / 2
0 20.01** 1 <0.0001 IDF IDF IDF
7 0 / 8 2 / 2
Table 6 – Results obtained by the chi-square test to fit Poisson and negative binomial distributions to data on numbers
of D. citri adults collected in traps in citrus orchards in area 2 (12 years). Matão – SP, Brazil 2005/2006/2007.
X2 = Chi-square statistic; d.f. = number of degrees of freedom in the chi-square test; p = probability level of the chi-square test; *Significant at 5% probability; **Significant at 1% probability; NS Non-significant at 5% probability; IDF = insufficient degrees of
freedom. e t a D 2 a e r A n o s s i o
P Negativebinomial
X2 d.f. p X2 d.f. p
5 0 / 2 1 / 2
1 24.39** 4 <0.0001 7.74NS 6 0.2573
5 0 / 7 2 / 2
1 17.23** 3 0.0006 3.68NS 4 0.451
6 0 / 1 1 / 1
0 38.08** 4 <0.0001 10.52NS 5 0.0618 6 0 / 4 2 / 1
0 120.40** 8 <0.0001 11.02NS 12 0.527 6 0 / 8 0 / 2
0 371.02** 10 <0.0001 16.10NS 14 0.3069 6 0 / 1 2 / 2
0 144.77** 10 <0.0001 20.84NS 13 0.0761 6 0 / 4 1 / 3
0 81.96** 8 <0.0001 7.49NS 10 0.6779 6 0 / 8 2 / 3
0 12.34** 3 0.0063 1.11NS 3 0.7739
6 0 / 8 1 / 4
0 8.90* 3 0.0306 2.07NS 4 0.722
6 0 / 0 2 / 6
0 4.40* 1 0.0358 0.59NS 1 0.439
6 0 / 1 2 / 2
1 5.93* 1 0.0149 IDF IDF IDF
7 0 / 3 1 / 3
0 0.00NS 1 0.9448 IDF IDF IDF
7 0 / 7 2 / 3
0 2.67NS 1 0.1019 IDF IDF IDF
Table 5 – Results obtained by the chi-square test to fit Poisson and negative binomial distributions to data on numbers
of D. citri adults collected in traps in citrus orchards in area 1 (four years). Matão – SP, Brazil 2005/2006/2007.
X2 = Chi-square statistic; d.f. = number of degrees of freedom in the chi-square test; p = probability level of the chi-square test; * Significant at 5% probability; ** Significant at 1% probability; NS Non-significant at 5% probability; IDF = insufficient degrees of
freedom. e t a D 1 a e r A n o s s i o
P Negativebinomial
X2 d.f. p X2 d.f. p
5 0 / 2 1 / 2
1 7.28NS 4 0.1214 4.91NS 5 0.4262
5 0 / 7 2 / 2
1 57.59** 6 <0.0001 16.80* 8 0.0322
6 0 / 1 1 / 1
0 44.15** 5 <0.0001 6.86NS 7 0.4432
6 0 / 4 2 / 1
0 40.38** 4 <0.0001 1.91NS 5 0.8607
6 0 / 8 0 / 2
0 15.48** 3 0.0014 3.93NS 5 0.5585
6 0 / 1 2 / 2
0 10.81** 2 0.0045 1.46NS 3 0.6914
6 0 / 4 1 / 3
0 69.58** 5 <0.0001 8.07NS 7 0.3261
6 0 / 8 2 / 3
0 93.47** 8 <0.0001 11.03NS 10 0.3548 6 0 / 8 1 / 4
0 228.93** 10 <0.0001 17.58NS 15 0.2851 6 0 / 8 1 / 5
0 75.13** 4 <0.0001 5.06NS 6 0.5351
6 0 / 0 2 / 6
0 20.56** 3 0.0001 2.98NS 4 0.5602
6 0 / 5 2 / 7
0 62.58** 3 <0.0001 8.77NS 5 0.1186
6 0 / 6 1 / 8
0 60.41** 4 <0.0001 6.60NS 6 0.3594
6 0 / 6 0 / 2
1 8.48* 2 0.0144 0.48NS 3 0.9214
6 0 / 1 2 / 2
1 14.70** 3 0.0021 1.82NS' 4 0.7687
7 0 / 3 1 / 2
0 3.20NS 1 0.0734 IDF IDF IDF
7 0 / 8 2 / 2
0 0.80NS 1 0.3701 IDF IDF IDF
7 0 / 7 2 / 3
0 1.98NS 1 0.1591 IDF IDF IDF
7 0 / 7 1 / 4
0 6.83** 1 0.0090 IDF IDF IDF
7 0 / 2 2 / 5
0 2.04NS 2 0.3591 0.19NS 2 0.9069
7 0 / 9 1 / 6
0 3.70NS 2 0.1567 0.06NS 1 0.8024
7 0 / 8 1 / 7
0 6.18* 1 0.0129 IDF IDF IDF
7 0 / 0 2 / 8
0 38.31** 3 <0.0001 6.75NS 5 0.2394
7 0 / 1 2 / 9
0 68.15** 5 <0.0001 10.46NS 7 0.1636 7 0 / 1 3 / 0
1 16.50** 3 0.0009 3.32NS 4 0.5053
7 0 / 4 1 / 1
1 284.60** 8 <0.0001 3.68NS 12 0.9884 7 0 / 8 2 / 1
t n e m p o l e v e d f o e g a t
S k
c
s ' t s e t y t i e n e g o m o H
X2 TestF
/ 1 k
F t s e T
n o i t c e s r e t n i s
h p m y
n 0.0736 88.51** 31.09** 0.28NS
s t l u d
a 1.0890 265.98** 51.36** 0.59NS
Table 7 – Common k indices for nymphs and adults of D. citri in citrus orchards. Matão – SP, Brazil 2005/2006/2007.
X2 = Chi-square statistic; *Significant at 5% probability; **Significant at 1% probability; NSNon-significant at 5% probability.
Table 8 – Taylor’s Power Law for the average numbers of nymphs and adults of D. citri in citrus orchards. Matão - SP. Brazil 2005/2006/2007.
t n e m p o l e v e d f o e g a t
S R2 Equation Taylor'sPower
s ' w a L b
1 a e r
A nymphs 0.9740 y=5.8580x
6 7 3 4 .
1 1.4376
s t l u d
a 0.9588 y=8.1421x1.4760 1.4760
2 a e r
A nymphs 0.9580 y=2.6742x
7 7 9 2 .
1 1.2977
s t l u d
a 0.9853 y=2.1810x1.2504 1.2504
Acknowledgements
To Capes for awarding a doctoral scholarship to the first author. To Marchesan farm for making the experi-ment area available. To Fundecitrus for providing finan-cial support and help in the conduction of the experi-ment.
References
Anscombe, F.J. 1949. The statistical analysis of insect counts based on the negative binomial distributions. Biometrics 5: 165-173. Barbosa, J.C.; Perecin, D. 1982. Probabilistic models for
distributions of Spodoptera frugiperda (J. E. Smith, 1797), in maize. Científica 10: 181-191. (in Portuguese, with abstract in English). Bliss, C.I.; Fisher, R.A. 1953. Fitting the negative binomial to biological data, note on the efficient fitting of the negative binomial. Biometrics 9: 176-200.
Bliss, C.I.; Owen, A.R.G. 1958. Negative binomial distributions with a common k. Biometrika 45: 37-58.
Capoor, S.P.; Rao D.G.; Viswanath, S.M. 1967. Diaphorina citri Kuway., a vector of the greening disease of citrus in India. Indian Journal of Agricultural Science 37: 572-576.
Coletta-Filho, H.D.; Targon, M.L.P.N.; Takita, M.A.; De Negri, J.D.; Pompeu Jr., J.; Machado, M.A. 2004. First report of the causal agent of huanglongbing (“Candidatus Liberibacter asiaticus”) in Brazil. Plant Disease 88: 1382.
Costa, M.G.; Barbosa, J.C.; Yamamoto, P.T. 2006. Probality distribution of Orthezia praelonga Douglas (Hemiptera: Sternorrhyncha: Ortheziidae) in citrus. Neotropical Entomology 35: 395-401. (in Portuguese, with abstract in English).
Davis, P.M. 1993. Statistics for describing populations. p. 33-54 In: Pedigo, L.P.; Buntin, G.D. Handbook of sampling methods for arthropods in agriculture. CRC Press, Boca Raton, FL, USA. Elliott, J.M. 1979. Some Methods for the Statistical Analysis of
Samples of Benthic Invertebrates. Freshwater Biological Association, Ambleside, Cumbria, England.
Farias, P.R.S.; Barbosa, J.C.; Busoli, A.C. 2001. Spatial distribution of the fall armyworm Spodoptera frugiperda (J.E. Smith) (Lepidoptera: Noctuidae) on corn crop. Neotropical Entomology 30: 681-689. (in Portuguese, with abstract in English).
Gallo, D.; Nakano, O.; Silveira Neto, S.; Carvalho, R.P.L.; Batista, G.C. de; Berti Filho, E.; Parra, J.R.P.; Zucchi, R.A.; Alves, S.B.; Vendramim, J.D.; Marchini, L.C.; Lopes, J.R.S.; Omoto, C. 2002. Agricultural Entomology. FEALQ, Piracicaba, SP, Brazil. (in Portuguese).
Gravena, S. 2005. Practical Handbook of Ecological Management of Citrus Pests. Gravena, Jaboticabal, SP, Brazil. (in Portuguese).
Green, R.H. 1966. Measurement of non-randomness in spatial distributions. Researches on Population Ecology 8: 1-7. Halbert, S.E.; Manjunath, K.L. 2004. Asian citrus psyllids
(Sternorryncha: Psyllidae) and greening disease of citrus: a literature review and assessment of risk in Florida. Florida Entomologist 87: 330-353.
Hall, D.G.; Hentz, M.G.; Ciomperlink, M.A. 2007. A comparision of traps and stem tap sampling for monitoring adult Asian citrus psyllid (Hemiptera: Psyllidae) in citrus. Florida Entomologist 90: 327-334.
Maruyama, W.I.; Barbosa, J.C.; Fernandes, M.G.; Yamamoto, P.T. 2002. Spatial distribution of Dilobopterus costalimai Young (Hemiptera:Cicadellidae) in citrus área of Taquaritinga, São Paulo State, Brazil. Neotropical Entomology 31; 35-40. (in Portuguese, with abstract in English).
Morisita, M. 1962. Id-index, a measure of dispersion of individuals. Researches on Population Ecology 4: 1-7.
Perecin, D.; Barbosa, J.C. 1992. Sampling and statistical analysis of discrete contagious distributions. Revista de Matemática e Estatística 10: 207-216. (in Portuguese, with abstract in English).
Perruso, J.C.; Cassino, P.C.R. 1997. Presence-absence sampling plan for Selenaspidus articulatus (Morg.) (Homoptera: Diaspididae) on citrus. Anais da Sociedade Entomológica do Brasil 26: 321-326. (in Portuguese, with abstract in English).
Rabinovich, J.E. 1980. Introduction to the ecology of animal populations. Editorial Continental, Ciudad de México, México. (in Spanish).
Sétamou, M.; Flores, D.; French, J.V.; Hall, D.G. 2008. Dispersion patterns and samplings plans for Diaphorina citri (Hemiptera: Psyllidae) in citrus. Journal of Economic Entomology 101: 1478-1487.
Southwood, T.R.E. 1978. Ecological Methods. John Wiley, New York, NY, USA.
Teixeira, D.C.; Ayres, A.J.; Kitajima, E.W.; Tanaka, F.A.O.; Danet, L.; Jagoueix-Eveillard, S.; Saillard, C.; Bové, J.M. 2005a. First report of a huanglongbing-like disease of citrus in São Paulo state, Brazil and association of a new Liberibacter species, “Candidatus Liberibacter americanus” with the disease. Plant Disease 89: 107.
Teixeira, D.C.; Danet, J.L.; Eveillard, S.; Martins, E.C.; Junior, W.C.J.; Yamamoto, P.T.; Lopes, S.A.; Bassanezi, R.B.; Ayres, A.J.; Saillard, C.; Bové, J.M. 2005b. Citrus huanglongbing in São Paulo state, Brazil: PCR detection of the ‘Candidatus’ Liberibacter species associated with the disease. Molecular and Cellular Probes 19: 173-179.
Tsai, J.H.; Wang, J.; Liu, Y. 2000. Sampling of Diaphorina citri (Homoptera: Psyllidae) on orange Jessamine in southern Florida. Florida Entomologist 83: 446-459.
Yamamoto, P.T.; Paiva, P.E.B.; Gravena, S. 2001. Population dynamics of Diaphorina citri Kuwayama (Hemiptera: Psyllidae) in citrus orchards in the North of São Paulo State, Brazil. Neotropical Entomology 30: 165-170. (in Portuguese, with abstract in English).