Arachidonic acid triggers an oxidative
burst in leukocytes
1National Cancer Institute, National Institutes of Health, Frederick, MD, USA 2Laboratório de Fisiologia Celular, Departamento de Fisiologia e Biofísica,
Instituto de Ciências Biomédicas, Universidade de São Paulo, São Paulo, SP, Brasil C. Pompéia1,
M.F. Cury-Boaventura2
and R. Curi2
Abstract
The change in cellular reducing potential, most likely reflecting an oxidative burst, was investigated in arachidonic acid- (AA) stimulated leukocytes. The cells studied included the human leukemia cell lines HL-60 (undifferentiated and differentiated into macrophage-like and polymorphonuclear-like cells), Jurkat and Raji, and thymocytes and macrophages from rat primary cultures. The oxidative burst was assessed by nitroblue tetrazolium reduction. AA increased the oxida-tive burst until an optimum AA concentration was reached and the burst decreased thereafter. In the leukemia cell lines, optimum con-centration ranged from 200 to 400 µM (up to 16-fold), whereas in rat cells it varied from 10 to 20 µM. Initial rates of superoxide generation were high, decreasing steadily and ceasing about 2 h post-treatment. The continuous presence of AA was not needed to stimulate superox-ide generation. It seems that the NADPH oxidase system participates in AA-stimulated superoxide production in these cells since the oxidative burst was stimulated by NADPH and inhibited by N-ethylmaleimide, diphenyleneiodonium and superoxide dismutase. Some of the effects of AA on the oxidative burst may be due to its detergent action. There apparently was no contribution of other super-oxide-generating systems such as xanthine-xanthine oxidase, cyto-chromes P-450 and mitochondrial electron transport chain, as as-sessed by the use of inhibitors. Eicosanoids and nitric oxide also do not seem to interfere with the AA-stimulated oxidative burst since there was no systematic effect of cyclooxygenase, lipoxygenase or nitric oxide synthase inhibitors, but lipid peroxides may play a role, as indicated by the inhibition of nitroblue tetrazolium reduction pro-moted by tocopherol.
Correspondence
C. Pompéia
National Cancer Institute National Institutes of Health Bldg 560, Rm 31-76 P.O. Box B Frederick, MD 21702 USA
Fax: +1-301-846-7042 E-mail: pompeiac@ncifcrf.gov
Research supported by FAPESP, CNPq, CAPES, PRONEX and the British Council.
Received October 15, 2002 Accepted June 30, 2003
Key words
•Arachidonic acid •NADPH oxidase
•Nitroblue tetrazolium
•Leukocytes
•Reactive oxygen species
Introduction
Arachidonic acid (AA) is an essential polyunsaturated fatty acid which is the pre-cursor of eicosanoids. These products are important in many processes, such as inflam-mation and healing, labor and control of
production, surface molecule expression, leu-kocyte migration, and antigen presentation (1). One of the known mechanisms of action of AA is stimulating the generation of super-oxide, which acts as a microbicidal agent in phagocytes and as a second messenger in many cell types (2,3). Such AA-triggered superoxide production might also explain the cytotoxicity of AA (4,5).
Superoxide may be generated by various systems, among which the most common are: NADPH oxidase, mitochondrial elec-tron transport chain, xanthine-xanthine dase, and cytochromes P-450. NADPH oxi-dase is a protein complex that is found to be dissociated when the enzyme is inactive. NADPH oxidase activation is promoted by the phosphorylation of a cytoplasmic pro-tein, p47 phox, by protein kinase C (PKC, ATP phosphotransferase, EC 2.7.1.37). Upon phosphorylation, p47 phox promotes the as-sociation of the NADPH oxidase subunits on the membrane and the activation of superox-ide generation. Most membrane-bound NADPH subunits are found in intracellular granules into which superoxide is driven. Alternatively, NADPH oxidase-containing granules join with phagocytic vacuoles, ex-posing their contents to superoxide. Finally, granules may migrate to the cell surface and release superoxide into the extracellular en-vironment (6).
The mitochondrion is also considered to be an important site for superoxide genera-tion, which occurs mostly by the univalent reduction of oxygen in complexes I and III of the electron transport chain (3). The mito-chondrial generation of superoxide can be assessed by the addition of uncouplers, hy-perpolarizing agents and inhibitors of the respiratory chain (3).
The xanthine-xanthine oxidase superox-ide-generating system is activated in cells suffering oxidative stress, when xanthine dehydrogenase, which reduces NAD to NADH, is changed into xanthine oxidase (xanthine:oxygen oxidoreductase, EC
1.1.3.222) which, instead of NAD, reduces oxygen to superoxide (3,7). The cytochrome P-450 complex is a family of enzymes that mediate oxidation-reduction reactions, some of which involve AA oxidation and superox-ide generation (8).
The AA-triggered increase in reducing power, which we attribute mostly to oxida-tive burst (superoxide production) in leuko-cytes, was assessed by the nitroblue tetrazo-lium (NBT) method. The following cell lines were studied: human promyelocytic leuke-mia (HL-60, undifferentiated and differenti-ated into macrophage-like and polymorpho-nuclear- (PMN) like cells), human T-cell leukemia (Jurkat), and human B-cell leuke-mia (Raji). Thymocytes and macrophages were obtained from rat primary cultures. The pathways of the oxidative burst triggered by AA were evaluated pharmacologically by pretreatment of cells with stimulators or in-hibitors of superoxide-generating systems and of AA metabolism.
Material and Methods
Reagents
Superoxide dismutase (SOD) was ob-tained from Boehringer (Mannheim, Ger-many), and cell culture medium, antibiotics and fetal calf serum were obtained from Gibco-BRL Life Technologies (Grand Is-land, NY, USA). All other reagents and drugs were obtained from Sigma (St. Louis, MO, USA). All agents were dissolved in ethanol, unless otherwise indicated.
Cell culture
gluta-mine, 20 mM HEPES, 10% fetal calf serum, 10 U/ml penicillin G and 10 µg/ml strepto-mycin. The cell population was maintained between 1 x 10⁵ and 1 x 10⁶ cells/ml
(loga-rithmic phase of cell growth).
HL-60 cells were induced to differentiate into PMN upon treatment with 100 nM
all-trans retinoic acid for 5 days. Differen-tiation of HL-60 cells into macrophage-like cells was induced by treatment with 100 nM phorbol 12-myristate 13-acid (PMA) for 48 h.
Rat thymocytes and macrophages were obtained from male albino rats weighing 200 g, bred in the Institute of Biomedical Sciences, University of São Paulo, and killed by decapitation. Macrophages were obtained from the peritoneal cavity upon injection of PBS (10 mM NaH2PO4/Na2HPO4, 0.138 mM
NaCl, 268 mM KCl, pH 7.4). The rat thy-muses were removed and sheared in PBS to obtain thymocytes. Cells were then filtered through lens cleaning paper, washed twice in PBS and collected by centrifugation. Ani-mal manipulation followed a protocol ap-proved by the Ethics Committee on the Use and Care of Animals of the Institute of Bio-medical Sciences, University of São Paulo.
Oxidative burst measurement - nitroblue tetrazolium reduction assay
Oxidative burst was evaluated by reduc-tion of NBT, a yellow water-soluble powder that becomes blue and insoluble upon reduc-tion. Cells (1 x 10⁷/ml - 150 µl) were
incu-bated for 1 h in 0.05% NBT in PBSG solu-tion: 0.13 mM NaCl, 2.7 mM KCl, 0.6 mM CaCl2, 1.0 mM MgCl2, 5 mM glucose and 10
mM NaH2PO4/Na2HPO4, pH 7.4. The
reac-tion was stopped by the addireac-tion of 1 volume glacial acetic acid. After cell centrifugation (1 min, 12,000 g), reduced NBT was solubi-lized in 150 µl 50% acetic acid by sonication (1 pulse of 5 s; Sonics and Materials, Newtown, CT, USA). Cell debris were pelleted and the absorbance of the
superna-tant was determined at 560 nm in a micro-titer plate reader (Spectramax plus, Molecu-lar Devices, Sunnyvalle, CA, USA).
Alternative protocols used for measure-ment of superoxide production were as fol-lows: a) cells were preincubated for 30 min with various substances, ethanol or DMSO (controls) prior to the addition of NBT; b) kinetic studies were performed by collecting cells at different times after NBT addition; c) cells were preincubated for 15 min with AA or ethanol, centrifuged and then exposed to NBT; d) in vitro NBT reduction was assayed using 15 U/ml of xanthine oxidase and dif-ferent concentrations of xanthine; e) assays carried out with phloretin were only incu-bated for 20 min with NBT. The reactions were developed in PBSG solution (150 µl) at room temperature for 10 min. Precipitated NBT was centrifuged and extracted with 50% acetic acid by sonication. After cen-trifugation, the absorbance of the superna-tant was determined spectrophotometrically at 560 nm. The values indicated correspond to the absorbances.
Statistical analysis
Comparisons were performed by the Stu-dent t-test, with the level of significance set at 0.05. Results are reported as means ± SD.
Results
Nitroblue tetrazolium reduction by arachidonic acid in different cell lines
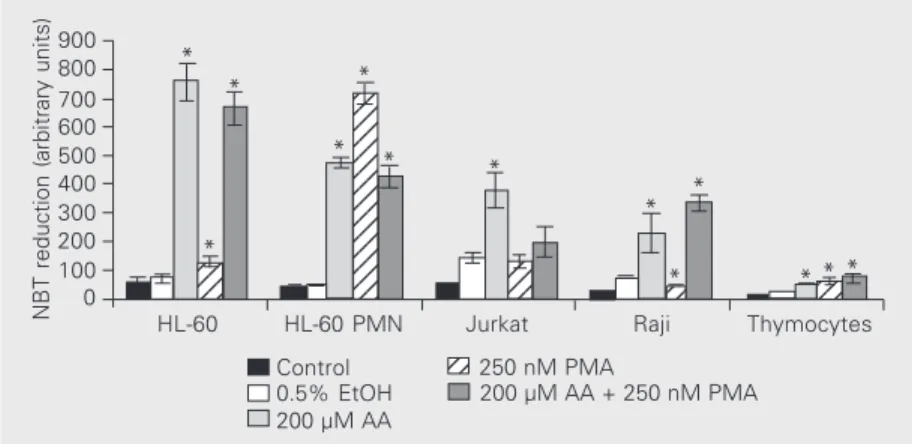
effect in rat thymocytes, undifferentiated and PMN-like HL-60 cells, although the re-sponse was most striking in PMN-like HL-60 cells (18-fold increase) compared to the more subtle 2-fold increase in HL-60 and thymus cells. The combined treatment of cells with AA and PMA tended to decrease the effect of these agents when added sepa-rately. This can be observed in undifferenti-ated HL-60 and Jurkat cells, in which PMA reduced the effect of AA, and in PMN-like differentiated HL-60 cells, in which com-bined treatment with AA and PMA reduced both the individual effect of AA and that of PMA. In contrast, the combination of AA and PMA increased NBT reduction in Raji and rat thymocytes.
Experiments were also performed with rat macrophages and macrophage-like dif-ferentiated HL-60 cells (data not shown). PMA tripled NBT reduction in rat macro-phages, but had only a slight effect on mac-rophage-like HL-60 cells, which was not
always reproducible, probably due to the fact that differentiation occurs by cell treatment with PMA, which may saturate or even down-regulate the cellular response to this agent after differentiation is completed.
Control data (filled black columns) in Figure 1 correspond to absorbances of cells killed with acetic acid and therefore exclu-sively refer to the presence of the cells and the background reduction of NBT. The low-est value corresponded to thymocytes, even when they were added at four times the concentration of the cells used in the other assays. This probably reflects reduced mem-brane surface and cytoplasmic volume, where superoxide is generated. The white column in Figure 1 corresponds to the baseline re-duction of NBT by live cells incubated only with 0.5% ethanol (EtOH). Although all val-ues in the second column were increased when compared with the first, showing that a slight reduction of NBT was continuously occurring in live cells, this baseline reduc-tion was far greater in Jurkat cells. In order to simplify the analysis in subsequent assays, an arbitrary value of 1 was attributed to all baseline values obtained by incubating cells only with ethanol and the corresponding val-ues were expressed relative to this baseline.
Dose-effect plots for arachidonic acid-induced nitroblue tetrazolium reduction
NBT reduction promoted by AA peaked around 200-400 µM for leukemia cell lines and around 10-20 µM for normal rat cells (Figure 2). This pattern was also found in PMN-like differentiated HL-60 cells, with a peak value around 400 µM (data not shown), but differed greatly from that of macrophage-like differentiated HL-60 cells, which showed increasing NBT reduction up to the highest concentration tested - 800 µM (0 µM, 1; 100 µM, 2.0; 200 µM, 4.0; 400 µM, 8.0, and 800 µM, 18.2). These data were obtained with a mean of three replicates per AA concentra-tion reported as arbitrary units.
NBT reduction (arbitrary units)
900
123 123 123
123 123 123 123 123 123 123 123 123 123 123 123 123 123
12 12 12
12 12
800 700 600 500 400 300 200 100 0
HL-60 HL-60 PMN Jurkat Raji Thymocytes
123 123
* *
*
* *
* *
* *
* * * *
Control 0.5% EtOH 200 µM AA
200 µM AA + 250 nM PMA
12
12250 nM PMA
Figure 1. Nitroblue tetrazolium (NBT) reduction following cell exposure to arachidonic acid (AA) or phorbol 12-myristate 13-acid (PMA). Cells (1 x 10⁷/ml, 150 µl; 6 samples each) were treated for 1 h with 0.05% NBT in PBSG (0.13 mM NaCl, 2.7 mM KCl, 0.6 mM CaCl2, 1.0 mM MgCl2, 5 mM glucose and 10 mM NaH2PO4/Na2HPO4, pH 7.4) and 0.5% ethanol (EtOH), 200 µM AA, 250 nM PMA or a combination of the last two agents, at 37ºC. A sample (control) was treated with acetic acid (0.5 volumes) prior to incubation. NBT reduction in the remaining samples was stopped with 0.5 volumes acetic acid after incubation. Cells were then pelleted and reduced NBT was extracted with 150 µl 50% acetic acid upon sonication. After debris sedimentation, reduced NBT absorption was determined at 560 nm. Results are reported as mean ± SD absorbance. Cell lines tested were: HL-60 (human promyelo-cytic leukemia), both in the undifferentiated form or after differentiation into polymorpho-nuclear- (PMN) like cells upon treatment with 100 nM all-trans retinoic acid for 5 days; Jurkat (human T-cell leukemia) and Raji (human B-cell leukemia). Thymocytes were obtained from male albino rats using 4 x 10⁷ cells/ml. *P < 0.05 compared to ethanol-treated cells (Student
Kinetics of arachidonic acid-induced nitroblue tetrazolium reduction
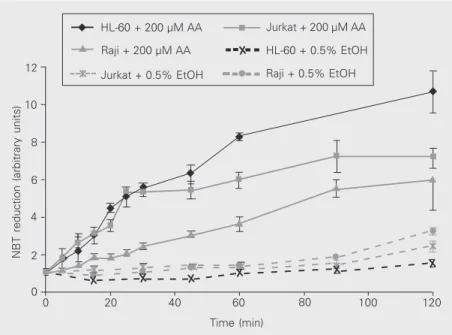
AA initially triggered NBT reduction at a high rate, which continuously decreased, reaching zero about 2 h after cell exposure to the acid (Figure 3). Baseline NBT reduction, on the other hand, still seemed to occur even after 2 h, although at much lower rates than for AA. Most experiments presented in this paper were performed after incubation with NBT for 1 h.
Cell pretreatment with AA triggered NBT reduction even after AA was washed out, particularly in Jurkat cells, although the pres-ence of AA together with NBT usually led to higher NBT reduction levels (Figure 4).
Mechanisms of arachidonic acid-induced nitroblue tetrazolium reduction
The results presented in Tables 1 and 2 and Figures 5 and 6 correspond to cellular pretreatments with agents that interfere with the NADPH oxidase system. Two inhibitors of NADPH oxidase were used: N-ethylmale-imide (NEM), an agent that acts on protein sulfhydryl groups, and diphenyleneiodonium (DPI), a flavin antagonist (6). NEM showed dose-dependent inhibition of NBT reduction in all cell types tested, both in control and AA-treated cells, although inhibition was greater in the latter (data not shown).
DPI also prevented AA-triggered NBT reduction, but this effect was not as pro-nounced as that of NEM and occurred mostly in undifferentiated and PMN-like HL-60 cells (Table 1, lines 2 and 6). In addition to the data shown in Table 1, DPI also inhibited the oxidative burst in AA-stimulated rat thy-mocytes and macrophage-like differentiated HL-60 cells (control and AA-stimulated cells) (data not shown). The inhibitory effect of DPI was compared in cells subjected to dif-ferent stimuli and was found to be more marked on NBT reduction promoted by PMA and Triton X-100 than by stimulation with
12
10
8
6
4
2
0
0 20 40 60 80 100 120
Time (min)
NBT reduction (arbitrary units)
HL-60 + 0.5% EtOH
Raji + 0.5% EtOH
Figure 3. Kinetics of baseline nitroblue tetrazolium (NBT) reduction and of NBT reduction stimulated with arachidonic acid (AA) in leukemia cell lines. The experimental conditions are the same as those described in the legend to Figure 1. Cells were treated for different periods of time with 0.5% ethanol (EtOH) or 200 µM AA. Results are reported as mean ± SD relative absorbance in relation to the value at time zero. The number of samples was 4-5. Figure 2. Nitroblue tetrazolium (NBT) reduction induced by different arachidonic acid concentrations. The experimental conditions are the same as those described in the legend to Figure 1. Results are reported as mean ± SD relative absorbance in relation to the value at time zero. The number of samples is indicated by N.
NBT reduction (arbitrary units)
18
16
14
12
10
8
6
4
2
0
0 50 100 150 200 250 300 350 400 450 500 550 600 650 Arachidonic acid (µM)
HL-60 (N = 5) Raji (N = 5) Lymphocytes (N = 6)
Jurkat (N = 5) Macrophages (N = 6)
AA (Table 1, lines 2, 4, 6, 7, 10, 11, 13, 14). The cell type most inhibited by DPI was PMN-differentiated HL-60, particularly upon stimulation with PMA (Table 1, line 7).
To determine whether superoxide was
HL-60 + 200 µM AA
Raji + 200 µM AA
Jurkat + 0.5% EtOH
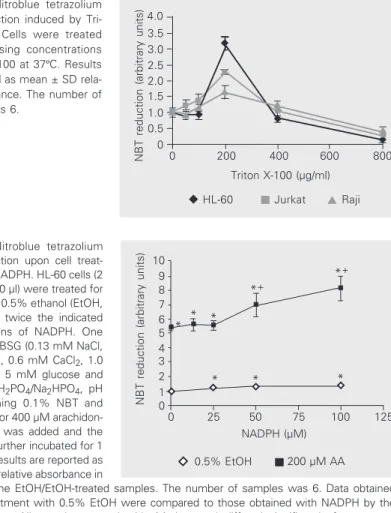
being released into the extracellular environ-ment, the effect of SOD on AA-triggered NBT reduction was investigated. SOD had little effect on AA-induced NBT reduction in HL-60 cells and no effect on Raji and Jurkat oxidative burst (Table 1, column 2). In rat thymocytes, SOD inhibited control (0.5% EtOH, 1.00 ± 0.19; 0.5% EtOH + 100 µM SOD, 0.74 ± 0.11; N = 5) and AA-stimulated NBT reduction (20 µM AA, 1.77 ± 0.11; 20 µM AA + 100 µM SOD, 1.26 ± 0.07; N > 4). In macrophage-like differentiated HL-60 cells, SOD also inhibited both control (0.5% EtOH, 1.00 ± 0.07; 0.5% EtOH + 100 µM SOD, 0.71 ± 0.09; N = 5) and AA-stimulated NBT reduction (400 µM AA, 5.3 ± 0.4; 400 µM AA + 100 µM SOD, 4.6 ± 0.4; N = 5). In contrast to the results obtained upon cell stimulation with AA, SOD was particularly effective in inhibiting NBT reduction trig-gered by other stimuli, such as PMA or Triton X-100, although this effect could only be found in undifferentiated and PMN-differ-entiated HL-60 cells (Table 1, lines 3, 4, 7, 8). Triton X-100 was used to determine whether AA was acting as a detergent. In this case, we expected that the effect of AA- and Triton X-100-treated cells would be the same. Triton X-100 stimulated the oxidative burst (Figure 5). The shapes of these dose-response plots are comparable to those obtained by cell stimulation with AA, i.e., they reach a peak at an optimum concentration and then decline, which suggests that AA might be acting as a detergent. Similar patterns of response were also found with other deter-gents, such as Nonidet, Tween 20 and Tween 80 (data not shown). Up to 200 µM, Triton X-100 treatment did not cause extensive ly-sis and cells maintained their shape, although they became permeable to Trypan blue and propidium iodide (data not shown). The de-tergent probably acts preferentially on some cell microenvironments, without affecting others. This could explain the fact that, al-though Triton X-100 can stimulate superox-ide generation, this effect is not reversed by
Table 1. Inhibition of nitroblue tetrazolium reduction by superoxide dismutase and diphenyleneiodonium.
0.5% EtOH 100 µg/ml SOD 10 µM DPI
HL-60 + 0.5% EtOH 1.00 ± 0.17 0.77 ± 0.13* 0.69 ± 0.08* HL-60 + 200 µM AA 3.01 ± 0.20 2.62 ± 0.18* 1.03 ± 0.12* HL-60 + 250 nM PMA 1.87 ± 0.22 1.10 ± 0.09* 0.81 ± 0.08* HL-60 + 160 µg/ml Triton X-100 3.94 ± 0.39 1.21 ± 0.09* 0.95 ± 0.10* PMN + 0.5% EtOH 1.00 ± 0.23 0.73 ± 0.15* 0.44 ± 0.11* PMN + 200 µM AA 10.90 ± 1.39 11.77 ± 0.75 3.05 ± 0.45* PMN + 250 nM PMA 5.71 ± 0.35 3.97 ± 0.18* 1.11 ± 0.11* PMN + 160 µg/ml Triton X-100 2.26 ± 0.38 1.51 ± 0.20* 0.75 ± 0.15* Jurkat + 0.5% EtOH 1.00 ± 0.09 0.88 ± 0.08* 0.62 ± 0.03* Jurkat + 200 µM AA 5.18 ± 0.33 5.70 ± 0.48* 4.78 ± 0.20* Jurkat + 160 µg/ml Triton X-100 2.54 ± 0.30 2.21 ± 0.32 1.79 ± 0.11* Raji + 0.5% EtOH 1.00 ± 0.14 0.83 ± 0.09* 0.79 ± 0.08* Raji + 200 µM AA 4.03 ± 0.31 4.13 ± 0.21 3.30 ± 0.32* Raji + 160 µg/ml Triton X-100 2.55 ± 0.47 2.38 ± 0.48 1.80 ± 0.13*
Cells (2 x 10⁷/ml, 150 µl) in PBSG (0.13 mM NaCl, 2.7 mM KCl, 0.6 mM CaCl 2, 1.0 mM MgCl2, 5 mM glucose and 10 mM NaH2PO4/Na2HPO4, pH 7.4) were treated for 30 min with 0.5% ethanol (EtOH), 200 µg/ml bovine CuZn-superoxide dismutase (SOD) or 20 µM diphenyleneiodonium chloride (DPI). One volume of PBSG containing 0.1% nitro-blue tetrazolium (NBT) and 0.5% EtOH, 400 µM arachidonic acid (AA), 500 nM phorbol 12-myristate 13-acid (PMA) or 320 µg/ml Triton X-100 was added and the cells were further incubated for 1 h at 37ºC. NBT reduction was stopped with 0.5 volumes acetic acid and reduced NBT was then determined as described in the legend to Figure 1. Results are reported as mean ± SD relative absorbance in relation to the EtOH/EtOH-treated samples. The number of samples was 5. The Student t-test was used to compare pretreatment with 0.5% EtOH and pretreatment with SOD or DPI.
*P < 0.05 for NBT reduction by cells pretreated with EtOH and then treated with AA, Triton X-100 or PMA compared to cells pre- and post-treated with EtOH (Student t-test).
NBT reduction (arbitrary units)
12
*
*
*
* *
10
8
6
4
2
0
EtOH/EtOH EtOH/AA AA/EtOH HL-60 Jurkat Raji Figure 4. Nitroblue tetrazolium
(NBT) reduction by ethanol-(EtOH) or arachidonic acid- (AA) pretreated cells. Cells were pre-treated for 15 min with 0.5% EtOH or 200 µM AA in PBSG (0.13 mM NaCl, 2.7 mM KCl, 0.6 mM CaCl2, 1.0 mM MgCl2, 5 mM glucose and 10 mM NaH2PO4/Na2HPO4, pH 7.4) and centrifuged. The supernatant was discarded and the sediment was resuspended in 0.05% NBT in PBSG and 0.5% EtOH or 200 µM AA, and cells were further incubated for 1 h at 37ºC. NBT reduction was stopped with 0.5 volumes acetic acid and reduced NBT was then determined as de-scribed in the legend to Figure 1. Results are reported as mean ± SD absorbance in relation to
con-trol (cells pretreated and treated with EtOH). EtOH/EtOH denotes cells pre- and treated with 0.5% EtOH; EtOH/AA denotes cells pretreated with 0.5% EtOH and treated with 200 µM AA; AA/EtOH denotes cells pretreated with 200 µM AA and post-treated with 0.5% EtOH. The number of samples was 6. *P < 0.05 for the comparisons between EtOH/AA or AA/EtOH and EtOH/EtOH; +P < 0.05 for the comparison between EtOH/AA and AA/EtOH (Student t-test).
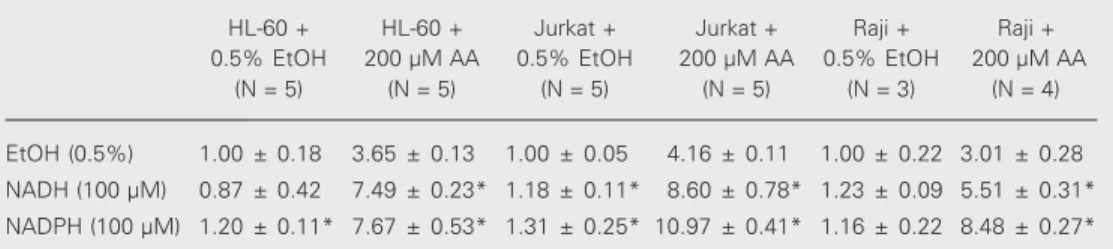
Table 2. Nitroblue tetrazolium reduction by cells treated with NADPH or NADH.
HL-60 + HL-60 + Jurkat + Jurkat + Raji + Raji + 0.5% EtOH 200 µM AA 0.5% EtOH 200 µM AA 0.5% EtOH 200 µM AA
(N = 5) (N = 5) (N = 5) (N = 5) (N = 3) (N = 4)
EtOH (0.5%) 1.00 ± 0.18 3.65 ± 0.13 1.00 ± 0.05 4.16 ± 0.11 1.00 ± 0.22 3.01 ± 0.28 NADH (100 µM) 0.87 ± 0.42 7.49 ± 0.23* 1.18 ± 0.11* 8.60 ± 0.78* 1.23 ± 0.09 5.51 ± 0.31*
NADPH (100 µM) 1.20 ± 0.11* 7.67 ± 0.53* 1.31 ± 0.25* 10.97 ± 0.41* 1.16 ± 0.22 8.48 ± 0.27*
Cells (2 x 10⁷/ml, 150 µl) in PBSG (0.13 mM NaCl, 2.7 mM KCl, 0.6 mM CaCl
2, 1.0 mM MgCl2, 5 mM glucose and 10 mM NaH2PO4/Na2HPO4, pH 7.4) were treated for 30 min with 0.5% ethanol (EtOH), 200 µM NADH or 200 µM NADPH. One volume of PBSG containing 0.1% nitroblue tetrazolium (NBT) and 0.5% EtOH or 400 µM arachidonic acid (AA) was added and the cells were further incubated for 1 h at 37ºC. NBT reduction was stopped with 0.5 volumes acetic acid and reduced NBT was then determined as described in the legend to Figure 1. Results are reported as mean ± SD relative absorbance in relation to the EtOH/EtOH-treated samples. The number of samples is indicated by N. Data obtained with pretreatment with 0.5% EtOH were compared to those obtained with NADH or NADPH treatment by the Student t-test.
*P < 0.05 for NBT reduction by cells pretreated with EtOH and then treated with AA compared to cells pre-and post-treated with EtOH (Student t-test).
the presence of SOD (Table 1, lines 11 and 14) in some cell types, such as Raji and Jurkat. Superoxide is possibly being gener-ated in vesicles that are not permeable to this antioxidant enzyme even in the presence of the detergent.
Both NADPH and NADH increased NBT reduction in all three cell lines tested, al-though the first had a greater effect (Table 2 and Figure 6). PMA, a known stimulator of PKC, only increased NBT reduction in some cell types, showing no effect (or even an inhibitory effect) on Raji and Jurkat cells (Figure 1). Bisindolylmaleimide I, also known as GF 109203X (up to 10 µM), a specific inhibitor of some isoforms of PKC, did not reverse control or AA-induced NBT reduction in the cell lines studied (Raji, Jurkat, undifferentiated and PMN-differentiated HL-60 cells) (data not shown), although it com-pletely reversed PMA-induced NBT reduc-tion (control, 1.00 ± 0.07; 5 µM GF 109203X, 1.07 ± 0.02; 250 nM PMA, 14.2 ± 0.9; GF 109203X + PMA, 0.9 ± 0.1, 6 samples).
A percentage of electrons is known to cause univalent reduction of oxygen in com-plexes I and III of the mitochondria, generat-ing superoxide. Rotenone (20 µM) is an inhibitor of complex I and oligomycin (5 µg/
ml) is an inhibitor of ATP synthase that causes mitochondrial hyperpolarization, which in turn hinders electron transport. Neither of these agents showed a marked effect on AA-induced NBT reduction in the cell lines tested (undifferentiated and PMN-like HL-60 cells, Jurkat and Raji), although minor effects (differences below 30%) could be seen, particularly on control (ethanol-treated) cells, with NBT reduction being decreased in Raji and undifferentiated HL-60 cells by rotenone and in Jurkat and undif-ferentiated HL-60 cells by oligomycin (data not shown). Other agents tested without a great effect on AA-triggered NBT reduction were antimycin A (complex III inhibitor) and dinitrophenol (a mitochondrial un-coupler) (data not shown). All agents used apparently were active on cells since they were cytotoxic at the doses used. Similar results were also found in PMN-differenti-ated HL-60 cells (data not shown).
cells showed a 20% increase in AA-triggered NBT reduction (data not shown). The effect of L-NAME (1 mM), an inhibitor of nitric oxide synthase was also evaluated. Nitric oxide and nitric oxide synthase had no effect on PMA- or Triton X-100-treated cells (data not shown).
In view of the fact that i) AA is known to be converted to a number of oxidized prod-ucts - the eicosanoids - by oxidation-reduc-tion reacoxidation-reduc-tions, ii) eicosanoids can modulate cell activity and metabolism through various pathways, and iii) eicosanoids are unstable products which can be broken down to other oxidized products, we investigated the role of AA metabolism in NBT reduction. Inhibi-tors of cyclooxygenase (prostaglandin syn-thase, 8,11,14-eicosatrienoate, hydrogen-donor:oxygen oxidoreductase, EC 1.14.99.1) (500 µM acetylsalicylic acid and 1 µM piroxicam) and of lipoxygenase (linoleate: oxygen oxidoreductase, EC 1.13.11.12) (2 µM nordihydroguaiaretic acid (NDGA) and 2 µM AA861) had little effect on NBT reduction. The cell line most sensitive to these drugs was Raji, in which there was a decrease in AA-induced NBT-reduction upon treatment with cyclooxygenase inhibitors (19% for acetylsalicylic acid and 14% for piroxicam) (data not shown). This cell line also showed increased NBT reduction when control cells were pretreated with piroxicam (25%) and AA861 (19%) (data not shown). The basal NBT reduction of HL-60 cells was slightly decreased by acetylsalicylic acid (6%) and piroxicam (16%) but was more efficient after the AA stimulus, and pretreatment with NDGA (9%) (data not shown). None of these effects was pronounced or systematically found in different cell lines and therefore the effects were probably due to interactions independent of eicosanoid biosynthesis.
The effect of cytochromes P-450 on NBT reduction was studied using the following inhibitors: ketoconazole (100 µM), 8-meth-oxypsoralen (1 mM) and aminobenzotriazole (1 mM). There was no marked effect of any
Figure 5. Nitroblue tetrazolium (NBT) reduction induced by Tri-ton X-100. Cells were treated with increasing concentrations of Triton X-100 at 37ºC. Results are reported as mean ± SD rela-tive absorbance. The number of samples was 6.
Figure 6. Nitroblue tetrazolium (NBT) reduction upon cell treat-ment with NADPH. HL-60 cells (2 x 10⁷/ml, 150 µl) were treated for 30 min with 0.5% ethanol (EtOH, 0) and with twice the indicated concentrations of NADPH. One volume of PBSG (0.13 mM NaCl, 2.7 mM KCl, 0.6 mM CaCl2, 1.0 mM MgCl2, 5 mM glucose and 10 mM NaH2PO4/Na2HPO4, pH 7.4) containing 0.1% NBT and 0.5% EtOH or 400 µM arachidon-ic acid (AA) was added and the cells were further incubated for 1 h at 37ºC. Results are reported as mean ± SD relative absorbance in
relation to the EtOH/EtOH-treated samples. The number of samples was 6. Data obtained with pretreatment with 0.5% EtOH were compared to those obtained with NADPH by the Student t-test. All samples treated with AA (squares) differed significantly from control samples (lozenges) (P < 0.005). Increasing concentrations of NADPH differed significantly from the value obtained with no NADPH: *0.05 > P > 0.005 and *+P < 0.005.
NBT reduction (arbitrary units)
10 9 8 7 6 5 4 3 2 0 1
0 25 50 75 100 125
NADPH (µM) *+ *+ * * * * * *
0.5% EtOH 200 µM AA
HL-60 + EtOH
Raji + EtOH Jurkat + EtOH
NBT reduction (arbitrary units)
12 10 8 6 4 2 0
0 10 20 30 40 50
α-Tocopherol (µM)
* *+ *+# * * * *+# *+# *+ *+ *
HL-60 + AA
Raji + AA Jurkat + AA Figure 7. Tocopherol and
arachi-donic acid- (AA) induced nitroblue tetrazolium (NBT) reduction. Cells were treated for 30 min with ethanol or with twice the indi-cated concentrations of toco-pherol. AA (400 µM) was added and the cells were further incu-bated for 1 h at 37ºC. NBT reduc-tion was stopped with 0.5 vol-umes acetic acid and reduced NBT was determined as de-scribed in the legend to Figure 1. Results are reported as mean ± SD relative absorbance in rela-tion to the EtOH/EtOH-treated samples. The number of samples was 6. *P < 0.05 for NBT reduc-tion by cells pretreated with
EtOH and then treated with AA; +P < 0.05for pretreatment with 0.5% EtOH (0) compared to pretreatment with tocopherol; #P < 0.05 for comparison between treatments with 25 and 50 µM tocopherol (Student t-test).
NBT reduction (arbitrary units)
4.0 3.5 3.0 2.5 2.0 1.5 1.0 0.5 0
0 200 400 600 800
Triton X-100 (µg/ml)
HL-60 Jurkat Raji
of these agents on NBT reduction in the cell lines studied (undifferentiated and PMN-like HL-60 cells, Jurkat and Raji). There was a decrease in AA-triggered NBT reduction in Raji cells (11%) by ketoconazole, and in Jurkat cells by 8-methoxypsoralen (20%) and aminobenzotriazole (15%) and there was an increase in basal NBT reduction in HL-60 (20%) and Jurkat (10%) cells treated with 8-methoxypsoralen (data not shown).
To prevent lipid peroxidation, cells were pretreated with tocopherol, a lipid antioxi-dant. This substance prevented NBT reduc-tion in AA-stimulated cells (HL-60, Jurkat and Raji) in a dose-dependent manner (Fig-ure 7). A similar effect was also found in PMN-differentiated HL-60 cells and thy-mocytes (data not shown). Paradoxically, in Jurkat (Figure 7), thymocyte and macro-phage-like differentiated HL-60 cells (data not shown) tocopherol increased baseline NBT reduction, which, as mentioned before, is usually high. This effect may be due to the prooxidant action of tocopheryl radicals or to the inhibition of the generation of 4-hydroxynonenal, a product of AA peroxida-tion that can inhibit NADPH oxidase (5).
Discussion
One of the greatest advantages of the NBT system, as mentioned before, is that it allows the detection of both intracellular and extracellular superoxide production. For this reason, significant results can be obtained with cell lines that are usually considered devoid of superoxide-generating systems (9,10), such as T lymphocytes (Jurkat) and undifferentiated HL-60 cells, as shown here. “Professional” superoxide-generating cells, such as macrophages and PMN-differenti-ated HL-60 cells, showed the greatest capac-ity for NBT reduction, but the production of superoxide was also clearly demonstrated in lymphocytes, even without cell stimulation. AA had a stimulatory effect on NBT reduction in all cell lines evaluated, i.e.,
undifferentiated, PMN-like differentiated and macrophage-like differentiated HL-60, Jurkat and Raji cells, and rat thymocytes and rat macrophages. This action of AA has been shown by different investigators in various cell types, particularly phagocytes, endothe-lial cells, 3T3 fibroblasts, and cancer cell lines (11-23). Most published data indicate only a slight effect of AA on superoxide generation, probably because the superox-ide assays normally used, such as the cyto-chrome c reduction system, can only deter-mine extracellular superoxide. According to our results, most NBT reduction found in AA-stimulated cells occurred in the intracel-lular compartment since it could not be in-hibited by exogenously added SOD. This enzyme, due to its large size, cannot pen-etrate the cell. These results bring us back to the possibility that the reduction of NBT did not indicate superoxide production but rather the presence of other agents, possibly AA itself. This last possibility cannot be com-pletely excluded, but some evidence argues against it. Although different cells were treated with the same quantities of AA, the NBT reduction capacity varied considerably. Other evidence indicating that AA is not itself being reduced is presented in Figure 4, where it can be seen that cellular pretreat-ment with AA was sufficient to trigger NBT reduction after AA was washed away. This type of “priming” effect of AA has been shown by Huang et al. (12), Kweon et al. (21), Cherny et al. (10), and Corey and Rosoff (22).
induce necrosis (4). The concentration of 200 µM AA was adopted for further studies to avoid the cell changes inherent to necro-sis, when there is extensive activation of proteases, nucleases, esterases among other degrading enzymes, and pronounced changes in metabolism. This concentration was also adopted to permit a comparison between superoxide generation and the triggering of apoptosis (4). It is possible that the concen-tration that leads to an increase in NBT reduction correlates with the critical micel-lar concentration of AA, which has been found to be around 10 µM (22). For compar-ison, physiological plasma concentrations of free AA (non-esterified) in humans vary from 5.8 to 49.3 µM (24).In fact, the pattern of
oxidative burst stimulated by AA mimics that of detergents, such as Triton X-100. AA is itself a detergent, having a long hydropho-bic tail and a hydrophilic head, usually found in the dissociated form at physiological pH (arachidonate). The present paper shows various experiments run side by side in which NBT reduction was stimulated with AA or with detergents. It was found that many agents affected NBT reduction promoted by both stimuli in the same way. For instance, most inhibitors of mitochondrial respiration such as the xanthine-xanthine oxidase system, ni-tric oxide synthase and cytochromes P-450 had no effect on either forms of stimulation of NBT reduction. On the other hand, deter-gent-stimulated NBT reduction was more sensitive to the NADPH oxidase inhibitor DPI and, in HL-60 cells, particularly after differentiation to PMN-like cells, to SOD inhibition. Incidentally, in undifferentiated and PMN-like differentiated HL-60 cells, Triton X-100-stimulated NBT reduction showed the same pattern of inhibition as that of PMA-stimulated cells. AA-stimulated NBT reduction, on the other hand, was virtu-ally not affected by SOD and was less sensi-tive to DPI and NEM inhibition. It seems that AA might act as a detergent, but its effect must involve other mechanisms as well, as
suggested by Cherny et al. (10), Huang et al. (12), Corey and Rosoff (22) and Kadri-Hassani et al. (23), and will be discussed further on.
inhibitor) (10,31) may prevent AA-induced superoxide production, whereas NADPH, a substrate for the enzyme, promotes it. In-deed, NADH was also capable of promoting AA-stimulated NBT reduction. The follow-ing hypothesis may explain this effect of NADH: it could be consumed to convert NADP to NADPH; it could be a co-substrate for NADPH oxidase, or there may be a su-peroxide-generating NADH oxidase. Simi-lar stimulating effects of NADPH and NADH on AA-induced superoxide generation were also found by O’Donnell and Azzi (13).
Although the present investigation was designed to study the effect of AA on super-oxide production, we would like to mention some common results obtained with non-stimulated cells of different cell lines. The following agents prevented NBT reduction: DPI and NEM (as shown in results), SOD (100 µg/ml), which decreased control values by 23% (0.05 > P > 0.005) in HL-60 cells; 27% (0.05 > P > 0.005) in PMN-like HL-60
cells; 12% (0.05 > P > 0.005) in Jurkat and 17% (0.05 > P > 0.005) in Raji cells; L-NAME (1 mM), which decreased NBT re-duction by 10% (0.05 > P > 0.005) in HL-60 cells and oligomycin (5 µg/ml), which de-creased NBT reduction by 27% (P < 0.005) in HL-60 cells and by 19% (0.05 < P < 0.005) in Jurkat cells, implicating not only NADPH oxidase, but also the mitochondria and nitric oxide synthase in baseline superoxide pro-duction by the cell lines tested. This cor-roborates data obtained by Rothe and Valet (32), who found that baseline superoxide production by phagocytes could be inhibited by azide, a known inhibitor of mitochondrial oxygen consumption.
In conclusion, the results presented here implicate the NADPH oxidase system in AA-induced superoxide production in vari-ous forms of leukocytes, excluding the role of the mitochondrion and of xanthine oxi-dase, nitric oxide synthase, cytochromes P-450 and eicosanoid-stimulated systems.
References
1. Pompéia C, Lopes LR, Miyasaka CK, Procópio J, Sannomiya P & Curi R (2000). Effect of fatty acids on leukocyte function. Brazilian Journal of Medical and Biological Research, 33: 1255-1268.
2. Suzuki YJ, Forman HJ & Sevanian A (1997). Oxidants as stimulators of signal transduction. Free Radical Biology and Medicine, 22: 269-285.
3. Halliwell B & Gutteridge JMC (1989). Free Radicals Biology and Medicine. Clarendon, Oxford, England.
4. Pompéia C, Freitas JJS, Jung SK, Zyngier SB & Curi R (2002). Arachidonic acid cytotoxicity in leukocytes: implications of oxidative stress and eicosanoid synthesis. Biology of the Cell, 94: 251-265. 5. Mytilineou C, Kramer BC & Yabut JA (2002). Glutathione depletion
and oxidative stress. Parkinsonism and Related Disorders, 8: 385-387.
6. Babior BM (1999). NADPH oxidase: an update. Blood, 93: 1464-1476.
7. Fujita T (2002). Formation and removal of reactive oxygen species, lipid peroxides and free radicals, and their biological effects.
Yakugaku Zasshi, 122: 203-218.
8. Ivanov IV, Groza NV & Myagkova GI (1999). Cytochrome P450-dependent metabolism of arachidonic acid. Biochemistry, 64: 725-737.
9. Sakane F, Takahashi K & Koyama J (1984). Purification and character-ization of a membrane-bound NADPH-cytochrome c reductase ca-pable of catalyzing menadione-dependent O2- formation in guinea pig polymorphonuclear leukocytes. Journal of Biochemistry, 96:
671-678.
10. Cherny VV, Henderson LM, Xu W, Thomas LL & DeCourse TE (2001). Activation of NADPH oxidase-related proton and electron currents in human eosinophils by arachidonic acid. Journal of Phys-iology, 535: 783-794.
11. Harris P & Ralph P (1985). Human leukemic models of myelomono-cytic development: a review of the HL-60 and U937 cell lines.
Journal of Leukocyte Biology, 37: 407-422.
12. Huang ZH, Hii CST, Rathjen DA, Poulos A, Murray AW & Ferrante A (1997). N-6 and N-3 polyunsaturated fatty acids stimulate transloca-tion of protein kinase C-alpha, -betaI, -betaII and -epsilon and en-hance agonist-induced NADPH oxidase in macrophages. Biochemi-cal Journal, 325: 553-557.
13. O’Donnell VB & Azzi A (1996). High rates of extracellular superoxide generation by cultured human fibroblasts: involvement of a lipid-metabolizing enzyme. Biochemical Journal, 318: 805-812. 14. Ely WE, Seeds MC, Chilton FH & Bass DA (1995). Neutrophil
lease of arachidonic acid, oxidants, and proteinases: causally re-lated or independent. Biochimica et Biophysica Acta, 1258: 135-144. 15. Shiose A & Sumimoto H (2000). Arachidonic acid and phosphoryla-tion synergistically induce a conformaphosphoryla-tional change of p47 phox to activate the phagocyte NADPH oxidase. Journal of Biological Chem-istry, 275: 13793-13801.
336: 611-617.
17. Madhavi N, Das UN, Prabha PS, Kumor GS, Koratkar R & Sagar PS (1994). Suppression of human T-cell growth in vitro by cis-unsatur-ated fatty acids: relationship to free radicals and lipid peroxidation.
Prostaglandins, Leukotrienes and Essential Fatty Acids, 51: 33-40. 18. Ramesh G & Das UN (1998). Effect of cis-unsaturated fatty acids on
Meth-A ascitic tumour cells in vitro and in vivo. Cancer Letters, 123: 207-214.
19. Cui XL & Douglas JG (1997). Arachidonic acid activates c-jun N-terminal kinase through NADPH oxidase in rabbit proximal tubular epithelial cells. Proceedings of the National Academy of Sciences, USA, 94: 3771-3776.
20. Mayer AM, Brenic S & Glaser KB (1996). Pharmacological targetting of signalling pathways in protein kinase C-stimulated superoxide generation in neutrophil-like HL-60 cells: effect of phorbol ester, arachidonic acid and inhibitors of kinase(s), phosphatase(s) and phospholipase A2. Journal of Pharmacology and Experimental Therapeutics, 279: 633-644.
21. Kweon SM, Kim HJ, Lee ZW, Kim SJ, Kim SI, Paik SG & Ha KS (2001). Real-time measurement of intracellular reactive oxygen spe-cies using Mito tracker orange (CMH2TMRos). Bioscience Reports, 21: 341-352.
22. Corey SJ & Rosoff PM (1991). Unsaturated fatty acids and lipoxyge-nase products regulate phagocytic NADPH oxidase activity by a nondetergent mechanism. Journal of Laboratory and Clinical Medi-cine, 118: 343-351.
23. Kadri-Hassani N, Leger CL & Descomps B (1995). The fatty acid bimodal action on superoxide anion production by human adherent monocytes under phorbol 12-myristate 13-acetate or diacylglycerol activation can be explained by the modulation of protein kinase C and p47phox translocation. Journal of Biological Chemistry, 270: 15111-15118.
24. Tietz NW (1994). Textbook of Clinical Chemistry. 3rd edn. WB
Saunders Company, Philadelphia, PA, USA.
25. Zhao X, Bey EA, Wientjes FB & Cathcart MIK (2002). Cytosolic phospholipase A2 (cPLA2) regulation of human monocyte NADPH oxidase activity. cPLA2 affects translocation but not phosphoryla-tion of p67(phox) and p47(phox). Journal of Biological Chemistry, 277: 25385-25392.
26. Henderson LM, Thomas S, Banting G & Cappell JB (1997). The arachidonate-activatable, NADPH oxidase-associated H+ channel is contained within the multi-membrane-spanning N-terminal region of gp91-phox. Biochemical Journal, 325: 701-705.
27. Tokumura A, Moriyama T, Minamino H, Hayakawa T & Tsukatani H (1997). Exogenous phosphatidic acid with saturated short-chain fatty acyl groups induces superoxide anion release from guinea pig peritoneal polymorphonuclear leukocytes by three different mecha-nisms. Biochimica et Biophysica Acta, 1344: 87-102.
28. Hwang D & Rhee SH (1999). Receptor-mediated signaling path-ways: potential targets of modulation by dietary fatty acids. Ameri-can Journal of Clinical Nutrition, 70: 545-546.
29. Ron D & Kazanietz MG (1999). New insights into the regulation of protein kinase C and novel phorbol ester receptors. Federation Proceedings, 13: 1658-1676.
30. Cocco T, Di Paola M, Papa S & Lorusso M (1999). Arachidonic acid interaction with the mitochondrial electron transport chain promotes reactive oxygen species generation. Free Radical Biology and Medi-cine, 27: 51-59.
31. Korshunov SS, Korkina OV, Ruuge EK, Skulachev VP & Starkov AA (1998). Fatty acids as natural uncouplers preventing generation of O2.- and H2O2 by mitochondria in the resting state. Federation of
European Biochemical Societies Letters, 435: 215-218.