Impact of extracellular alkalinization on the survival of
human CD24
-
/CD44
+
breast cancer stem cells
associated with cellular metabolic shifts
S.I. Wanandi
1*, I. Yustisia
2*, G.M.G. Neolaka
1and S.W.A. Jusman
11
Department of Biochemistry and Molecular Biology, Faculty of Medicine, Universitas Indonesia, Jakarta, Indonesia
2
Department of Biochemistry, Faculty of Medicine, Hasanuddin University, Makassar, Indonesia
Abstract
Cancer stem cells reside in a distinct region within the tumor microenvironment that it is believed to play a fundamental role in regulating stemness, proliferation, survival, and metabolism of cancer cells. This study aimed to analyze the effect of extracellular alkalinization on metabolism and survival of human CD24-/CD44+breast cancer stem cells (BCSCs). BCSCs were
cultured in alkalinized DMEM-F12 and incubated at 37°C, 5% CO2, and 20% O2 for 30 min, 6, 24, and 48 h. After each
incubation period, we analyzed the modulation of various mRNA expressions related to pH and cellular metabolic regulation using the qRT-PCR. Metabolic state was measured using colorimetric andfluorometric assays. To examine cell proliferation and apoptosis, we used trypan blue and annexin V/propidium iodide assay, respectively. This study demonstrated that alkalinization could stimulate extracellular carbonic anhydrase (CAe) activity, as well as CA9 and HIF1aexpression. Under alkaline pH and HIF1aregulation, glucose consumption, extracellular lactate production, and LDH activity of BCSCs were upregulated while O2consumption was downregulated. These metabolic shifts seemed to promote apoptosis and suppress the proliferation of
BCSCs. To conclude, modulation of the extracellular environment through alkalinization could change the metabolic states of BCSCs, which in turn affect the cell survival.
Key words: Extracellular alkalinization; Metabolic states; Breast cancer stem cells; Cell survival; NaHCO3
Introduction
The tumor microenvironment is the environment sur-rounding the cancer cells, which consists of stromal cells, non-cellular components and various kinds of soluble factors forming the extracellular matrix. The tumor microenviron-ment also has distinctive physical and chemical parameters such as oxygen pressure (O2), pH, interstitial pressure and fluidflux (1–3). The microenvironment has a major role in regulating stemness, proliferation, tenacity against apop-tosis, and it also has a protective function that keeps the cancer stem cells (CSCs) safe from genotoxic damage (4,5). It is known that the microenvironment of solid tumors tends to be hypoxic, which may affect their metabolism (4).
In vitro studies conducted by Vlashi et al. (6,7) have demonstrated that the CSCs of glioma and breast cancer are dependent on oxidative phosphorylation for energy metabolism; while its differentiated progeny has shown a more glycolytic phenotype. Feng et al. (8) reported that breast cancer stem cells (BCSCs), also called tumor initiating cells, preferentially performed a glycolytic phenotype over
oxidative phosphorylation compared to non-tumorigenic cells. The contradiction of these results indicates that further studies on the metabolic states of BCSCs are essential con-sidering the crucial role of the cell population in carcinogen-esis and the central role of metabolism on CSCs survival.
One of the metabolic consequences of hypoxia is tumor acidity. Unlike healthy tissues, cancer has higher intracellular pH (pHi, X7.4) and lower extracellular pH
(pHe) with a range of 6.7–7.1 (9,10). The pH of tumor tissue has an important role in the survival of cancer cells and their malignant characteristics. The slightly basic pH (X7.4) has several roles in increasing cell proliferation, preventing apoptosis and cytoskeletal changes in cell migra-tion. It has been reported that the increase of extracellular acidity could facilitate cell invasion, modulate cell binding to the extracellular matrix, and increase cellular protease activity, hence, suggesting its essential role in cancer metastasis (9,11). The specific characteristic of cancer acidity and its various consequences on survival and
Correspondence: S.I. Wanandi:<[email protected]>|<[email protected]>
*These authors contributed equally to this work.
spreading of cancer cells has become a prospective and strategic approach to a novel cancer treatment.
Much effort has been carried out to increase the effectiveness of cancer therapy including the development of therapeutic targets on CSCs. However, the stemness, tumorigenicity, dormancy, and plasticity of CSCs are obtained from the interaction of these cells with their environment. Therefore, the development of a targeted therapy must also consider the CSC microenvironment factors. To study the effect of microenvironment pH changes on the survival of BCSCs, we conducted a study that modulated the pHe of human BCSCs using the alkalinizing agent sodium bicarbonate (NaHCO3). We hypothesized that alkaline pHe might alter the metabolic preference, leading to the decrease of CSCs survival.
Material and Methods
Culture of human breast cancer stem cells (BCSCs) In our previous study, primary culture of human breast cancer were sorted using magnetic-activated cell sort-ing conjugated with anti-CD24 and anti-CD44 antibody resulting in CD24–/CD44+ cells for BCSCs and CD24–/ CD44–cells for non-BCSCs (Patent registration from the General Directorate of Intellectual Property Right, Ministry of Law and Human Right, Republic of Indonesia; No. P0021300369).
BCSCs were cultured in serum free DMEM/F12 medium in 15 mM HEPES buffer supplemented with 1% penicillin/streptomycin, 1% amphotericin B (250 mg/L, 0.2% gentamycin sulfate (50 mg/mL), and 14.5 mM NaHCO3under standard condition (at 37°C in a humidified atmosphere of 5% CO2and 20% O2). Although there are no specific growth factors for stem cells, the human BCSCs (CD24–/CD44+cells) still retain their pluripotency and tumorigenicity under this culture condition, as indi-cated by higher Oct-4 and ALDH1 mRNA expression, as well as higher mammosphere forming unit compared to their counterpart CD24–/CD44–cells and the unsorted primary breast cancer cells (Patent registration from the General Directorate of Intellectual Property Right, Ministry of Law and Human Right, Republic of Indonesia; No. P00201607099).
Alkalinization of culture medium using NaHCO3 BCSCs were initially seeded at 5105 cells/well in 6-well plates and cultured in 3 mL/well of DMEM-F12 standard medium, pH 7.4, at 37°C, 5% CO2and 20% O2 for 24 h. Afterwards, the extracellular alkalinization was performed by replacing the initial BCSCs medium with standard medium supplemented with various volumes of 8.4% NaHCO3 (Meylon-84s, Otsuka, Indonesia) to generate the final concentration of 10, 30, 50, 75, and 100 mM. The cells were then incubated in the alkalinized medium at 37°C, 5% CO2and 20% O2for 0, 0.5-, 6-, 24-, and 48-h. After each incubation period, pH of cell culture
medium (pHe) was immediately measured. To remove dead cells, cultured cells were then harvested by centrifuga-tion at 200g for 10 min at room temperature. Cell pellet and culture supernatant were collected for various analysis. Cell pellet containing viable cells were re-suspended in PBS buffer. Viable cell number and percentage of viable cells to total cells (cell viability) were determined using trypan blue exclusion assay in automated cell counter (Lunas, Logos Biosystems Inc., Korea). The remaining
cells collected in pellets after NaHCO3treatment still have high percentage of viability (490%) similar to control without treatment, indicating that the experimental data were obtained from the remaining viable cells.
pHe measurement
pHe was determined by measuring pH of the culture medium using pH electrode with Micro Bulb for 96-well plate (Hannas) connected with pH meter (HI 2210s,
Hanna). After incubation, 300 mL medium from each alkalinized and non-alkalinized BCSC culture was col-lected in a test tube for pH measurement. The pH should be immediately measured upon removing the cell culture plate from the incubator, since changes of CO2 concen-tration and temperature could affect the results.
Quantitative reverse transcription-PCR
Total RNA was extracted from cell pellets using Tripures
RNA Isolation Kit (Roche, Germany) according to the manufacturer’s protocol. Total RNA concentration was quantified using spectrophotometer (Varioskan Flashs, Thermo Scientific, Finland). Samples with an A260/A280 ratio of 1.6–2.0 were considered to be free of DNA and proteins. Quantitative RT-PCR was performed using KAPA SYBR Fasts qPCR (Kapa Biosystems, USA) in
the Exicyclert96 (Bioneer, Korea). The PCR primers for CA9, HIF1a, GLUT1, and 18s RNA are listed in Table 1. All primers have been tested for their efficiency, resulting in a high primer efficiency for all genes (495%). Ct for each gene was determined, andDDCt was normalized to the designated reference sample. Gene expression values were then relatively calculated using the Livak method (2DDCt
).
Extracellular carbonic anhydrase (CAe) activity Cultured BCSCs of 106cells were centrifuged at 200g
Tris-sulfate buffer without cells (as the blank; T0), and Tris-sulfate buffer containing intact BCSCs (T) from 8.3 to 6.3 was measured, and the enzymatic activity was calculated using the following equation: A unit of activity = (T0/T)–1
Glucose consumption, lactate production, and LDH activity assay
Glucose consumption was determined by subtracting the glucose concentration in DMEM-F12 (17.5 mM) before incubation with that remained in the medium after the incubation period. The glucose level was measured using O-toluidine colorimetric assay (Sigma-Aldrich, USA) and spectrophotometer at 625 nm.
To determine the extracellular lactate level, the amount of lactate present in the supernatant of BCSC culture was determined using the L-Lactate Assay Kit (Abcam, UK) and spectrophotometer at 450 nm. The intracellular lactate level was measured in the lysate of cell pellets using Lactate Colorimetric/Fluorometric Assay Kit (BioVision, USA).
Lactate dehydrogenase (LDH) activity was analyzed using a Lactate Dehydrogenase Activity Assay Kit (Sigma) in cell lysate, which represents the intracellular LDH. We also measured the extracellular LDH activity in the cell culture supernatant to calculate the LDH release for the determination of cell viability (see below).
Extracellular oxygen concentration assay
Oxygen consumption was determined using sensitive phosphorescent probes that were quenched at excited state in the presence of oxygen (Extracellular O2probe, Abcam). Briefly, after culturing BCSCs for an incubation period, cells were harvested and then transferred to a fluorescence 96-well plate with a densityB8104cells/well.
The 10-mL probes from 1mM stock solution were dispensed into each well, and 100mL of preheated mineral oil (30°C) was added to each well to enhance the assay sensitivity by minimizing interference from ambient oxygen. Probe signals were measured in a fluorescence plate reader equipped with a time-resolved mode preset to 37°C at 1.5 min intervals for 60 min using excitation and emission wavelengths of 380 nm and 650 nm, respectively.
HIF1aprotein level
Total protein was extracted from 5105cells. HIF1a protein level was assayed using HIF1A Human ELISA kit (Abcam) according to the manufacturer’s protocol. Data are reported per total protein.
Inhibition of HIF1aexpression using FM19G11 FM19G11 inhibits HIF1a expression, thus represses the transcriptional activity of its target genes (13). Cells were simultaneously treated with FM19G11 and 100 mM NaHCO3 and incubated for 24 h. After treatment, pHe and cell viability (ratio of viable cell to total cell number) was determined using trypan blue exclusion assay on the automated cell counter. The expression of HIF1a and GLUT1 mRNA were analyzed using qRT-PCR method, as described above. Protein expression of HIF1awas analyzed using Human/Mouse HIF-1a Total Immunoassay kit (R&D System, USA) according to the manufacturer’s protocol.
Cell viability and population doubling time (PDT) assay To determine cell viability, we applied trypan blue exclusion assay. Viable cells were counted using an auto-mated cell counter (Lunas, Logos Biosystems Inc.). Cell viability was also examined using the calculation of percent LDH release obtained from the ratio between LDH activity in supernatant (extracellular) and in cell lysate (intracellular). Extracellular LDH activity represents the presence of this enzyme released by lysed cells, hence this method could be used to determine the cytotoxicity as previously described by Gloria et al. (14).
Population doubling time defines the average time taken by a cell population to double in the log-phase/ exponential phase. To determine the PDT of BCSCs, about 5105cells were grown under standard conditions with or without alkalinization for 48 h. Cells were counted every 6 h using trypan blue exclusion assay. According to Davis (15), the formula used was (t2–t1)/3.32 (log n2–log nI), where t is time and n number of cells.
Apoptosis assay
Apoptosis test was performed using Annexin V-FITC Apoptosis Detection Kit (Abcam). About 5105BCSCs Table 1. Primers used in qRT PCR.
Genes Primers Amplicon (bp) CA9 Sense 50-GGCTACAGCTGAACTTCCGA-30
Antisense 50-GCCAAAAACCAGGGCTAGGA-30
155 GLUT1 Sense 50-GCTTCCAGTATGTGGAGCAAC-30
Antisense 50-GGTCCGGCCTTTAGTCTCAG-30
116 HIF1 Sense 50- GGCGCGAACGACAAGAAAAAG -30
Antisense 50- AGTGGCAACTGATGAGCAAG-30
122 18S RNA Sense 50- AAACGGCTACCACATCCAAG-30
Antisense 50-CCTCCAATGGATCCTCGTTA-30
were harvested and rinsed with cold PBS twice. The next steps were carried out following the protocol instructions.
Statistical analysis
All data are reported as means±SE of at least
triplicates. A P-value of o0.05 in the independent t-test and one-way ANOVA was considered to be statistically significant.
Results
BCSC response toward increased pHe
Following the alkalinization of BCSC cultures using various NaHCO3concentrations, we showed that the increased pHe was consistent with the increase of NaHCO3 con-centration (Figure 1A). The addition of 100 mM NaHCO3 resulted in the highest increase of pHe (8.84±0.00);
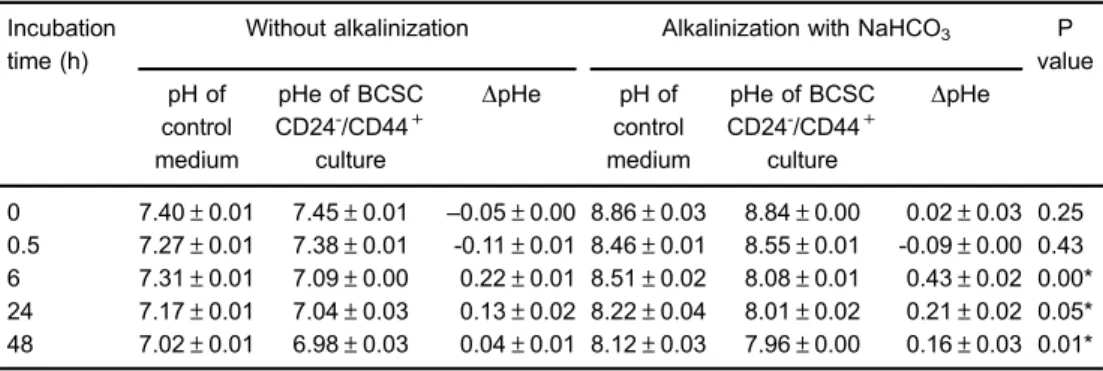
however, the pHe was gradually decreased along with the increase of NaHCO3 incubation period. This result was consistent with the pH of control medium without cells, which was also gradually reduced after certain periods of NaHCO3incubation. We assume that the CO2gas in the incubator became soluble in the culture medium and produced carbonic acid, which could lower the pH of the medium. Therefore, to analyze the pattern of reduced pHe, the pH of control medium (without cells) was subtracted by the pHe of BCSC culture known as the DpH (Table 2). This study demonstrated that DpHe of BCSCs after 6- to 48-h alkalinization was significantly higher compared to that of the control without alkaliniza-tion (Pp0.05).
To identify the mechanism of BCSCs response to alkalinization, the expressions of mRNA CA9 and the extracellular CAe activity of the BCSCs were measured. CA9 is one of the CAe isozymes since its catalytic site faces toward the outer side of cells that catalyzes reversible hydration/dehydration reaction of CO2/H2CO3 (16). Adding NaHCO3to the medium caused increased concentration of bicarbonate (HCO3-) ion that will further activate CAe to catalyze dehydration reaction of carbo-nate ion: HCO3-+H+-H2CO3-CO2+H2O. Increased CO2concentration caused reduced pH of culture medium. We found that the CA9 mRNA expression of BCSCs was gradually enhanced after 6-h alkalinization compared to that of non-alkalinized BCSCs (Figure 1B). A significant increase of CA9 mRNA expression was demonstrated in this study following 24- and 48-h NaHCO3 incubation, indicating that BCSCs responded to alkaline pHe through increased expression of CA9 gene as one of the cellular pH regulators. The increase of CA9 mRNA expression was then followed by the increased CAe activity after 6 h of incubation (Figure 1C). However, following the 24- and 48-h NaHCO3incubation, the increase of CAe activity was reduced (P40.05). The reduced CAe activity seemed to be proportional to the decrease of pHe, i.e., 8.01 for 24-h incubation and 7.96 for 48-h incubation.
Effect of alkalinization on HIF1agene expression and protein concentration of BCSCs
To explore the role of HIF1ain regulating the changes of pHe, we measured its mRNA and protein expression levels in BCSCs after each NaHCO3 incubation period. Figure 1.A, pHe of the breast cancer stem cells culture medium measured by a micro bulb pH electrode at various concentra-tions of NaHCO3before and after 24-h incubation at 37°C with
5% CO2. B, qRT-PCR analysis of CA9 mRNA expression after
alkalinization with 100 mM NaHCO3. C, CAe activity
measure-ment using the Wilbur Anderson method. Data are reported as means±SE for n=9. *Po0.05 non-alkalinized vs alkalinized BCSCs CD24-/CD44+culture (t-test). CAe: carbonic anhydrase;
HIF1a gene expression in BCSCs was decreased up to 6-h NaHCO3incubation, however, after 24-h the mRNA expression was significantly increased higher than that without alkalinization (Po0.01). After 48-h alkalinization, the increase of HIF1amRNA was slightly decreased but still significantly higher compared to its counterpart cells without alkalinization (Figure 2A). Similar to HIF1amRNA expression, the minor decrease of HIF1aprotein level in BCSCs up to 6 h was followed by a significant increase after 24-h alkalinization. The increase of HIF1a protein level was also reduced after 48-h NaHCO3 incubation (Figure 2B). It seemed that alkaline pHe at a specific point might induce and activate HIF1a stabilization although under normoxia. It is known that HIF1a regulates the transcription of CA9-encoding gene under hypoxic condi-tion (16). Nevertheless, this study demonstrated that the increase of CA9 mRNA and CAe activity was an earlier response to the alkaline pHe compared to the increase HIF1a mRNA and protein. The plausible mechanism of this phenomenon might involve the alternative signaling pathway of CA9 in response to the modulation of pHe.
Effect of alkalinization on BCSC metabolism
To analyze the effect of extracellular alkalinization on BCSC metabolism, we analyzed metabolic parameters including glucose consumption, lactate production, oxygen consumption, and the activity of lactate dehydrogenase. The increased glucose consumption of BCSCs following 24-h extracellular alkalinization could be clearly identified by the increase of mRNA expression encoding GLUT1 glucose transporter (Po0.01; Figure 3A).
Furthermore, the measurement of glucose level in the culture supernatant showed that the glucose consumption by BCSCs after 24- and 48-h extracellular alkalinization was significantly higher than that of their counterpart cells without alkalinization (Figure 3B). To know further about the effect of alkalinization on BCSCs glucose metabolism,
we determined the lactate production in BCSCs. The results revealed that after 24- and 48-h alkalinization, extracellular lactate production in BCSCs was significantly Table 2.Comparison ofDpHe of breast cancer stem cells with and without alkalinization with NaHCO3.
Incubation time (h)
Without alkalinization Alkalinization with NaHCO3 P
value pH of
control medium
pHe of BCSC CD24-/CD44+
culture
DpHe pH of control medium
pHe of BCSC CD24-/CD44+
culture
DpHe
0 7.40±0.01 7.45±0.01 –0.05±0.00 8.86±0.03 8.84±0.00 0.02±0.03 0.25
0.5 7.27±0.01 7.38±0.01 -0.11±0.01 8.46±0.01 8.55±0.01 -0.09±0.00 0.43
6 7.31±0.01 7.09±0.00 0.22±0.01 8.51±0.02 8.08±0.01 0.43±0.02 0.00* 24 7.17±0.01 7.04±0.03 0.13±0.02 8.22±0.04 8.01±0.02 0.21±0.02 0.05* 48 7.02±0.01 6.98±0.03 0.04±0.01 8.12±0.03 7.96±0.00 0.16±0.03 0.01* Data are reported as means±SE. BCSCs were treated with 100 mM NaHCO3for 0.5, 6, 24, and 48 h
under standard culture conditions. DpHe is the subtraction between the corresponding pH of control medium and the pHe of BCSC culture. BCSCs: breast cancer stem cells. *Statistically significant difference (t-test).
Figure 2.Effect of alkalinization with 100 mM NaHCO3on HIF1a
higher than that in the cells without alkalinization (Figure 3C). In order to analyze whether metabolic shift towards a glycolytic phenotype in BCSCs causes cell death, the intracellular lactate production in BCSC lysate was
additionally measured. The result demonstrated that the increase of intracellular lactate level after 24-h extra-cellular alkalinization was significantly higher compared to that without alkalinization (Po0.05). In addition, the Figure 3.Effect of extracellular alkalinization with 100 mM NaHCO3on metabolic shift towards a glycolytic phenotype in BCSCs.
colorimetric measurement also showed the increase of LDH activity in the alkalinized compared to non-alkalinized BCSC cultures (Figure 3D). Taken together, these data suggest that extracellular alkalinization may lead to the metabolic need for glucose in BCSCs. The extracellular alkalinization could increase the glycolysis in BCSCs to produce lactate and ATP. The overproduction of intracel-lular lactate could then contribute to the rapid decrease of pHe following the alkalinization.
To demonstrate the role of HIF1aon the regulation of glycolysis in the extracellular alkalinized BCSCs, we used FM19G11, an inhibitor of HIF1a expression. The result demonstrated that FM19G11 could significantly inhibit the expression of HIF1aat the protein, and interestingly also the mRNA level (Figure 3F), as reported in our previous study (17). The mechanism of HIF1amRNA inhibition by FM19G11 should be further investigated. The inhibition of HIF1aprotein and mRNA was in line with the inhibition of GLUT1 mRNA expression. These data confirmed the role of HIF-1atranscription factor on GLUT1 mRNA synthesis
in BCSCs under alkalinized culture condition. In contrast to that, the pHe and BCSC viability were not affected by HIF1ainhibition.
The results of the extracellular O2 concentration of BCSCs demonstrated that O2consumption of BCSCs in alkalinized medium was significantly lower than that in the non-alkalinized medium after 6- and 24-h incubation (Po0.05; Figure 4A). Contrastingly, after 48-h alkaliniza-tion the O2 consumption of BCSCs was drastically increased (Po0.01; Figure 4B) compared to their counter-part without alkalinization.
Effect of alkalinization on BCSC survival
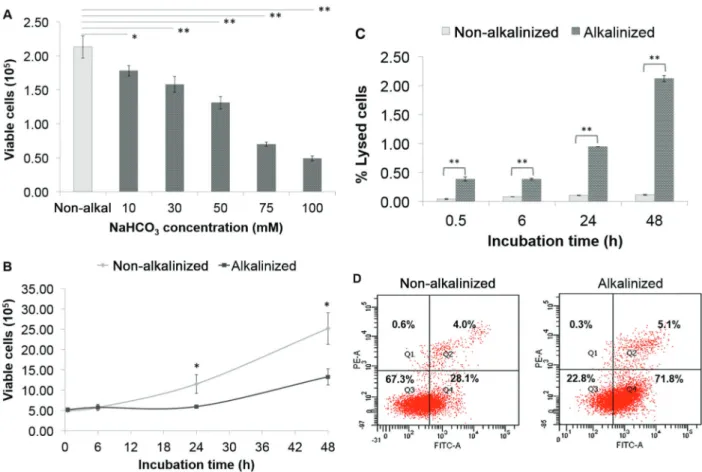
Under microscopic observation, we found that the morphology of BCSCs was altered in alkalinized culture. In physiologic pH, the BCSCs tend to grow as cell aggregates and form mammospheres. This kind of cell formation could not be found in cells growing in alkalinized medium (Figure 5A). Moreover, the number of viable BCSCs determined using trypan blue assay after 24-h Figure 4.Extracellular O2consumption of breast
cancer stem cells after 6- and 24-h incubation (A) and after 48-h incubation (B) measured by
alkalinization was gradually reduced in line with the increased NaHCO3concentration in the culture medium, as shown in Figure 5B. In addition to that, we also underline that the extracellular alkalinization with NaHCO3concentrationX75 mM could lead to cell death since the viable cell number was obviously decreased below the inoculated cell number (Figure 6A). To confirm this result, we measured the population doubling time (PDT), LDH release, and apop-tosis of BCSCs cultured in alkalinized medium with 100 mM NaHCO3 and incubated for 0.5-, 6-, 24-, and 48-h. Figure 6B demonstrates the growth of BCSCs in alkalinized compared to non-alkalinized medium. After 48-h culture in alkalinized medium, the growth of BCSCs was slower (13.3 x 10⁵viable cells) compared to the non-alkalinized culture (25.2 x 10⁵ viable cells). Using the formula described in the Material and Methods section, we calculated the PDT of BCSCs to be 32.7 and 51.2 h in non-alkalinized and alkalinized culture, respectively. The PDT of BCSCs after 24- and 48-h extracellular alkaliniza-tion was significantly longer than that without alkaliniza-tion, indicating that it could also inhibit cell proliferation. In Figure 6C, we exhibit that the percentage of LDH release in alkalinized culture was significantly higher (Po0.05) com-pared to that without alkalinization after 0.5-h of NaHCO3 incubation. This suggests that extracellular alkalinization was slightly toxic to BCSCs. The apoptosis assay using Annexin V/propidium iodide resulted in the higher percen-tage of early and late apoptosis in the BCSCs cultured in alkalinized medium compared to that without alkalinization (Figure 6D).
Discussion
It is known that the tumor tissue has an acidic pH that is mainly related to the metabolic activity and hypoxia (9,10). As an effort to intervene in the acidic pH of the tumor microenvironment, Robey et al. conducted a study using nude mice model, which had an implant of the
cancer cell line MDA-MB-231 administered with oral NaHCO3treatment. The result of their study showed that systemic NaHCO3treatment increased the pHe of tumor tissue and demonstrated some therapeutic effects such as reduced number and size of cancer metastasis in the lungs, visceral organs, and lymph nodes (18). Further-more, a study by Xie et al. (19) showed that subcutaneous NaHCO3treatment to breast cancer tissue in rats, which was formed after inoculating the 4T1 breast cancer cell into the rat’s mammary fat pad, caused increased intra-tumoral pH and necrosis.
Our study evaluated the BCSCs response to the alkaline extracellular environment in anin vitrostudy by performing alkalinization using NaHCO3. The response was assessed, particularly the cell capacity in regulat-ing pH, metabolic status, and cell survival. Our study demonstrated that BCSCs gave a rapid response to the alkalinization as shown by reduced pHe from 8.84±
0.00 to 8.08±0.01 after 6 h of incubation and down
to 7.96±0.00 after 48 h. Although reduced pHe was
also found in the non-alkalinized groups and the medium without cells, the reduction was not as fast as the alkalinized culture (Table 2).
As demonstrated in Figure 1C, the extracellular alkalinization by NaHCO3 supplementation in BCSC culture induced the synthesis of CA9 and the activity of CAe in order to reduce pHe. It seems that carbonate anhydrase had an active role in rapid response to reduced pHe after alkalinization as shown by increased expression of mRNA CA9, which was followed by increased CAe activity. CA9 has been demonstrated to have a role in regulating extracellular and intracellular pH as shown by a study using spheroids (20). The fast response of CA9 in regulating alkaline pHe seemed not under the regulation of HIF1a. The role of HIF1ain upregulating the expression of CA9-encoding gene appeared after 24-h incubation, when the pHe had reduced to 8.01. The results showed that the HIF1a was unlikely to play a major role in pH Figure 5. Breast cancer stem cells (BCSCs) after 24-h incubation with non-alkalinized medium (A) and 100 mM NaHCO3alkalinized medium
regulation under alkaline pHe, in particular by regulating the CA9.
Nonetheless, HIF1aseemed to play a significant role in the regulation of BCSCs metabolic shifts in alkaline con-ditions. This study showed that the GLUT1 gene expres-sion pattern was similar to the HIF1a’s in which the expression of both genes was increased under alkaline pHe. In this case, alkaline pHe in a specific point appeared to have a role as one of the non-hypoxic factors that may induce and activate HIF1a (21). But it should also be considered that alkaline pHe might also inhibit the HIF1a degradation, leading to HIF1astabilization. This notion still needs to be elucidated.
The HIF1a inhibition using FM19G11 proved that the increase of HIF1aexpression after 24 h extracellular alkalinization was a cellular adaptive response towards significant pHe decrease through up-regulating the expression of GLUT1, leading to the increase of glucose uptake for glycolysis. As a result of glycolysis under HIF1a regulation, the intracellular LDH activity was increased in
order to catalyze the production of intracellular lactate. This process was followed by the increase of extracellular lactate level, as previously described (22). However, although the increased LDH activity after 48-h extracel-lular alkalinization was higher than after 24 h, the intra-cellular lactate level was significantly decreased in line with the decrease HIF1aand GLUT1 expression, suggesting the metabolic shift towards a more oxidative phenotype. The high increase of extracellular lactate after 48-h alkalinization indicates that intracellular lactate has been exported to extracellular compartment. Based on this analysis, we highlight that HIF1amay affect the metabolic shift towards glycolytic phenotype through the regulation of GLUT1 expression and intracellular lactate, leading to cell death (22).
The hint to metabolic inversion in BCSCs from 24- to 48-h alkalinization was also supported by our O2 consump-tion data. The HIF1a-regulated glycolytic phenotype of BCSC metabolism was related to the reduction of O2 consumption within 24-h extracellular alkalinization. Figure 6. Viable breast cancer stem cells (BCSCs) measured using the trypan blue exclusion assay after 24-h incubation in cultures alkalinized with various concentrations of NaHCO3(mM) (A). Viable BCSCs measured every 6 h until 48-h incubation in culture
alkalinized with 100 mM NaHCO3compared to the non-alkalinized (B). Percent of lysed cells determined using the measurement of %
lactate dehydrogenase released into the culture medium (C). Apoptosis was determined using annexin V/propidium iodide assay after 24-h incubation with 100 mM NaHCO3. Q1: necrosis; Q2: late apoptosis and necrosis; Q3: viable cells; Q4: early apoptosis (D). Data are
However, this phenomenon was reversed into increased O2 consumption after 48-h, meaning that the BCSC metabolism was switched from more glycolytic to oxida-tive, as also endorsed by the data of pHe, and intracellular and extracellular lactate levels. Following 48-h incubation, pHe of BCSC culture was reduced to 7.96. It is possible that at such pHe, the BCSCs returned to their initial metabolic states, i.e. more oxidative. In addition, the high concentration of lactate in the extracellular environment could induce a backflow of lactate into the BCSCs and activate the oxidative phosphorylation. This assumption could be verified by our parallel study investigating the up-regulated expression of monocarboxylate transporter-1 (MCT1) and LDH-B genes in the 48-h alkalinized BCSCs (unpublished data, Neolaka GMG, Yustisia I, Sadikin M, Wanandi SI). MCT1 facilitates the influx of lactate into the cells, while LDH-B isozyme converts lactate into pyruvate. Another previous study has likewise denoted the occur-rence of metabolic shift, in which the 4T1 breast cancer cells of rats under lactate acidosis condition became less glycolytic but more oxidative (19). It should be noted that following 48-h cell culture under physiological pHe (B7.40), BCSCs shifted their metabolism to be more
glycolytic due to a rapid cell proliferation according to the Warburg effect (23), signifying that the metabolic shift of BCSCs occurred in a distinct way under physiological conditions.
Our study showed that after 24-h alkalinization at a pH range of 7.10–8.24, BCSCs growth was inhibited starting at pHe of 7.39 following the alkalinization using 10 mM NaHCO3. However, at a pHe range of 7.39–7.95, there was an increased number of living cells in BCSCs, which indicated the presence of cell proliferation, although the increased number was lower than that in the non-alkalinized culture. Reduced number of living BCSCs occurred at pHe 8.07 and 8.24 following the alkalinization with 75 and 100 mM NaHCO3, respectively. It seemed that the death of BCSCs was initiated at pHe48.00. The PDT of BCSCs following the alkalinization with 100 mM NaHCO3was lower and needed a longer time than that of the non-alkalinized culture. Alkalinization had a low cytotoxic effect to BCSCs, only up to 2.25% of LDH was found in the medium after 48-h incubation. This result was confirmed by Annexin V/PI apoptosis assay, which demonstrated that only 0.3% necrotic cells were detected while the early and late apoptosis was 71.8 and 5.1%, respectively after 24-h incubation.
Here, we suggest that the high intracellular lactate level in BCSCs under extracellular alkalinized culture could induce acidic pHi and might be an essential cell response to reduce alkaline pHe. This response is pos-sibly regulated by the Warburg effect through a metabolic shift towards a glycolytic phenotype. It has been reported that the acidic intracellular pH could induce apoptosis via three possible mechanisms. First, by altering the
membrane potential of mitochondria; second, by activat-ing the key enzyme that mediates the DNA fragmentation; and third, by increasing caspase-3 activation responsible for apoptosis execution (24,25). Moreover, it has been demonstrated that the mitochondria under alkaline pHe become vulnerable or unstable due to Ca2+ overload, leading to permeability transition, pore opening, and thus cell apoptosis (22,26).
Metabolic status shift due to alkalinization seemed to affect the survival of BCSCs. Under the conditions where the cells showed their metabolic preference to glycolytic phenotypes, cell proliferation was suppressed and cell death was induced in part. Our study revealed that alkalinization was likely to promote apoptosis rather than necrosis. Conversely, when the cells showed more oxidative phenotype as seen after 48-h culture in alkaline pHe, the cell proliferation increased. Nevertheless, we ascertained that the alteration of cell proliferation and apoptosis during extracellular alkalinization were not regulated by HIF1a. The present study implies that there may be a dynamic relationship between the changes of pHe, metabolism, and cell proliferation. BCSCs also showed a high adaptability to the changes of microenvironment pH. The role of HIF1aon the regulation of BCSCs adaptive response also needs to be considered, since it is known that under hypoxia HIF1ainhibits the proliferation of stem cells via down-regulation of the expression of c-Myc gene as a major pluripotent gene (4). Further studies are necessary to explain whether the increased HIF1aexpression under alkaline pHe and normoxia may similarly down-regulate the expression of c-Myc and other stemness genes.
In conclusion, alkalinization caused increased glyco-lytic phenotypes of BCSCs in the form of increased glucose consumption, lactate production, LDH activity and reduced oxygen consumption, which in turn played a role in inducing apoptosis and suppressed BCSCs prolif-eration. Further studies are necessary to explain the correlation between alkalinization, glycolysis, apoptosis and proliferation of BCSCs. Comprehensive knowledge on this subject may become an adequate basic principle in developing target therapy, which is based on the mutual interaction between tumor microenvironment and the metabolism of cancer stem cells.
Acknowledgments
References
1. Swartz MA, Iida N, Roberts EW, Sangaletti S, Wong MH, Yull FE, et al. Tumor microenvironment complexity: emer-ging role in cancer therapy.Cancer Res 2012; 72: 2473–
2480, doi: 10.1158/0008-5472-.CAN-12-0122.
2. Lu P, Weaver VM, Werb Z. The extracellular matrix: a dynamic niche in cancer progression.J Cell Biol2012; 196: 395–406, doi: 10.1083/jcb.201102147.
3. Sounni NE, Noell A. Targeting the tumor microenvironment for cancer therapy.Clin Chem2013; 59: 85–93, doi: 10.1373/
clinchem.2012.185363.
4. Plaks V, Kong N, Werb Z. The cancer stem cell niche: how essential is the niche in regulating of tumor cells?Cell Stem Cell2015; 16: 225–238, doi: 10.1016/j.stem.2015.02.015.
5. Borovski T, De Sousa E Melo F, Vermeulen L, Medema JP. Cancer stem cell niche: the place to be.Cancer Res2011; 71: 634–639, doi: 10.1158/0008-5472.CAN-10-3220. 6. Vlashi E, Lagadec C, Vergnes L, Matsutani T, Masui K,
Poulou M, et al. Metabolic state of glioma stem cells and nontumorigenic cells.Proc Natl Acad Sci U S A2011; 108: 16062–16067, doi: 10.1073/pnas.1106704108.
7. Vlashi E, Lagadec C, Vergnes L, Reue L, Frohnen P, Chan M, et al. Metabolic differences in breast cancer stem cells and differentiated progeny.Breast Cancer Res Treat2014; 146: 525–534, doi: 10.1007/s10549-014-3051-2.
8. Feng W, Gentles A, Nair RV, Huang M, Lin Y, Lee CY, et al. Targeting unique metabolic properties of breast tumor initiati-ng cells. Stem Cell 2014; 32: 1734–1745, doi: 10.1002/
stem.1662.
9. Webb BA, Chimenti M, Jacobson MP, Barber DL. Dysregulated pH: a perfect storm for cancer proggression.Nat Rev Cancer
2011; 11: 671–677, doi: 10.1038/nrc3110.
10. Damaghi M, Wojtkowiak JW, Gillies RJ. pH sensing and regulation in cancer.Front Physiol 2013; 4, doi: 10.3389/ fphys.2013.00370.
11. Swietach P, Vaughas-Jones RD, Harris AL. Regulation of tumor pH and the role of carbonic anhydrase 9. Cancer Metastasis Rev2007; 26: 299–310, doi: 10.1007/s10555-007-9064-0.
12. Rigobello-Masini M, Aidar E, Masini JC. Extra and intrace-lular activities of carbonic anhydrase of the marine microalga
Tetraselmis gracilis(Chlorophyta). Braz J Microbiol2003; 34: 267–272, doi: 10.1590/S1517-83822003000300017.
13. Moreno-Manzano V, Rodriguez-Jiménez FJ, Acena-Bonilla JL, Fustero-Lardíes S, Erceg S, Dopazo J, et al. FM19G11, a new hypoxia-inducible factor (HIF) modulator, affects stem cell differentiation status. J Biol Chem 2010; 285: 1333–
1342, doi: 10.1074/jbc.M109.008326.
14. Gloria MA, Cenedeze MA, Pacheco-Silva A, Câmara NOS. The blockade of cyclooxygenases-1 and -2 reduces the effects of hypoxia on endothelial cells.Braz J Med Biol Res
2006; 39: 1189–1196, doi: 10.1590/S0100-879X20060009
00006.
15. Davis JM. Basic techniques and media, the maintenance of cells lines, and safety. In: Davis JM (Editor),Animal cell culture. Chichester: Wiley-Blackwell; 2011. p 91–125, doi:
10.1002/9780470669815.ch4.
16. Sediakova O, Stastova E, Takacova M, Kopacek J, Pastorek J, Pastorekova S. Carbonic anhydrases IX, a hypoxia-induced catalytic component of the pH regulating machinery in tumors.Front Physiol2014; 4, doi: 10.3389/fphys.2013. 00400.
17. Paramita R, Sadikin M, Sutandyo N, Wanandi SI. Effect of hypoxia-inducible factor-1ainduction by CoCl2on breast cancer
cells survival: influence of cytochrome-c and survivin.Med J Indones2014; 23: 139–146, doi: 10.13181/mji.v23i3.933.
18. Robey IF, Baggett BK, Kirkpatrick ND, Roe DJ, Dosescu J, Sloane BF, et al. Bicarbonate increases tumor pH and inhibits spontaneous metastases. Cancer Res 2009; 69: 2260–2268, doi: 10.1158/0008-5472.CAN-07-5575. 19. Xie J, Wu H, Dai C, Pan Q, Ding Z, Hu D, et al. Beyond
Warburg effect – dual metabolic nature of cancer cells.
Sci Rep2014; 4: 4927, doi: 10.1038/srep04927.
20. Swietach P, Patiar S, Supuran CT, Harris AL, Vaughan-Jones RD. The role of carbonic anhydrase 9 in regulating extracellular and intracellular pH in three-dimensional tumor cell growths. J Biol Chem 2009; 284: 20299–20310, doi:
10.1074/jbc.M109.006478.
21. Dery MC, Michaud MD, Richard DE. Hypoxia inducible factor 1: regulation by hypoxic and non-hypoxic activators.
Int J Biochem Cell Biol 2005; 37: 535–540, doi: 10.1016/
j.biocel.2004.08.012.
22. Mazzio EA, Boukli N, Rivera N, Soliman KF. Pericellular pH homeostasis is a primary function of the Warburg effect: inversion of metabolic systems to control lactate steady state in tumor cells.Cancer Sci2012; 103: 422–432, doi:
10.1111/j.1349-7006.2012.02206.x.
23. Heiden MGV, Cantley LC, Thompson CB. Understanding the Warburg effect: the metabolic requirements of cell proliferation.Science2009; 324: 1029–1033, doi: 10.1126/ science.1160809.
24. Thammasit P, Sangboonruang S, Suwanpairoj S, Khamaikawin W, Intasai N, Kasinrerk W, et al. Intracellular acidosis promotes mitochondrial apoptosis pathway: role of EMMPRIN down-regulation via specific single-chain Fv intrabody. J Cancer
2015; 6: 276–286, doi: 10.7150/jca.10879.
25. Matsuyama S, Llopis J, Deveraux QL, Tsien RY, Reed JC. Changes in intramitochondrial and cytosolic pH: early events that modulate caspase activation during apoptosis.Nat Cell Biol2000; 2: 318–325, doi: 10.1038/35014006.
26. Ichas F, Mazat JP. From calcium signaling to cell death: two conformations for the mitochondrial permeability transition pore. Switching from low- to high-conductance state.Biochim Biophys Acta 1998; 1366: 33–50, doi: 10.1016/S0005-2728