RELATIONSHIP BETWEEN PANICLE DIFFERENTIATION
AND MAIN STEM LEAF NUMBER IN RICE GENOTYPES
AND RED RICE BIOTYPES
Nereu Augusto Streck1*; Isabel Lago2; Leosane Cristina Bosco3; Gizelli Moiano de Paula2; Felipe Brendler Oliveira1; Luana Fernandes Gabriel1; Ana Paula Schwantes1
1
UFSM/CCR - Depto. de Fitotecnia - 97105-900 - Santa Maria, RS - Brasil. 2
UFSM/CCR - Programa de Pós-Graduação em Engenharia Agrícola. 3
UFSM/CCR - Programa de Pós-Graduação em Agronomia. *Corresponding author <[email protected]>
ABSTRACT: Panicle differentiation (DP) is a key developmental stage in rice (Oryza sativa L.) because at this stage plant switches from vegetative to reproductive development and source-sink relation changes to allocate part of the photoassimilates for growing spikelets and kernels. The objective of this study was to determine the main stem Haun Stage (HS) and the number of leaves that still have to emerge until flag leaf at PD in several cultivated rice genotypes and red rice biotypes in different sowing dates. A two-year field experiment was conducted in Santa Maria, Rio Grande do Sul State, Brazil, during the 2005–2006 and 2006–2007 growing seasons, and three sowing dates each year. Nine cultivated rice genotypes and two red rice biotypes were used. PD was identified as the R1 stage of the COUNCE scale, by sampling four plants from each genotype on a daily basis. When 50% of the sampled plants were at R1, the main stem HS was measured in 20 plants per genotype. The main stem final leaf number (FLN) was measured in these 20 plants when the collar of the flag leaf was visible. HS at PD is related to FLN in many cultivated rice genotypes and red rice biotypes, and that at PD, the number of leaves still to emerge until flag leaf is not constant for all the rice genotypes. These findings are not in agreement with reports in the literature.
Key words: Oryza sativa L., COUNCE scale, Haun Stage, crop management, flag leaf
RELAÇÃO ENTRE DIFERENCIAÇÃO DA PANÍCULA E NÚMERO DE
FOLHAS NO COLMO PRINCIPAL EM GENÓTIPOS DE ARROZ E
BIÓTIPOS DE ARROZ VERMELHO
RESUMO: A diferenciação da panícula (DP) é um importante estágio do desenvolvimento em arroz (Oryza sativa L.), pois é nesse estágio que a planta passa do desenvolvimento vegetativo para o desenvolvimento reprodutivo e a relação fone-dreno muda para alocar parte dos fotoassimilados para crescimento de espiguetas e grãos. O objetivo deste estudo foi determinar o Estágio de Haun (EH) no colmo principal e o número de folhas que ainda faltam emergir até o aparecimento da folha bandeira por ocasião da DP em vários genótipos de arroz cultivado e biótipos de arroz vermelho, em diferentes datas de semeadura. Um experimento de campo foi conduzido em Santa Maria, RS, durante os anos agrícolas 2005–2006 e 2006–2007, com três datas de semeadura cada ano. Foram usados nove genótipos de arroz cultivados e dois biótipos de arroz vermelho. A DP foi identificada como o estágio R1 da escala de COUNCE, amostrando-se diariamente quatro plantas de cada genótipo. Quando 50% das plantas estavam em R1, foi medido o EH no colmo principal em 20 plantas por genótipo. O número final de folhas no colmo principal (NFF) foi observado nestas mesmas 20 plantas, quando o colar da folha bandeira estava visível. O EH na DP está relacionado com o NFF em vários dos genótipos de arroz cultivado e nos biótipos de arroz vermelho, e que o número de folhas que ainda faltam emergir na DP não é constante para todos os genótipos de arroz estudados. Estes resultados discordam com os relatados na literatura. Palavras-chave: Oryza sativa L., escala de COUNCE, Estágio de Haun, manejo, folha bandeira
INTRODUCTION
Panicle differentiation (PD) is a key develop-mental stage in rice (Oryza sativa L.) because at this stage plant switches from vegetative to reproductive
is destructive, which is a disadvantage because of the need of dissecting plants and trained personal (Stansel, 1975). The search for plant morphological indicators for PD that are easily identifiable with non-destructive methods is a good research rationale.
In small grain crops, including rice, the num-ber of accumulated or emerged leaves on the main stem (NL) is often represented by the Haun Stage (HS) (Haun, 1973). The NL in rice is related to the timing of several plant developmental stages such as tillering (Tivet et al., 2001; Jaffuel & Dauzat, 2005; Watanabe et al., 2005), PD (Ellis et al., 1993; Lee et al., 2001; Watanabe et al., 2005), booting and anthesis (Counce et al., 2000; Watanabe et al., 2005). Yin & Kropff (1998) reported that at PD, there are still about three leaves to appear until the flag leaf appears at the whorl of the main stem. Freitas et al. (2006) found that PD occurs when there are seven fully expanded leaves on the main stem and did not vary among three genotypes varying in developmental cycle and in three sowing dates. Streck et al. (2006a) showed that final leaf num-ber (FLN) varied among seven rice cultivars and among sowing dates. Combinning the results by Yin & Kropff (1998) and Streck et al. (2006a) implies that the NL at PD varies among genotypes and sowing dates, which is conflicting with the results reported by Freitas et al. (2006). The objective of this study was to de-termine the main stem HS and the number of leaves left to emerge until flag leaf at panicle differentiation in several cultivated rice genotypes and in two red rice biotypes in different sowing dates.
MATERIAL AND METHODS
A two-year field experiment was conducted during the 2005–2006 and 2006–2007 growing sea-sons in Santa Maria, Rio Grande do Sul State, Brazil (29º43’ S, 53º 43’ W, and altitude: 95 m). In the 2005–2006 growing season, plants were grown in 12 liter (30 cm diameter and 26 cm height) pots and in the 2006–2007 growing season, plants were grown both in pots and in a 10-ha paddy rice field located about 600 m from the pot experiment site. Pots were buried in the soil to maintain soil temperature similar to the soil temperature of the surrounding area. Pot spacing was 1.5 m × 0.8 m, so that shading was not a major factor affecting plant growth (Peterson et al., 1984). Plots in the rice pad were composed of four 1 m rows spaced 17 cm among rows. Soil type at the experimental site was a Rhodic Paleudalf (USDA Taxonomy). The experimental design was a com-pletely randomized, with four replications. A replica-tion was a pot in the pot experiment and a plot in the field experiment.
For the pot-grown plants, three sowing dates (day/month/year) were used each year: 25/09/2005, 26/11/2005 and 02/02/2006 in the 2005–2006 grow-ing seasons, and 08/11/2006, 13/12/2006 and 16/01/ 2007 in the 2006–2007 growing season. Each repli-cation was a pot with 15 plants. Nine cultivated rice genotypes (IRGA 421, IRGA 416, IRGA 417, IRGA 420, BR- IRGA 409, BRS 7 TAIM, EEA 406, EPAGRI 109 and a hybrid (not commercially released yet by the Instituto Rio-Grandense do Arroz - IRGA) and two red rice biotypes (awned yellow-hull and awned black-hull) were used in the pot experiment. Red rice was included in the study because it is a major weed in paddy rice fields in Southern Brazil (Marchezan, 1994; Marchezan et al., 2004). In the paddy rice field, two sowing dates were used (13/12/2006 and 16/01/2007) with two cultivated rice cultivars (IRGA 421 and EPAGRI 109).
The rice genotypes were chosen because they are widely grown in Southern Brazil, they represent two subspecies of Oryza sativa (japonica and indica), and they have a broad range of developmental cycles, vary-ing from very early (IRGA 421) to late (EPAGRI 109) maturation. The red rice biotypes are often found in paddy rice fields in Southern Brazil, plants have broad leaves and are tall. The cultivar EEA 406 is an old, japonica rice cultivar often used as a simulator of red rice in crop-weed competition studies (Agostinetto, 2003; Agostinetto et al., 2004). The wide range of sow-ing dates within each year was chosen to have plants growing and developing under different temperatures and photoperiods, which render rice plants different FLN (Streck et al., 2006a), and correspond to sowing dates before, during, and after the recommended sow-ing calendar for this location, which is from 01st of Oc-tober to 10th of December (Sosbai, 2005).
Fertilization followed local recommendations for irrigated rice (Sosbai, 2005). In the pots, 20 g per pot of 7-11-9 fertilizer was used at sowing. Nitrogen dressing was applied at the beginning of tillering (V4 stage of the Counce et al., 2000 scale) and at panicle differentiation (R1 stage of Counce et al., 2000 scale) with urea at a rate of 8.5 g per pot. The same fertil-izer rates were applied in the field plots, correspond-ing to 300 kg ha–1 of 7-11-9 NPK fertilizer and 222 kg ha–1 of urea. At V3 stage of the Counce et al. (2000) scale, plants in the pots were thinned to 15 plants in each pot, resulting in a plant density of about 200 plants m–2
Five plants in each pot and five plants in the central row of the paddy field plots were tagged with colored wires one week after plant emergence. Plants located in the central part of the pot were selected for tagging. In doing so, we tried to achieve a red-far red balance similar to the one encountered in a paddy rice field, as this balance is affected by the proximity of nearest neighbor plant and affects development in small grains (Wilhelm & McMaster, 1995).
Panicle differentiation (Stage R1 of the Counce et al., 2000 scale) was identified by sampling four plants from each genotype on a daily basis. PD was identified by sampling four plants (one plant from each replication) and cutting the main stem of these plants length wise, and a 2 mm long white and a fuzzy panicle similar to a small cotton ball was visible (Stansel, 1975). When 50% (two out of four) plants were at R1, the main stem HS, which is the number of fully expanded leaves plus the ratio of the length of the ex-panding leaf to the penultimate leaf (Haun, 1973), was measured in the five tagged plants per replication. The main stem final leaf number (FLN) was counted on the main stem of the tagged plants when the colar of the flag leaf was visible.
Statistical analysis was performed assuming a two-factor experiment within years in the pot experi-ment and for the paddy rice field experiexperi-ment, with fac-tor A = genotype and facfac-tor D = sowing date. Vari-ables of interest were HS at R1, the number of leaves still to appear until flag leaf at R1 represented by the difference between main stem HS at R1 [FLN – (HS at R1)] and FLN. Means of these variables were dis-tinguished by Tukey test (p < 0.05). Variables HS at R1 and [FLN – (HS at R1)] were regressed against
FLN and the probability (p) values of the simple lin-ear regression are presented.
RESULTS AND DISCUSSION
Final leaf number (FLN) varied among geno-types and among sowing dates from about 10 to 19 leaves. Among genotypes, early cultivars had lower FLN (e.g. IRGA 421 had FLN from about 10 to 13 leaves) whereas late cultivars had higher FLN (e.g. EPAGRI 109 had FLN from about 16 to 19 leaves). These results are in agreement with previous reports that developmental cycle in rice is related to FLN, i. e., the greater the FLN the longer the developmental cycle (Streck et al., 2006b). Among sowing dates, FLN was greater in early sowing dates and lower in late sowing dates, which is also in agreement with previ-ous studies (Streck et al., 2006a). This wide range in FLN due to different genotypes and sowing dates pro-vides a rich data set to test the hypothesis of this study, which was that the HS can be used as a plant morphological indicator to identify PD in rice and red rice, and that the HS at PD varies among genotypes and among sowing dates.
Analysis of variance showed significant effect of the factors genotype and sowing date for the vari-ables HS at R1, FLN – (HS at R1) and FLN in both years for the pot experiment (Table 1). The mean square was greater for the factor genotype than for the factor sowing date, except for FLN in the 2006– 2007 growing season indicating that, in general, both variables are more affected by the genetic constitution than by the environment. The interaction genotype × sowing date was significant for all three variables in
Table 1 - Mean square values of the ANOVA for the variables Haun Stage at panicle differentiation (HS at R1), difference between main stem final leaf number and HS at R1 [FLN – (HS at R1)] and final leaf number (FLN) in nine cultivated rice genotypes and two red rice biotypes grown in pots in three sowing dates during two growing seasons. Santa Maria, RS, 2005–2007.
*Significant at 5%. s n o i t a i r a v f o s e c r u o
S MeanSquare
1 R t a S
H FLN –(HSatR1) FLN
n o s a e s g n i w o r G 6 0 0 2 -5 0 0 2
) A ( e p y t o n e
G 16.40* 5.00* 14.38*
) D ( e t a d g n i w o
S 10.85* 4.70* 3.28*
A× D 0.74* 1.61* 0.56*
) % ( n o i t a i r a V f o t n e i c i f f e o
C 4.05 19.58 4.15
n o s a e s g n i w o r G 7 0 0 2 -6 0 0 2
) A ( e p y t o n e
G 10.65* 0.74* 51.69*
) D ( e t a d g n i w o
S 1.44* 0.28 55.39*
A× D 0.53* 0.44* 2.47*
) % ( n o i t a i r a V f o t n e i c i f f e o
both years, and therefore the statistical analysis was performed accordingly (Table 2, 3 and 4). Plants in the 16/01/2007 sowing date died before R1 due to un-known factors, therefore there are no data in the blank spaces of Tables 2, 3 and 4. We missed the time of R1 for cultivar IRGA 421 in the second sowing date in the paddy rice field experiment and therefore the ANOVA was performed comparing the two cultivars in the first sowing date and comparing the two sow-ing dates only for cultivar EPAGRI 109 (Table 5).
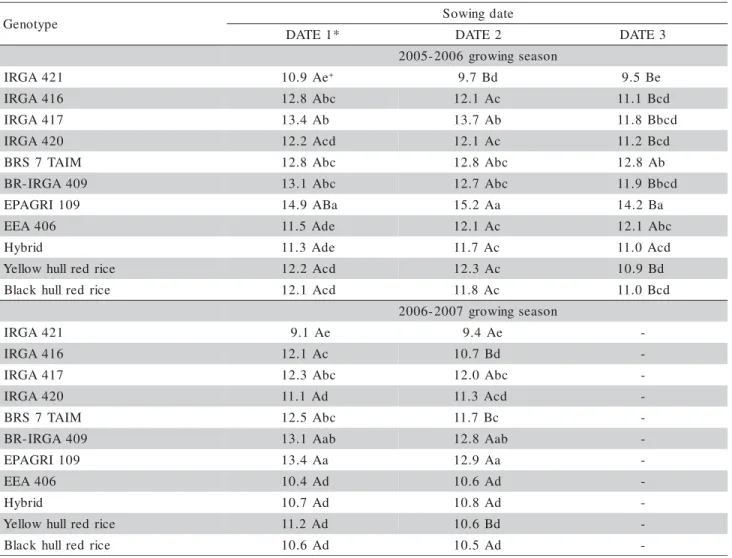
Among genotypes, the HS at R1 was the great-est for cultivar EPAGRI 109 and the lowgreat-est for culti-var IRGA 421 in all sowing dates in both years in the pot experiment (Table 2) and in the paddy rice field experiment (Table 5). These two cultivars are very dis-tinct in FLN (Table 4) and developmental cycle (very early and late). Other rice cultivars and red rice bio-types were intermediate in FLN (Table 4) and
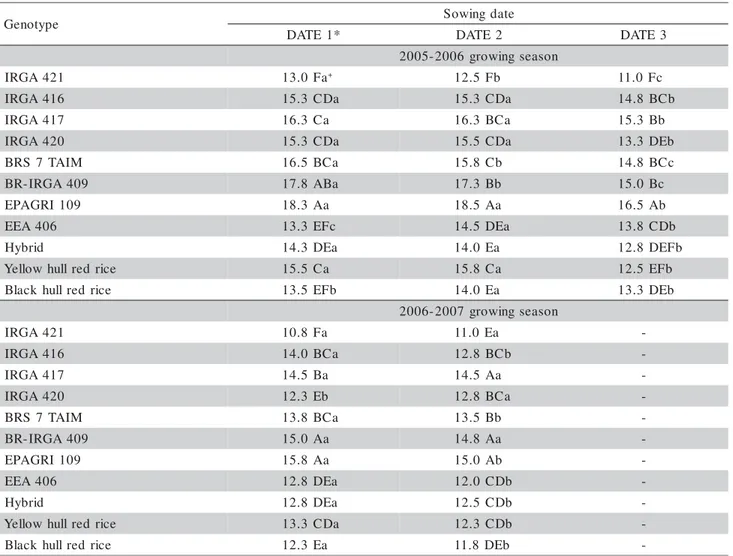
devel-opmental cycle between these two cultivars, and the HS at R1 values were intermediate too. These results suggest a relationship between HS at R1 and FLN. To test this hypothesis, we plotted HS at R1 against FLN pooling data from all genotypes in Figure 1a (year 2005–2006) and in Figure 1c (year 2006–2007) and a highly significant linear positive relationship was evi-dent for both years (R2 = 0.73 and R2 = 0.88). Con-sidering the two growing seasons, FLN varied from about 10 to 19 leaves and HS at R1 varied from about 9 to 16 leaves. The slope of the linear regressions in-dicates that there is a general increase of 0.6 and 0.8 HS at R1 for each FLN increase. Among sowing dates, in general the HS at R1 decreased as sowing date was delayed in both years in the pot experiment (Table 2) and in the paddy rice field experiment (Table 5). These results are also associated with a decrease in FLN with delayed sowing dates (Table 4 and 5).
Table 2 - Haun Stage at panicle differentiation (HS at R1) in nine cultivated rice genotypes and two red rice biotypes grown in pots in three sowing dates during two growing seasons. Santa Maria, RS, Brazil, 2005–2007.
*For the 2005–2006 growing season, DATE 1 = 25/09/2005, DATE 2 = 26/11/2005, DATE 3 = 02/02/2006. For the 2006–2007 growing season, DATE 1 = 08/11/2006, DATE 2 = 13/12/2006. + Means followed by the same upper case letters within rows and lower case
letters within columns are not different (Tukey test, p < 0.05). e
p y t o n e
G Sowingdate
* 1 E T A
D DATE2 DATE3
n o s a e s g n i w o r g 6 0 0 2 -5 0 0 2
1 2 4 A G R
I 10.9Ae+ 9.7 Bd 9.5Be
6 1 4 A G R
I 12.8Abc 12.1Ac 11.1Bcd
7 1 4 A G R
I 13.4Ab 13.7Ab 11.8Bbcd
0 2 4 A G R
I 12.2Acd 12.1Ac 11.2Bcd
M I A T 7 S R
B 12.8Abc 12.8Abc 12.8Ab
9 0 4 A G R I -R
B 13.1Abc 12.7Abc 11.9Bbcd
9 0 1 I R G A P
E 14.9ABa 15.2Aa 14.2Ba
6 0 4 A E
E 11.5Ade 12.1Ac 12.1Abc
d i r b y
H 11.3Ade 11.7Ac 11.0Acd
e c i r d e r l l u h w o l l e
Y 12.2Acd 12.3Ac 10.9Bd
e c i r d e r l l u h k c a l
B 12.1Acd 11.8Ac 11.0Bcd
n o s a e s g n i w o r g 7 0 0 2 -6 0 0 2
1 2 4 A G R
I 9.1Ae 9.4Ae
-6 1 4 A G R
I 12.1Ac 10.7Bd
-7 1 4 A G R
I 12.3Abc 12.0Abc
-0 2 4 A G R
I 11.1Ad 11.3Acd
-M I A T 7 S R
B 12.5Abc 11.7Bc
-9 0 4 A G R I -R
B 13.1Aab 12.8Aab
-9 0 1 I R G A P
E 13.4Aa 12.9Aa
-6 0 4 A E
E 10.4Ad 10.6Ad
-d i r b y
H 10.7Ad 10.8Ad
-e c i r d e r l l u h w o l l e
Y 11.2Ad 10.6Bd
-e c i r d e r l l u h k c a l
-Table 3 - Difference between main stem final leaf number and HS at R1 [FLN – (HS at R1)] in nine cultivated rice genotypes and two red rice biotypes grown in pots in three sowing dates during two growing seasons. Santa Maria, RS, Brazil, 2005-2007.
*For the 2005–2006 growing season, DATE 1 = 25/09/2005, DATE 2 = 26/11/2005, DATE 3 = 02/02/2006. For the 2006–2007 growing season, DATE 1 = 08/11/2006, DATE 2 = 13/12/2006. + Means followed by the same upper case letters within rows and lower case
letters within columns are not different (Tukey test, p < 0.05). e
p y t o n e
G Sowingdate
* 1 E T A
D DATE2 DATE3
n o s a e s g n i w o r g 6 0 0 2 -5 0 0 2
1 2 4 A G R
I 2.2Adef+ 2.9Abc 2.0Ac
6 1 4 A G R
I 2.6Bcdef 3.3ABbc 3.8Aab
7 1 4 A G R
I 3.0Abcde 3.1Abc 3.9Aa
0 2 4 A G R
I 3.0ABbcde 3.6Aabc 2.5Bbc
M I A T 7 S R
B 4.0Aab 3.0Bbc 2.3Bc
9 0 4 A G R I -R
B 5.1Aa 4.9Aa 3.1Babc
9 0 1 I R G A P
E 3.7Abc 3.4Abc 2.4Bc
6 0 4 A E
E 1.8Aef 2.4Ac 2.2Ac
d i r b y
H 2.9Abcdef 2.8Abc 2.3Ac
e c i r d e r l l u h w o l l e
Y 3.4Abcd 4.1Aab 2.0Bc
e c i r d e r l l u h k c a l
B 1.5Af 2.5Ac 2.4Ac
n o s a e s g n i w o r g 7 0 0 2 -6 0 0 2
1 2 4 A G R
I 2.2Aabc 2.1Aab
-6 1 4 A G R
I 2.3Aabc 2.3Aab
-7 1 4 A G R
I 2.5Aabc 2.9Aa
-0 2 4 A G R
I 1.8Ac 1.8Ab
-M I A T 7 S R
B 1.8Bc 2.4Aab
-9 0 4 A G R I -R
B 1.9Ac 2.2Aab
-9 0 1 I R G A P
E 2.9Aa 2.7Aa
-6 0 4 A E
E 2.8Aab 1.7Bb
-d i r b y
H 2.5Aabc 2.1Aab
-e c i r d e r l l u h w o l l e
Y 2.5Aabc 2.1Aab
-e c i r d e r l l u h k c a l
B 2.0Abc 1.6Ab
-With regard to the variable leaf number still to appear at R1 [FLN – (HS at R1)], differences among genotypes, among sowing dates and among years were small (two leaves at the most) but significant (Table 3 and 5). Among genotypes, the greatest FLN – (HS at R1) was for cultivar EPAGRI 109 and the lowest for cultivar IRGA 417. The later was not different from other genotypes such as IRGA 420, BRS 7 TAIM, EEA 406, the hybrid and the black hull red rice during the 2005–2006 growing season, and it was different only from the EPAGRI 109 during the 2006–2007 grow-ing season. These results indicate a weak relationship between the variable FLN – (HS at R1) and FLN. This weak relationship is apparent in Figures 1b and 1d, where we plotted all data pooled. The slope of the lin-ear regression was significant because of the high num-ber of points but the R2
was low for both growing
sea-sons, especially in 2006–2007 (Figure 1d). Among sowing dates, differences of FLN – (HS at R1) are smaller, with the lowest values in general observed in the latest sowing date.
e p y t o n e
G Sowingdate
* 1 E T A
D DATE2 DATE3
n o s a e s g n i w o r g 6 0 0 2 -5 0 0 2
1 2 4 A G R
I 13.0Fa+ 12.5Fb 11.0Fc
6 1 4 A G R
I 15.3CDa 15.3CDa 14.8BCb
7 1 4 A G R
I 16.3Ca 16.3BCa 15.3Bb
0 2 4 A G R
I 15.3CDa 15.5CDa 13.3DEb
M I A T 7 S R
B 16.5BCa 15.8Cb 14.8BCc
9 0 4 A G R I -R
B 17.8ABa 17.3Bb 15.0Bc
9 0 1 I R G A P
E 18.3Aa 18.5Aa 16.5Ab
6 0 4 A E
E 13.3EFc 14.5DEa 13.8CDb
d i r b y
H 14.3DEa 14.0Ea 12.8DEFb
e c i r d e r l l u h w o l l e
Y 15.5Ca 15.8Ca 12.5EFb
e c i r d e r l l u h k c a l
B 13.5EFb 14.0Ea 13.3DEb
n o s a e s g n i w o r g 7 0 0 2 -6 0 0 2
1 2 4 A G R
I 10.8Fa 11.0Ea
-6 1 4 A G R
I 14.0BCa 12.8BCb
-7 1 4 A G R
I 14.5Ba 14.5Aa
-0 2 4 A G R
I 12.3Eb 12.8BCa
-M I A T 7 S R
B 13.8BCa 13.5Bb
-9 0 4 A G R I -R
B 15.0Aa 14.8Aa
-9 0 1 I R G A P
E 15.8Aa 15.0Ab
-6 0 4 A E
E 12.8DEa 12.0CDb
-d i r b y
H 12.8DEa 12.5CDb
-e c i r d e r l l u h w o l l e
Y 13.3CDa 12.3CDb
-e c i r d e r l l u h k c a l
B 12.3Ea 11.8DEb
-Table 4 - Main stem final leaf number (FLN)in nine cultivated rice genotypes and two red rice biotypes grown in pots in three sowing dates during two growing seasons. Santa Maria, RS, Brazil, 2005–2007.
*For the 2005-2006 growing season, DATE 1 = 25/09/2005, DATE 2 = 26/11/2005, DATE 3 = 02/02/2006. For the 2006–2007 growing season, DATE 1 = 08/11/2006, DATE 2 = 13/12/2006. + Means followed by the same upper case letters within rows and lower case
letters within columns are not different (Tukey test, p < 0.05).
e p y t o n e
G HS atR1 FLN- (HSatR1) FLN
* 1 E T A
D DATE2 DATE1 DATE2 DATE1 DATE2
1 2 4 A G R
I 10.3 b+ - 2.1a - 12.3 b
-9 0 1 I R G A P
E 13.5aA 12.2 B 2.2aA 2.4A 15.6aA 14.6B
Table 5 - Haun Stage at panicle differentiation (HS at R1), difference between main stem final leaf number and HS at R1 [FLN – (HS at R1)] and final leaf number (FLN) in two cultivated rice genotypes grown in a paddy rice field in two sowing dates. Santa Maria, RS, Brazil, 2006-2007.
*DATE 1 = 13/12/2006, DATE 2 = 16/01/2007. + Means followed by upper case letters within rows and the same lower case letters
within columns are not different (Tukey test, p < 0.05).
was above 0.5 and p < 1% in six out of 11 genotypes (IRGA 420, BRS 7 TAIM, BR-IRGA 409, EPAGRI 109, EEA 406, and yellow hull red rice) in the 2005–2006 growing season, and in two out of 11 genotypes (EEA 406 and hybrid) in the 2006–2007 growing season (Table 7). These results indicate firstly that R1 is re-lated to FLN within a growing season at least in some rice genotypes, and secondly that at R1 the number of
differ-Figure 1 - Relationship between (a, c) main stem Haun Stage at panicle differentiation (HS at R1) and main stem final leaf number (FLN) and between (b, d) the difference between main stem final leaf number and HS at R1 [FLN – (HS at R1)] and FLN. Santa Maria, RS, Brazil, 2005-2007. Data of nine cultivated rice genotypes and two red rice biotypes are pooled. Each point is one replication (average of five plants). p = probability value.
y = 0.6113x + 2.9 p = 0.0001
R2= 0.73
8 10 12 14 16
10 12 14 16 18 20
HS
a
t
R1
2005–2006
Early cultivar (IRGA 421) Late cultivar (EPAGRI 109) Other rice cultivars Red rice biotypes
(a)
y = 0.3887x - 2.9 p = 0.0001
R2= 0.52
0 1 2 3 4 5 6
10 12 14 16 18 20
F
L
N
-(HS
a
t
R1
)
2005–2006
(b)
y = 0.8322x + 0.1 p = 0.0001
R2= 0.88
8 10 12 14 16
10 12 14 16 18 20
HS
a
t
R1
FLN 2006–2007
(c)
y = 0.1678x - 0.1 p = 0.0001
R2= 0.24
0 1 2 3 4 5 6
10 12 14 16 18 20
F
L
N
-(HS
a
t
R1
)
FLN 2006–2007
(d)
ence can have considerable impact on field manage-ment practices such as fertilizer application in a rice pad. For instance, the second nitrogen dressing in rice is recommended at R1 (Sosbai, 2005). If R1 is esti-mated based on main stem leaf number, the 2 to 8 leaves difference corresponds to 1 to 4 weeks differ-ence in calendar days, which can affect nitrogen use efficiency by the rice canopy. Another impact of such difference is when LN is used to estimate the end of the photoperiod-sensitive phase in rice, which ends at around R1 (Yin et al., 1997).
The number of leaves still to appear until flag leaf at R1 was reported to be constant at 3 leaves in a previous study (Yin & Kropff, 1998). Our results in-dicate that this assumption is not correct for all rice genotypes, as this variable was a function of FLN in some genotypes (Table 7, Figure 1b). Furthermore, the number of leaves still to emerge at R1 varied from val-ues as low as 1 leaf to valval-ues as high as 5 or 6 (Fig-ure 1b and 1d). These results indicate plasticity in cul-tivated rice and red rice development and a reminder
that reproductive development and vegetative develop-ment are related but independent processes.
Finally, the difference of the variables HS at R1 and FLN – (HS at R1) between plants grown in the pots and in the paddy rice field in the 2006–2007 growing season was not significant (ANOVA not shown). These results indicate that the data colleted in the pots in both years can be extended to a rice field.
ACKNOWLEDGEMENTS
and to F.B. Oliveira (Bolsa PIBIC/CNPq/UFSM) and from Coordenação de Aperfeiçoamento de Pessoal de Nível Superior - CAPES - at the Ministry of Education of Brazil to I. Lago, L.C. Bosco and G.M. de Paula (Bolsa de Mestrado) are greatly acknowl-edged.
REFERENCES
AGOSTINETTO, D. Aplicação de modelos matemáticos para estimar interferência de genótipos de arroz concorrentes e níveis de dano econômico em arroz irrigado. Porto Alegre: UFRGS, 2003. 200p. (Doutorado).
AGOSTINETTO, D.; FLECK, N.G.; RIZZARDI, M.A.; BIANCHI, M.A.; SILVA, P.R.F. Comparação de modelos matemáticos na estimativa das perdas de produtividade de grãos em arroz irrigado. Pesquisa Agropecuária Brasileira, v.39, p.847-856, 2004. COUNCE, P.; KEISLING, T.C.; MITCHELL, A.J. A uniform, objective, and adaptive system for expressing rice development. Crop Science, v.40, p.436-443, 2000.
ELLIS, R.H.; QI, A.; SUMMERFIELD, R.J.; ROBERTS, E.H. Rates of leaf appearance and panicle development in rice (Oryza sativa
L.): a comparison at three temperatures. Agricultural Forest Meteorology, v.66, p.129-138, 1993.
e p y t o n e
G LinearRegression
n o i t a u q
E p R2
n o s a e s g n i w o r g 6 0 0 2 -5 0 0 2
1 2 4 A G R
I y=0.572x+2.9 0.0265 0.40
6 1 4 A G R
I y=0.4262x+5.5 0.2021 0.15
7 1 4 A G R
I y=0.8159x- 0.3 0.0244 0.41
0 2 4 A G R
I y=0.4873x+4.6 0.0003 0.75
M I A T 7 S R
B y=0.0432x+12.1 0.8049 0.01
9 0 4 A G R I -R
B y=0.2933x+7.6 0.0151 0.55
9 0 1 I R G A P
E y=0.5288x+5.3 0.0001 0.84
6 0 4 A E
E y=0.2949x+7.8 0.0613 0.33
d i r b y
H y=0.7037x+1.5 0.0001 0.85
e c i r d e r l l u h w o l l e
Y y=0.398x+ 5.8 0.0001 0.79
e c i r d e r l l u h k c a l
B y=0.5991x+3.3 0.0484 0.36
n o s a e s g n i w o r g 7 0 0 2 -6 0 0 2
1 2 4 A G R
I y=0.5694x+2.9 0.0159 0.46
6 1 4 A G R
I y=0.7635x+0.9 0.0027 0.80
7 1 4 A G R
I y=0.8143x+0.1 0.0117 0.68
0 2 4 A G R
I y=0.8549x+0.1 0.0015 0.83
M I A T 7 S R
B y=0.7061x+2.1 0.0786 0.43
9 0 4 A G R I -R
B y=0.4225x+6.6 0.5528 0.06
9 0 1 I R G A P
E y=0.6698x+2.6 0.0001 0.71
6 0 4 A E
E y=-0.0894x+11.6 0.6895 0.03
d i r b y
H y=0.0974x+9.5 0.6557 0.03
e c i r d e r l l u h w o l l e
Y y=0.4425x+5.0 0.1703 0.29
e c i r d e r l l u h k c a l
B y=0.6007x+3.1 0.0108 0.69
Table 6 - Equation, probability (p) value, and coefficient of determination (R2) of the linear regression of main stem Haun
Stage at panicle differentiation (HS at R1 = y) against main stem final leaf number (FLN = x) in nine cultivated rice genotypes and two red rice biotypes in two growing seasons. Santa Maria, RS, Brazil, 2005–2007.
FREITAS, T.F.S.; SILVA, P.R.F.; STRIEDER, L.M.; SILVA, A.A. Validação de escala de desenvolvimento para cultivares brasileiras de arroz irrigado. Ciência Rural, v.36, p.404-410, 2006.
HAUN, J.R. Visual quantification of wheat development. Agronomy Journal, v.65, p.116-119, 1973.
JAFFUEL, S.; DAUZAT, J. Syncrhonism of leaf and tiller emergence relative to position and to main stem development stage in a rice cultivar. Annals of Botany, v.95, p.401-412, 2005. LEE, C.K.; LEE, B.W.; SHIN, J.C.; YOON, Y.H. Heading date and
final leaf number as affected by sowing date and prediction of heading date based on leaf appearance model in rice. Korean Journal of Crop Science, v.46, p.195-201, 2001.
MARCHEZAN, E. Arroz vermelho: caracterização, prejuízos e controle. Ciência Rural, v.24, p.415-421, 1994.
MARCHEZAN, E.; ÁVILA, L.A.; MAGALHÃES JÚNIOR, A.M.; MACHADO, S.L.; PETRINI, J.A. Controle do arroz vermelho. In: GOMES, A.S.; MAGALHÃES JÚNIOR, A.M. Arroz irrigado no Sul do Brasil. Brasília: Embrapa, 2004. p.547-573.
PETERSON, C.M.; KLEPPER, B.; PUMPHREY, F.V.; RICKMAN, R.W. Restricted rooting decreases tillering and growth of winter wheat. Agronomy Journal, v.76, p.861-863, 1984. SOCIEDADE SUL BRASILEIRA DE ARROZ IRRIGADO - SOSBAI.
e p y t o n e
G Linear Regression
n o i t a u q
E p R2
n o s a e s g n i w o r g 6 0 0 2 -5 0 0 2
1 2 4 A G R
I y=0.428x- 2.9 0.0805 0.27
6 1 4 A G R
I y=0.5738x- 5.5 0.0985 0.25
7 1 4 A G R
I y=0.1841x+0.3 0.5629 0.03
0 2 4 A G R
I y=0.5127x- 4.6 0.0002 0.76
M I A T 7 S R
B y=0.9568x- 12.1 0.0001 0.80
9 0 4 A G R I -R
B y=0.7067x- 7.6 0.0001 0.87
9 0 1 I R G A P
E y=0.4712x- 5.3 0.0002 0.80
6 0 4 A E
E y=0.7051x- 7.8 0.0007 0.74
d i r b y
H y=0.2963x- 1.5 0.0104 0.50
e c i r d e r l l u h w o l l e
Y y=0.602x- 5.8 0.0001 0.90
e c i r d e r l l u h k c a l
B y=0.4009x- 3.3 0.1631 0.20
n o s a e s g n i w o r g 7 0 0 2 -6 0 0 2
1 2 4 A G R
I y=0.4306x- 2.9 0.0532 0.32
6 1 4 A G R
I y=0.2365x- 0.9 0.1806 0.28
7 1 4 A G R
I y=0.1857x- 0.1 0.4462 0.10
0 2 4 A G R
I y=0.1451x- 0.1 0.3851 0.13
M I A T 7 S R
B y=0.2939x- 2.1 0.4121 0.11
9 0 4 A G R I -R
B y=0.5775x- 6.6 0.4232 0.11
9 0 1 I R G A P
E y=0.3302x- 2.6 0.0112 0.38
6 0 4 A E
E y=1.0894x- 11.6 0.0022 0.81
d i r b y
H y=0.9026x- 9.5 0.0048 0.76
e c i r d e r l l u h w o l l e
Y y=0.5575x- 5.0 0.0974 0.39
e c i r d e r l l u h k c a l
B y=0.3993x- 3.1 0.0517 0.49
Table 7 - Equation, probability (p) value, and coefficient of determination (R2) of the linear regression of difference between
main stem final leaf number and HS at R1 [FLN – (HS at R1) = y] against main stem final leaf number (FLN = y) in nine cultivated rice genotypes and two red rice biotypes in two growing seasons. Santa Maria, RS, Brazil, 2005–2007.
STANSEL, J.W. The rice plant: its development and yield. In: MILLER, J.C. Six decades of rice research in Texas. College Station: Texas A&M University, 1975. p.9-21. (Research Monograph, 4).
STRECK, N.A.; BOSCO, L.C.; MICHELON, S.; ROSA, H.T.; WALTER, L.C.; PAULA, G.M.; CAMERA, C.; LAGO, I.; MARCOLIN, E. Avaliação da resposta ao fotoperíodo em genótipos de arroz irrigado (Orysa sativa l.). Bragantia, v.65, p.533-541, 2006a.
STRECK, N.A.; BOSCO, L.C.; MICHELON, S.; WALTER, L.C.; MARCOLIN, E. Duração do ciclo de desenvolvimento de cultivares de arroz em função da emissão de folhas no colmo principal. Ciência Rural, v.36, p.1086-1093, 2006b. TIVET, F.; PINHEIRO, B.S.; RAISSAC, M.; DINGKUHN, M. Leaf
blade dimensions of rice (Oryza sativa L. and Oryza glaberrima
Stend.). Relationship between tillers and the main stem. Annals of Botany, v.88, p.507-511, 2001.
WATANABE, T.; HANAN, J.S.; ROOM, P.M.; HASEGAWA, T.; NAKAGAWA, H.; TAKAHASHI, W. Rice morphogenesis and plant architecture: measurement, specification and the reconstruction of structural development by 3D architectural modeling. Annals of Botany, v.95, p.1131-1143, 2005. WILHELM, W.W.; McMASTER, G.S. Importance of the
phyllochron in studying development and growth in grasses. Crop Science, v.35, p.1-3, 1995.
YIN, X.; KROPFF, M.J.; YNALVEZ, M.A. Photoperiodically sensitive and insensitive phases of preflowering in rice. Crop Science, v.37, p.182-190, 1997.
YIN, X.; KROPFF, M.J. The effect of photoperiod on interval between panicle initiation and flowering in rice. Field Crops Research, v.57, p.301- 307, 1998.
![Table 3 - Difference between main stem final leaf number and HS at R1 [FLN – (HS at R1)] in nine cultivated rice genotypes and two red rice biotypes grown in pots in three sowing dates during two growing seasons](https://thumb-eu.123doks.com/thumbv2/123dok_br/15858681.662238/5.918.105.837.159.716/table-difference-number-cultivated-genotypes-biotypes-growing-seasons.webp)
![Figure 1 - Relationship between (a, c) main stem Haun Stage at panicle differentiation (HS at R1) and main stem final leaf number (FLN) and between (b, d) the difference between main stem final leaf number and HS at R1 [FLN – (HS at R1)] and FLN](https://thumb-eu.123doks.com/thumbv2/123dok_br/15858681.662238/7.918.145.760.102.611/figure-relationship-stage-panicle-differentiation-number-difference-number.webp)

![Table 7 - Equation, probability (p) value, and coefficient of determination (R 2 ) of the linear regression of difference between main stem final leaf number and HS at R1 [FLN – (HS at R1) = y] against main stem final leaf number (FLN = y) in nine cultivat](https://thumb-eu.123doks.com/thumbv2/123dok_br/15858681.662238/9.918.102.835.160.717/table-equation-probability-coefficient-determination-regression-difference-cultivat.webp)
