Isabel Lago(1), Nereu Augusto Streck(1), Cleber Maus Alberto(1), Felipe Brendler Oliveira(1) and Gizelli Moiano de Paula(1)
(1)Universidade Federal de Santa Maria, Centro de Ciências Rurais, Departamento de Fitotecnia, CEP 97105‑900 Santa Maria, RS, Brazil.
E‑mail: [email protected], [email protected], [email protected], [email protected], [email protected]
Abstract – The objective of this study was to assess the development response of cultivated rice and red rice to different increases in minimum and maximum daily air temperatures, in Santa Maria, Rio Grande do Sul State, Brazil. One hundred years climate scenarios of temperatures 0, +1, +2, +3, +4, and +5oC, with symmetric and asymmetric increases in minimum and maximum daily air temperatures were created, using the LARS-WG Weather Generator, and a 1969–2003 database. Nine cultivated rice genotypes (IRGA 421, IRGA 416, IRGA 417, IRGA 420, BRS 7 TAIM, BR-IRGA 409, EPAGRI 109, EEA 406 and a hybrid), and two red rice biotypes (awned black hull-ABHRR, and awned yellow hull-AYHRR) were used. The dates of panicle differentiation (R1), anthesis (R4), and all grains with brown hulls (R9) were estimated with a nonlinear simulation model. Overall, the duration of the emergence–R1 phase decreased, whereas the duration of the R1–R4 and R4–R9 phases most often increased, as temperature increased in the climate change scenarios. The simulated rice development response to elevated temperature was not the same, when the increase in minimum and maximum temperature was symmetric or asymmetric.
Index terms: Oryza sativa, global warming, phenology, simulation, weeds.
Impacto do aumento na temperatura média do ar sobre o desenvolvimento
do arroz e do arroz‑vermelho
Resumo – O objetivo deste trabalho foi avaliar a resposta do desenvolvimento do arroz cultivado e do arroz vermelho a diferentes aumentos nas temperaturas mínima e máxima diárias do ar, em Santa Maria, RS, Brasil. Foram criados cenários climáticos de cem anos de 0, +1, +2, +3, +4 e +5oC, com aumentos simétricos e assimétricos nas temperaturas mínima e máxima diária do ar, usando o Weather Generator LARS-WG e uma base de dados de 1969–2003. Foram usados nove genótipos de arroz cultivado (IRGA 421, IRGA 416, IRGA 417, IRGA 420, BRS 7 TAIM, BR-IRGA 409, EPAGRI 109, um híbrido e EEA 406) e dois biótipos de arroz-vermelho (casca preta aristado e casca amarela aristado). A data da diferenciação da panícula (R1), a antese (R4) e todos os grãos com casca marrom (R9) foram estimados com um modelo não linear. Em geral, a duração da fase emergência–R1 diminuiu, enquanto a duração das fases R1–R4 e R4–R9 aumentaram, com o aumento da temperatura nos cenários de mudança climática. A resposta simulada do desenvolvimento do arroz à elevação da temperatura não foi a mesma, quando o aumento na temperatura mínima e máxima foi simétrico ou assimétrico.
Termos para indexação: Oryza sativa, aquecimento global, fenologia, simulação, planta daninha.
Introduction
There is a major consensus among scientists, except for some minor disagreements, that climate is changing and air temperature is raising due to increasing concentrations of CO2 and other atmosphere greenhouse gases (Weiss et al., 2003; Kerr, 2005; IPCC, 2007). There are reports that the 90’s was the warmest decade in the last millennium (Kerr, 2005), and projections indicate that it is very likely that mean
global temperature will increase from 1.1 to 6.4oC by the end of this century, in several locations, including Brazil (IPCC, 2007). Agroecosystems are likely to be affected by the projected climate change (IPCC, 2007), and their responses will cause considerable impacts on public policy at national and international levels.
2007). Brazil is the largest rice producer outside Asia, with a production of about 11 million Mg per year (Corrêa, 2007). The State of Rio Grande do Sul is the largest Brazilian rice producer, with an average yield of 6.7 Mg ha-1, in about one million hectares
of flood‑irrigated fields (Instituto Rio Grandense do
Arroz, 2007). Red rice (Oryza sativa L.) is one of the top weeds and it has caused considerable yield
reduction in paddy rice fields worldwide (Noldin et al.,
1999; Marchezan et al., 2004).
Plant development is a key process in defining crop
yield. To maximize crop yield, developmental phases should be completed when the environmental factors (mainly temperature, water, and solar radiation) are nearby their optimum levels. Therefore, when assessing
crop response to climate change, an important scientific
question is: how will crop development change if climate changes? This question extends to weeds, as crop-weed competition is largely dependent upon developmental stage of the crop (Agostinetto et al., 2001).
Crop models are some of the tools used in studies of crop development response to climate change (Streck, 2005; Streck et al., 2006). Among several environmental factors, temperature is a major abiotic factor that drives rice development (Gao et al., 1992; Infeld et al., 1998). Regarding the approach used to describe the temperature effects on crop development, there are two groups of models: linear models (Infeld et al., 1998; Steinmetz et al., 2006), and nonlinear ones (Gao et al., 1992; Streck et al., 2003, 2007). Linear models usually work well at “normal” temperature, but fail when crops develop at under and above “normal” temperature (Streck et al., 2007). Therefore, when assessing crop development response to climate change scenarios, nonlinear models should be preferred (Streck et al., 2006).
Some researches have been devoted to study the effect of climate change on rice development (Lal et al., 1998; Tao et al., 2008). In Brazil, only the study by Steinmetz et al. (2006) reports on the effect of climate change on rice development. In the latter, the response related to duration of emergence to panicle differentiation phase to temperature was simulated using the linear approach (thermal time concept). Furthermore, in the Steinmetz et al. (2006) study, thermal time was calculated using daily mean temperature, considering a base temperature of 11oC and a 30oC upper threshold; and climate change scenarios were created by adding +1,
+2, +3 and +5.8oC to the mean daily temperature. It is important to extend the study by Steinmetz et al. (2006) to later developmental stages in rice and consider daily minimum and maximum temperatures in the climate scenarios, because plant development responds to both minimum and maximum daily temperatures, and because asymmetric changes in minimum and maximum daily air temperatures have been reported worldwide, with higher increase in minimum than in maximum daily air temperature (Peng et al., 2004; IPCC, 2007).
The objective of this study was to assess the development response of cultivated rice and red rice to different increases in minimum and maximum daily air temperatures, in Santa Maria, Rio Grande do Sul State, Brazil.
Materials and Methods
The study was performed in Santa Maria, RS (29o43'S, 53o43'W, and altitude: 95 m). This location is representative of a major rice region in Rio Grande do Sul State, Brazil. Climate change scenarios were created with the LARS-WG Weather Generator (Semenov et al., 1998), using as database the meteorological data records (daily minimum and maximum air temperature) from 1969 to 2003, collected at a standard Meteorological Station of Instituto Nacional de Meteorologia (8o Distrito de Meteorologia). LARS-WG (Semenov et al., 1998) is a stochastic model widely used for downscaling of future climate large scale projections, in scenario studies related to climate change impact on agroecosystems (Weiss et al., 2003; Richter & Semenov, 2005; Streck & Alberto, 2006a, 2006b). This stochastic model generates data series using semi-empirical probability distribution functions that keep the statistics of the original data series (Semenov et al., 1998).
series, and the observed series from 1969 to 2003 for Santa Maria, was performed previously (Streck &
Alberto, 2006a, 2006b) and there was no significant
difference between statistics, indicating that air temperature series generated with LARS-WG can be used in this study.
Nine rice genotypes (IRGA 421, IRGA 416, IRGA 417, IRGA 420, BRS 7 TAIM, BR-IRGA 409, EPAGRI 109, EEA 406 and hybrid) and two red rice biotypes (awned black hull – ABHRR – and awned yellow hull – AYHRR) were used. The rice genotypes are of subspecies indica semi-dwarf, except for genotype EEA 406, which is an old genotype, used in the 60’s, representative of the japonica subspecies (tall, broad-leaf plant), used as a red rice simulator plant in crop-weed competition studies (Agostinetto et al., 2004). These genotypes were selected because
they are widely grown in flood‑irrigated paddies in
Southern Brazil; both indica and japonica represent subspecies of Oryza sativa and have a broad range of development rate, varying from very early (IRGA 421) to late (EPAGRI 109). The two red rice biotypes are representative of red rice types commonly found in
paddy rice fields in this location.
The development simulation model for cultivated rice and red rice, used in this study, was the Wang and Engel (WE) model (Wang & Engel, 1998). WE model
has coefficients with biological meaning and operational definition, and the effects of environmental factors on
crop development are represented by nonlinear response functions, combined in a multiplicative fashion. This
model was previously calibrated and validated for rice and red rice by Lago (2008). The developmental cycle of irrigated and red rice was divided into three phases (Gao et al., 1992; Infeld et al., 1998): the vegetative one, from emergence (EM) to panicle differentiation (R1), the reproductive one, from R1 to anthesis (R4),
and the grain filling phase from R4 to all grains with
brown hulls (R9).
The first step in the WE model is to calculate the
daily plant developmental rate (r). The developmental stage (DS) is calculated by accumulating daily developmental rates (DS = Σr). DS is zero at EM, 0.4 at R1, 1 at R4, and 2 at R9. The general form of the WE model is:
r = rmax,v f(T) – for the vegetative phase (EM–R1), r = rmax,r f(T) – for the reproductive phase (R1–R4) and
r = rmax,gf f(T) – for the grain filling phase (R4–R9), in which: rmax,v, rmax,r and rmax,gf are daily maximum developmental rate (per day), during vegetative,
reproductive, and grain filling phases, respectively;
and f(T) is a temperature response function varying from zero to 1. The temperature response function [f(T)] is a beta function (Wang & Engel, 1998; Streck
et al., 2003), and was defined as:
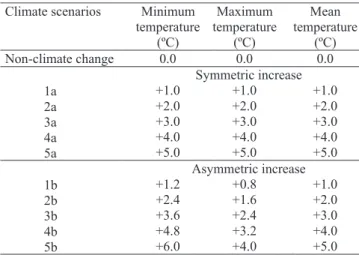
f(T) = 0, for T<Tmin f(T) = [2(T - Tmin)α(Topt - Tmin)α - (T - Tmin)2α]/(Topt - Tmin)2α, for Tmin≤T≤Tmax f(T) = 0, for T>Tmax α = ln(2)/ln[(Tmax - Tmin)/(Topt - Tmin)], in which: Tmin, Topt and Tmax are cardinal temperatures for each developmental phase; and T is the air temperature. For each climate scenario (Table 1), the f(T) was calculated using daily minimum (TN) and maximum (TX) air temperatures, and then the daily values of f(T) were averaged resulting in a daily mean f(T).
The cardinal temperatures (Tmin, Topt and Tmax) for the subspecies indica rice genotypes were: 11, 30 and 40oC, in the EM–R1 phase; 15, 25 and 35oC, in the R1–R4 phase; 15, 23 and 35oC, in the R4–R9 phase for Tmin, Topt e Tmax, respectively (Lago, 2008). For the subspecies japonica rice genotype and the two red rice biotypes, the cardinal temperatures (Tmin, Topt and Tmax) were: 6, 30 and 35oC, in the phase EM–R1; 13, 25 and 30oC, in the phase R1–R4; 10, 23 and 30oC, in the phase R4–R9 for Tmin, Topt and Tmax, respectively
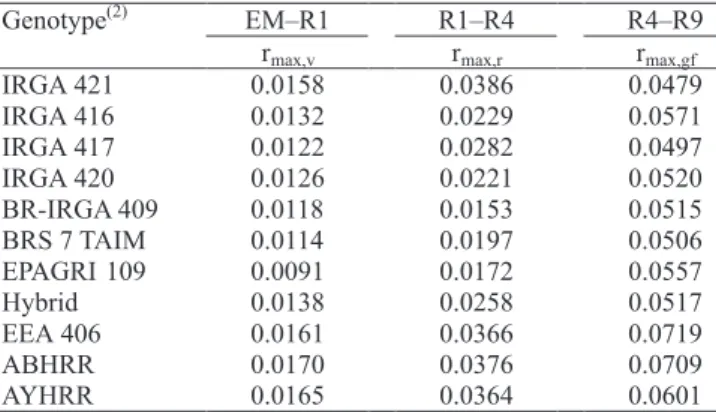
(Lago, 2008). Coefficients rmax,v, rmax,r, rmax,gf for each developmental phase (EM–R1, R1–R4 and R4–R9) and for each genotype, are presented in Table 2. Climate scenarios Minimum
temperature (ºC)
Maximum temperature
(ºC)
Mean temperature
(ºC)
Non-climate change 0.0 0.0 0.0
Symmetric increase
1a +1.0 +1.0 +1.0
2a +2.0 +2.0 +2.0
3a +3.0 +3.0 +3.0
4a +4.0 +4.0 +4.0
5a +5.0 +5.0 +5.0
Asymmetric increase
1b +1.2 +0.8 +1.0
2b +2.4 +1.6 +2.0
3b +3.6 +2.4 +3.0
4b +4.8 +3.2 +4.0
5b +6.0 +4.0 +5.0
Simulations for each of the 100 years, in each scenario (Table 1), started on November 15, which is within the currently recommended sowing period (from October 1st to December 10) for Santa Maria, RS (Sosbai, 2007). The duration, in days, of the EM–R1, R1–R4, and R4–R9 developmental phases was calculated for each of the 100 years of the climate scenarios (Streck et al., 2006).
Data analysis consisted of calculating the deviations (difference between climate-change scenarios and non-climate change scenario) of the developmental phase duration, for the 100 years and averaging the deviations for each climate scenario, as suggested by Weiss et al. (2003). A positive deviation means increases of developmental phase in the scenarios of climate change, whereas a negative deviation means developmental phase decreases.
Results and Discussion
A trend of increasing negative deviations was observed in the duration of the vegetative (EM–R1) phase (i.e. a shorter phase), for increasing mean air temperature scenarios, for both symmetric and asymmetric increase in minimum and maximum temperature (Tables 3, 4 and 5). The shortest EM–R1 phase was simulated for the asymmetric increase – based scenarios, and deviations increased with the length of this phase. The later the maturation group of the cultivar, the longer the length of the EM–R1 phase. Negative deviations varied from eight days
for IRGA 421 (very early) genotype to 12 days for EPAGRI 109 (late) genotype, in the 5b scenario. The trend of shortening in this developmental phase, as temperature increased, was similar, but the shortening magnitude was smaller for japonica genotype (EEA 406) and the red rice biotypes for the asymmetric increase-based scenarios, with a negative deviation of six days for these three genotypes in scenario 5b. For EEA 406 and red rice biotypes, in the symmetric increase-based scenarios, there was a slight shortening until a +3oC increase (one day), and a slight lengthening of one day and two days for the +4 and +5oC scenarios, respectively (Table 5).
Steinmetz et al. (2006) also reported shortening of the EM–R1 phase, in elevated temperature scenarios from eight to 34 days, depending upon the location (eight locations) and maturation group (early or medium) for the +5.8oC scenario. During the EM–R1 phase, roots grow, tillering takes place and leaf area expands. Therefore, a possible consequence of a shorter EM–R1 phase is a decrease in the number of tillers and a reduced leaf area per plant, which may result in decrease of rice yield, if temperature rises. Field management operations like the date of side-dressing nitrogen application, recommended at the onset of tillering and at R1 (Sosbai, 2007), would also have to be changed. From a crop-weed competition stand point, a greater shortening of the EM–R1 phase of the modern (subspecies indica) genotypes, compared to the red rice biotypes, may result in reduced competitiveness of the cultivated rice with this weed (Agostinetto et al., 2001), because, in such scenario, red rice may have greater leaf area per plant.
There was an increase in the duration of the R1–R4 phase (positive deviations) simulated for indica
genotypes, as temperature increased when the increase in minimum and maximum was symmetric (Tables 3, 4 and 5). The greatest delay for completing this phase was simulated in scenario 5a, where positive deviations varied from four days for IRGA 421 (very early) to 10 days for BR-IRGA 409 (mid late). For the asymmetric increase-based scenarios, the deviations in the R1–R4 phase of indica genotypes were slightly negative (shorter phase) in +1 and +2oC, and slightly positive (longer phase) for greater temperature increases (+3, +4, +5oC). For EEA 406 and red rice genotypes, deviations in the duration of the R1–R4 phase were negative in all climate change scenarios, with the greatest reduction of four days in the scenario 3b (Table 5).
Genotype(2) EM–R1 R1–R4 R4–R9
rmax,v rmax,r rmax,gf
IRGA 421 0.0158 0.0386 0.0479
IRGA 416 0.0132 0.0229 0.0571
IRGA 417 0.0122 0.0282 0.0497
IRGA 420 0.0126 0.0221 0.0520
BR-IRGA 409 0.0118 0.0153 0.0515
BRS 7 TAIM 0.0114 0.0197 0.0506
EPAGRI 109 0.0091 0.0172 0.0557
Hybrid 0.0138 0.0258 0.0517
EEA 406 0.0161 0.0366 0.0719
ABHRR 0.0170 0.0376 0.0709
AYHRR 0.0165 0.0364 0.0601
Table 2. Coefficients of Wang & Engel model (rmax,v, rmax,r, rmax,gf) for the developmental phases emergence to panicle differentiation (EM–R1), panicle differentiation to anthesis (R1–R4) and anthesis to all grains with brown hulls (R4–R9), in nine irrigated rice genotypes and red rice biotypes(1).
(1)Source: Lago (2008). (2)ABHRR: awned black hull red rice; AYHRR:
A longer R1–R4 phase may increase the number of days in which plants are exposed to high temperatures, which may cause spikelet sterility. An exposure to 35oC, during anthesis, can cause 20–30% sterility (Horie, 1993; Matsui et al., 1997). In the scenarios used in the present study, maximum temperature during the 100 years was equal to or greater that 35oC in 4, 7, 11, 15, and 21% of the days in scenarios 1a, 2a, 3a, 4a, and 5a, respectively, and 4, 6, 8, 11, and 15% in scenarios 1b,
2b, 3b, 4b, and 5b, respectively, compared to only 2% in the non-climate change scenario (current climate). The shortening of the R1–R4 phase of the red rice biotypes, simulated for all climate change scenarios in this study, means that plants of this weed would be exposed to high temperatures during fewer days, which may decrease spikelet sterility, compared to the cultivated rice. One consequence of the difference in the duration of the R1–R4 phase between red rice and
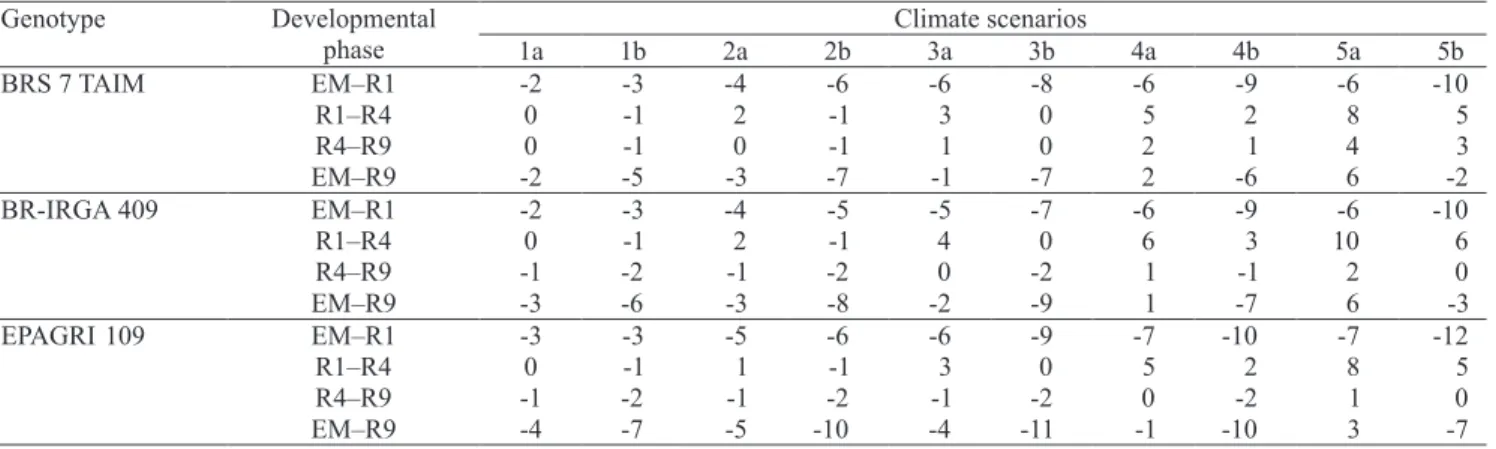
Table 3. Deviations (in days) of the duration of emergence to panicle differentiation (EM–R1), panicle differentiation to anthesis (R1–R4), anthesis to all grains with brown hulls (R4–R9), and emergence to all grains with brown hulls (EM–R9) developmental phases of the very early and early irrigated rice genotypes IRGA 421, IRGA 416, IRGA 417, and IRGA 420 simulated for climate change scenarios of +1, +2, +3, +4, and +5oC, related to the scenario with no change in temperature. Scenarios are numbered according to Table 1.
Genotype Developmental Climate scenarios
phase 1a 1b 2a 2b 3a 3b 4a 4b 5a 5b
IRGA 421 EM–R1 -2 -2 -3 -4 -5 -6 -5 -7 -5 -8
R1–R4 0 -1 1 -1 1 -1 2 0 3 1
R4–R9 1 0 2 1 4 2 6 5 8 7
EM -1 -3 -1 -4 0 -4 3 -3 6 0
IRGA 416 EM–R1 -2 -3 -4 -5 -5 -7 -6 -8 -6 -9
R1–R4 0 -1 1 -1 3 0 5 2 7 4
R4–R9 0 0 1 0 2 2 4 3 6 5
EM–R9 -2 -4 -1 -5 0 -5 3 -4 7 0
IRGA 417 EM–R1 -2 -3 -4 -5 -5 -7 -6 -9 -6 -10
R1–R4 0 0 1 0 2 0 4 1 6 3
R4–R9 0 0 1 0 3 2 5 4 7 6
EM–R9 -2 -4 -2 -5 0 -5 3 -4 6 0
IRGA 420 EM–R1 -2 -3 -4 -5 -5 -7 -6 -8 -6 -9
R1–R4 0 -1 1 -1 3 0 5 2 7 4
R4–R9 0 -1 1 0 2 1 4 3 5 5
EM–R9 -2 -4 -2 -6 0 6- 3 -4 7 0
EM–R9
Genotype Developmental Climate scenarios
phase 1a 1b 2a 2b 3a 3b 4a 4b 5a 5b
BRS 7 TAIM EM–R1 -2 -3 -4 -6 -6 -8 -6 -9 -6 -10
R1–R4 0 -1 2 -1 3 0 5 2 8 5
R4–R9 0 -1 0 -1 1 0 2 1 4 3
EM–R9 -2 -5 -3 -7 -1 -7 2 -6 6 -2
BR-IRGA 409 EM–R1 -2 -3 -4 -5 -5 -7 -6 -9 -6 -10
R1–R4 0 -1 2 -1 4 0 6 3 10 6
R4–R9 -1 -2 -1 -2 0 -2 1 -1 2 0
EM–R9 -3 -6 -3 -8 -2 -9 1 -7 6 -3
EPAGRI 109 EM–R1 -3 -3 -5 -6 -6 -9 -7 -10 -7 -12
R1–R4 0 -1 1 -1 3 0 5 2 8 5
R4–R9 -1 -2 -1 -2 -1 -2 0 -2 1 0
EM–R9 -4 -7 -5 -10 -4 -11 -1 -10 3 -7
the modern rice genotypes would be an increase in red rice seed bank in the soil, in a warmer climate.
The simulated duration of the R4–R9 phase increased (positive deviations) in the climate change scenarios for the indica genotypes (Tables 3, 4 and 5), except for BR-IRGA 409 and EPAGRI 109 (Table 4), with slightly greater deviations in the symmetric increase-based scenarios. BR-IRGA 409 and EPAGRI 109 had negative deviations for small increased temperatures (up to +3oC) and small positive deviations in the +4 and +5oC scenarios. Positive deviations for the R4–R9 phase were also simulated for the japonica genotype (EEA 406) and red rice biotypes (Table 5), with the greatest positive deviations of all genotypes and slightly greater values in the asymmetric increase-based temperature scenarios, reaching 10 days in
scenario 5b. A longer R4–R9 (grain filling) phase
increases the opportunity for grain growth, but at the same time, higher nighttime temperature (especially in asymmetric scenarios) increases canopy respiration, which may affect negatively grain yield, possibly offsetting the positive effect of elevated CO2 on crop growth and yield (Lal et al., 1998; Streck, 2005; Streck & Alberto, 2006a).
Deviations in the total developmental cycle (EM–R9) were different for symmetric and asymmetric temperature increase scenarios (Tables 3, 4 and 5). Overall, in the symmetric temperature increase
scenarios, there was a slight decrease (negative
deviations lower than five days) for scenarios 1a, 2a and
3a; and there was an increase (positive deviation) in the duration of the EM–R9 phase, for scenarios 4a and 5a, that reached three days in EPAGRI 109 genotype and six to seven days in the other genotypes, including red rice biotypes. In contrast, in the asymmetric temperature increase scenarios, a general trend of decreasing the duration of EM–R9 phase, as temperature increased, was simulated until +3oC (scenario 3b), for all genotypes. For higher temperature increases (+4 and +5oC), the negative deviations decreased, reaching positive deviations for some genotypes (IRGA 421, the hybrid, EEA 406), and the red rice biotypes in scenario 5b. The greatest negative deviations of this phase, in
scenario 3b, varied from five days for IRGA 421 (very
early) to 12 days for EPAGRI 109 (late), in indica
genotypes and were about six days for EEA 406 and red rice biotypes.
Many studies with different crops, including rice, reported a decrease in the duration of crop developmental phases, under climate change scenarios (Lal et al., 1998; Weiss et al., 2003; Steinmetz et al., 2006; Tao et al., 2008). A few studies, however, reported an increase in the duration of developmental phases, when temperature was increased by 2 up to 6oC (Streck et al., 2006). These studies used different approaches to describe the effect of temperature
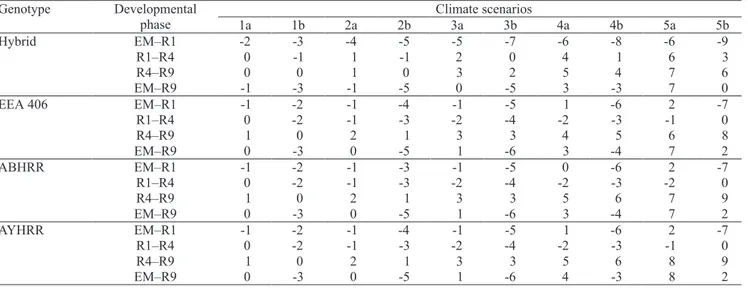
Genotype Developmental Climate scenarios
phase 1a 1b 2a 2b 3a 3b 4a 4b 5a 5b
Hybrid EM–R1 -2 -3 -4 -5 -5 -7 -6 -8 -6 -9
R1–R4 0 -1 1 -1 2 0 4 1 6 3
R4–R9 0 0 1 0 3 2 5 4 7 6
EM–R9 -1 -3 -1 -5 0 -5 3 -3 7 0
EEA 406 EM–R1 -1 -2 -1 -4 -1 -5 1 -6 2 -7
R1–R4 0 -2 -1 -3 -2 -4 -2 -3 -1 0
R4–R9 1 0 2 1 3 3 4 5 6 8
EM–R9 0 -3 0 -5 1 -6 3 -4 7 2
ABHRR EM–R1 -1 -2 -1 -3 -1 -5 0 -6 2 -7
R1–R4 0 -2 -1 -3 -2 -4 -2 -3 -2 0
R4–R9 1 0 2 1 3 3 5 6 7 9
EM–R9 0 -3 0 -5 1 -6 3 -4 7 2
AYHRR EM–R1 -1 -2 -1 -4 -1 -5 1 -6 2 -7
R1–R4 0 -2 -1 -3 -2 -4 -2 -3 -1 0
R4–R9 1 0 2 1 3 3 5 6 8 9
EM–R9 0 -3 0 -5 1 -6 4 -3 8 2
on crop development (linear models or nonlinear models). A longer duration of developmental phases, simulated in high temperature scenarios (Tables 3, 4 and 5), was due to the delay in the developmental rate at supra optimum temperatures in the nonlinear model (equations 4 to 7), which was not considered in other studies (Weiss et al., 2003; Steinmetz et al., 2006).
Among uncertainties about future climates is whether minimum and maximum temperatures will rise at the same rate. The simulations of the present study indicated that rice developmental responded to increase of mean temperatures; and the results were not the same, when the increase in minimum and maximum temperature was symmetric or asymmetric. These results show that the uncertainties about the vulnerability of agroecosystems to climate change (IPCC, 2007) could increase.
There are several limitations in simulation studies of scenarios of climate change impact on crop development. One of such limitations is that most of the studies consider crops are free of insects, diseases and weeds (Lal et al., 1998; Streck et al., 2006), but some studies have demonstrated that plant pests increase in climate change scenarios (Ghini et al., 2008). These results showed that current modern rice genotypes could be less competitive with red rice in simulated future climates. Furthermore, the results are important for rice breeders who may consider looking at additional traits, to compose the portfolio of morphological and agronomic characteristics used for selection of the next generation of rice genotypes.
Conclusions
1. There is a decrease in the duration of the EM–R1 phase when mean air temperature increases for both symmetric and asymmetric increases in minimum and maximum temperatures, with subspecies indica
genotypes being more sensitive than japonica genotype and the red rice biotypes.
2. The duration of the R1–R4 phase increases in
indica rice genotypes when mean air temperature increases for symmetric increase in minimum and maximum temperatures; and the duration of this phase decreases for japonica genotype and red rice biotypes when mean air temperature increases for both symmetric and asymmetric increases in minimum and maximum temperatures.
3. The duration of the R4–R9 phase, for the cultivated rice genotypes (except for BR-IRGA 409 and EPAGRI 109) and red rice biotypes, increases when mean air temperature increases for both symmetric and asymmetric increases in minimum and maximum temperatures.
4. The response of total rice developmental cycle (EM–R9) to increase mean temperature is dependent upon the symmetric and asymmetric increases in minimum and maximum temperatures.
Acknowledgements
To Coordenação de Aperfeiçoamento de Pessoal de Nível Superior and to Conselho Nacional de
Desenvolvimento Científico e Tecnológico, for
scholarships.
References
AGOSTINETTO, D.; FLECK, N.G.; RIZZARDI, M.A.; BIANCHI, M.A.; SILVA, P.R.F. da. Comparação de modelos matemáticos na estimativa das perdas de produtividade de grãos em arroz irrigado. Pesquisa Agropecuária Brasileira, v.39, p.847-856, 2004.
AGOSTINETTO, D.; FLECK, N.G.; RIZZARDI, M.A.; MEROTTO JUNIOR, A.; VIDAL, R.A. Arroz-vermelho: ecofisiologia e estratégias de controle. Ciência Rural, v.31, p.341-349, 2001.
CORRÊA, S. Anuário brasileiro do arroz 2007. Santa Cruz: Gazeta, 2007. 128p.
FAO. International year of rice: 2004. Available at: <http://www. fao.org/rice2004/en/speeches.htm>. Accessed on: 5 Feb. 2007.
GAO, L.; JIN, Z.; HUANG, Y.; ZHANG, L. Rice clock model – a computer model to simulate rice development. Agricultural and Forest Meteorology, v.60, p.1-16, 1992.
GHINI, R.; HAMADA, E.; PEDRO JÚNIOR, M.J.; MARENGO, J.A.; GONÇALVES, R.R. do V. Risk analysis of climate change on coffee nematodes and leaf miner in Brazil. Pesquisa Agropecuária Brasileira, v.43, p.187-194, 2008.
HORIE, T. Predicting the effects of climate variation and elevated CO2 on rice yield in Japan. Journal of Agricultural Meteorology,
v.48, p.567-574, 1993.
INFELD, J.A.; SILVA, J.B. da; ASSIS, F.N. de. Temperatura-base e graus-dia durante o período vegetativo de três grupos de cultivares de arroz irrigado. Revista Brasileira de Agrometeorologia, v.6, p.187-191, 1998.
INSTITUTO RIO GRANDENSE DO ARROZ. Dados de safra. Available at: <http://www.irga.rs.gov.br/index.php?action=dados_ safra>. Accessed on: 20 Oct. 2007.
of the intergovernmental panel on climate change. Cambridge: Cambridge University Press, 2007.
KERR, R.A. Millennium’s hottest decade retains its title, for now. Science, v.307, p.828-829, 2005.
LAGO, I. Desenvolvimento do arroz e do arroz-vermelho: modelagem e resposta à mudança climática. 2008. 94p. Dissertação (Mestrado) - Universidade Federal de Santa Maria, Santa Maria. LAL, M.; SINGH, K.K.; RATHORE, L.S.; SRINIVASAN, G.; SASEENDRAN, S.A. Vulnerability of rice and wheat yields in NW India to future changes in climate. Agricultural and Forest Meteorology, v.89, p.101-114, 1998.
MARCHEZAN, E.; ÁVILA, L.A.; ANDRES, A.; MAGALHÃES JUNIOR, A.M.; MACHADO, S.L.O.; PETRINI, J.A. Controle do arroz-vermelho. In: GOMES, A.S.; MAGALHÃES JUNIOR, A.M. Arroz irrigado no Sul do Brasil. Brasília: Embrapa Informação Tecnológica, 2004. p.547-573.
MATSUI, T.; NAMUCO, O.S.; ZISKA, L.H.; HORIE, T. Effects of high temperature and CO2 concentration on spikelet sterility in
indica rice. Field Crops Research, v.51, p.213-219, 1997.
NOLDIN, J.A.; CHANDLER, J.M.; McCAULEY, G.N. Red rice
(Oryza sativa) biology. I. Characterization of red rice ecotypes.
Weed Technology, v.13, p.12-18, 1999.
PENG, S.; HUANG, J.; SHEEHY, J.E.; LAZA, R.C.; VISPERAS, R.M.; ZHONG, X.; CENTENO, G.S.; KHUSH, G.S.; CASSMAN, K.G. Rice yields decline with higher night temperature from global warming. Proceedings of the National Academy of Sciences of the USA, v.101, p.9971-9975, 2004.
RICHTER, G.M.; SEMENOV, M.A. Modeling impacts of climate change on wheat yields in England and Wales: assessing drought risks. Agricultural Systems, v.84, p.77-97, 2005.
SEMENOV, M.A.; BROOKS, R.J.; BARROW, E.M.; RICHARDSON, C.W. Comparison of the WGEN and LARS-WG stochastic weather generators for diverse climates. Climate Research, v.10, p.95-107, 1998.
SOSBAI. Arroz irrigado: recomendações técnicas para o Sul do Brasil. Santa Maria: Sosbai, 2007. 161p.
STEINMETZ, S.; PINHEIRO, M.J.; FERREIRA J.S.A.; DEIBLER, A.N. Impacto do aquecimento global sobre a duração da fase
vegetativa do arroz irrigado, estimada pelo método de graus-dia. In: CONGRESSO BRASILEIRO DA CADEIA PRODUTIVA DE ARROZ, 2.; REUNIÃO NACIONAL DA PESQUISA DE ARROZ, 8., 2006, Brasília. Anais. Santo Antônio de Goiás: Embrapa Arroz e Feijão, 2006. 1 CD-ROM.
STRECK, N.A. Climate change and agroecosystems: the effect of elevated CO2 and temperature on crop growth, development, and
yield. Ciência Rural, v.35, p.730-740, 2005.
STRECK, N.A.; ALBERTO, C.M. Estudo numérico do impacto da mudança climática sobre o rendimento de trigo, soja e milho. Pesquisa Agropecuária Brasileira, v.41, p.1351-1359, 2006a.
STRECK, N.A.; ALBERTO, C.M. Simulação do impacto da mudança climática sobre a água disponível do solo em agroecossistemas de trigo, soja e milho em Santa Maria, RS. Ciência Rural, v.36, p.424-433, 2006b.
STRECK, N.A.; LAGO, I.; ALBERTO, C.M.; BISOGNIN, D.A. Simulação do desenvolvimento da batata cultivar Asterix em cinco cenários de mudanças climáticas em Santa Maria, RS. Bragantia, v.65, p.693-702, 2006.
STRECK, N.A.; PAULA, F.L.M. de; BISOGNIN, D.A.; HELDWEIN, A.B.; DELLAI, J. Simulating the development of field grown potato (Solanum tuberosum L.). Agricultural and Forest Meteorology, v.142, p.1-11, 2007.
STRECK, N.A.; WEISS, A.; XUE, Q.; BAENZIGER, P.S. Improving predictions of developmental stages in winter wheat: a modified Wang and Engel model. Agricultural and Forest Meteorology, v.115, p.139-150, 2003.
TAO, F.; HAYASHI, Y.; ZHANG, Z.; SAKAMOTO, T.; YOKOZAWA, M. Global warming, rice production, and water use in China: developing a probabilistic assessment. Agricultural and Forest Meteorology, v.148, p.94-110, 2008.
WANG, E.; ENGEL, T. Simulation of phenological development of wheat crops. Agricultural Systems, v.58, p.1-24, 1998.
WEISS, A.; HAYS, C.J.; WON, J. Assessing winter wheat responses to climate change scenarios: a simulation study in the U.S. Great Plains. Climatic Change, v.58, p.119-147, 2003.