HESSD
10, 5687–5737, 2013High-resolution Med-CORDEX regional climate model simulations
Y. Tramblay et al.
Title Page
Abstract Introduction
Conclusions References
Tables Figures
◭ ◮
◭ ◮
Back Close
Full Screen / Esc
Printer-friendly Version Interactive Discussion
Discussion
P
a
per
|
Dis
cussion
P
a
per
|
Discussion
P
a
per
|
Discussio
n
P
a
per
|
Hydrol. Earth Syst. Sci. Discuss., 10, 5687–5737, 2013 www.hydrol-earth-syst-sci-discuss.net/10/5687/2013/ doi:10.5194/hessd-10-5687-2013
© Author(s) 2013. CC Attribution 3.0 License.
Geoscientiic Geoscientiic
Geoscientiic Geoscientiic
Hydrology and Earth System
Sciences
Open Access
Discussions
This discussion paper is/has been under review for the journal Hydrology and Earth System Sciences (HESS). Please refer to the corresponding final paper in HESS if available.
High-resolution Med-CORDEX regional
climate model simulations for
hydrological impact studies: a first
evaluation in Morocco
Y. Tramblay1, D. Ruelland2, S. Somot3, R. Bouaicha4, and E. Servat1
1
IRD, Hydrosciences Montpellier, UMR5569, Universit ´e Montpellier 2, Maison des Sciences de l’Eau, place Eug `ene Bataillon, 34095 Montpellier Cedex 5, France
2
CNRS, Hydrosciences Montpellier, UMR5569, Universit ´e Montpellier 2, Maison des Sciences de l’Eau, place Eug `ene Bataillon, 34095 Montpellier Cedex 5, France
3
CNRM-GAME, M ´et ´eo-France, Centre National de Recherches M ´et ´eorologiques, 42 avenue G. Coriolis, 31057 Toulouse cedex 1, France
4
Direction de la Recherche et de la Planification de l’Eau, Rue Hassan Benchekroune, Agdal, Rabat, Morocco
Received: 25 April 2013 – Accepted: 26 April 2013 – Published: 3 May 2013
Correspondence to: Y. Tramblay ([email protected])
HESSD
10, 5687–5737, 2013High-resolution Med-CORDEX regional climate model simulations
Y. Tramblay et al.
Title Page
Abstract Introduction
Conclusions References
Tables Figures
◭ ◮
◭ ◮
Back Close
Full Screen / Esc
Printer-friendly Version Interactive Discussion
Discussion
P
a
per
|
Dis
cussion
P
a
per
|
Discussion
P
a
per
|
Discussio
n
P
a
per
|
Abstract
In the framework of the international CORDEX program, new regional climate model (RCM) simulations at high spatial resolutions are becoming available for the Mediter-ranean region (Med-CORDEX initiative). This study provides the first evaluation for
hydrological impact studies of these high-resolution simulations. Different approaches
5
are compared to analyze the climate change impacts on the hydrology of a catchment located in North Morocco, using a high-resolution RCM (ALADIN-Climate) from the
Med-CORDEX initiative at two different spatial resolutions (50 km and 12 km) and for
two different Radiative Concentration Pathway scenarios (RCP4.5 and RCP8.5). The
main issues addressed in the present study are: (i) what is the impact of increased 10
RCM resolution on present-climate hydrological simulations and on future projections? (ii) Are the bias-correction of the RCM model and the parameters of the hydrological
model stationary and transferable to different climatic conditions? (iii) What is the
cli-mate and hydrological change signal based on the new Radiative Concentration Path-ways scenarios (RCP4.5 and RCP8.5)? Results indicate that high resolution simula-15
tions at 12 km better reproduce the seasonal patterns, the seasonal distributions and the extreme events of precipitation. The parameters of the hydrological model,
cali-brated to reproduce runoff at the monthly time step over the 1984–2010 period, do
not show a strong variability between dry and wet calibration periods in a diff
eren-tial split-sample test. However the bias correction of precipitation by quantile-matching 20
does not give satisfactory results in validation using the same differential split-sample
testing method. Therefore a quantile-perturbation method that does not rely on any stationarity assumption and produces ensembles of perturbed series of precipitation was introduced. The climate change signal under scenarios 4.5 and 8.5 indicates a
de-crease of respectively−30 % to−57 % in surface runofffor the mid-term (2041–2062),
25
when for the same period the projections for precipitation are ranging between−15 %
and−19 % and for temperature between+1.28◦C and+1.87◦C.
HESSD
10, 5687–5737, 2013High-resolution Med-CORDEX regional climate model simulations
Y. Tramblay et al.
Title Page
Abstract Introduction
Conclusions References
Tables Figures
◭ ◮
◭ ◮
Back Close
Full Screen / Esc
Printer-friendly Version Interactive Discussion
Discussion
P
a
per
|
Dis
cussion
P
a
per
|
Discussion
P
a
per
|
Discussio
n
P
a
per
|
1 Introduction
The most common approach for hydrological impact studies of climate change is to run hydrological models with climate scenarios, usually provided by the outputs of precipita-tion and temperature from climate models downscaled or corrected to the catchment of interest (Etchevers et al., 2002; Fowler et al., 2007; Chiew et al., 2009; Senatore et al., 5
2011; Ruelland et al., 2012). It is acknowledged that in this approach the main source of uncertainty is the global climate model and the downscaling method rather than the
hydrological model (Quintana Segu´ıet al., 2010; Teng et al., 2012). Many studies have
applied this framework for impact studies across the world. But fewer studies have been conducted so far in countries in the Mediterranean basin, yet considered a hotspot 10
of climate change (Giorgi 2006; Giorgi and Lionello, 2008; Milano et al., 2013). The Mediterranean region is a transition zone between arid and temperate climates with
several mountainous areas, therefore a complex climate system affected by the
inter-actions between mid-latitude and tropical processes. The new generation of regional climate model simulations dedicated to the Mediterranean area such as those provided 15
by the Med-CORDEX initiative (www.medcordex.eu, Ruti et al., 2013; Herrmann et al., 2011) in the line with the CMIP5 and CORDEX programs aims at increasing the relia-bility of past and future regional climate information and understanding the processes that are responsible for the Mediterranean climate variability and trends.
Climate change impacts on the hydrology of Mediterranean catchments have been 20
evaluated mainly for catchments located in France (Quintana Segu´ıet al., 2010), Spain
(Majone et al., 2012), Italia (Senatore et al., 2011) and at the Mediterranean scale (Sanchez-Gomez et al., 2009; Dubois et al., 2012; Milano et al., 2012, 2013) but no studies to our knowledge have considered in detail the case of North African catch-ments. In Northern Morocco, the rainiest part of the country, are located most of the 25
storage-dams for water management (Bouaicha and Benabdelfadel, 2010). This region
may be the particularly affected by climate change, since several studies have shown
HESSD
10, 5687–5737, 2013High-resolution Med-CORDEX regional climate model simulations
Y. Tramblay et al.
Title Page
Abstract Introduction
Conclusions References
Tables Figures
◭ ◮
◭ ◮
Back Close
Full Screen / Esc
Printer-friendly Version Interactive Discussion
Discussion
P
a
per
|
Dis
cussion
P
a
per
|
Discussion
P
a
per
|
Discussio
n
P
a
per
|
likely to rise between 2 and 3◦C by 2050 (Ragab and Prudhomme, 2002; Born et al.,
2008; Driouech et al., 2010; Patricola and Cook, 2010; Schilling et al., 2012; Milano
et al., 2012, 2013). These changes will likely have a strong effect in Morocco where the
agricultural sector is of high importance for the country’s economy and very dependent on surface water resources (Bouaicha and Benabdelfadel, 2010; Schilling et al., 2012). 5
Therefore, there is a need to quantify the possible climate change impacts on the water
resources of this region. In this study different methods are evaluated to analyze the
cli-mate change effects on the hydrology of the Makhazine catchment, the 6th largest dam
of Morocco, using a high-resolution regional climate model (RCM) ALADIN-Climate
from the MED-CORDEX initiative at two different spatial resolution (50 km and 12 km)
10
and for two different Radiative Concentration Pathway scenario (RCP4.5 and RCP8.5).
Most often, a top-down downscaling approach is adopted for hydrological impact studies, i.e. downscaling and/or bias correcting global climate models (GCM) or RCM outputs to the catchment of interest (Fowler et al., 2007; Maraun et al., 2010). To re-solve the mismatch of scale between GCMs and the scale relevant for regional impacts 15
studies, recent RCMs such as those the Med-CORDEX project provide a resolution now reaching up to a few tenths of kilometers. With their increased spatial resolution, they aim at better representing orography and the associated climatic processes es-pecially in complex terrain, such as the Mediterranean basin (Driouech et al., 2009). Nonetheless, they usually require a bias correction of their outputs (D ´equ ´e, 2007; Piani 20
et al., 2010). Several studies have shown that empirical quantile-mapping methods usually outperform other approaches (Themeßl et al., 2011) but Lafon et al. (2013) noticed that the results were very sensitive to the choice of calibration time period. In-deed the strong assumption behind bias correction is that the model bias is stationary in time (Maraun et al., 2010). This hypothesis is impossible to verify for future hori-25
zons of climate not yet observed. However this assumption can be tested in present climate, using a split sample in a similar fashion than for hydrological models (Maraun et al., 2010; Themessl et al., 2011; Vrac et al., 2012). This type of assessment was per-formed by Maraun (2012) for RCM simulations of the ENSEMBLES project. He showed
HESSD
10, 5687–5737, 2013High-resolution Med-CORDEX regional climate model simulations
Y. Tramblay et al.
Title Page
Abstract Introduction
Conclusions References
Tables Figures
◭ ◮
◭ ◮
Back Close
Full Screen / Esc
Printer-friendly Version Interactive Discussion
Discussion
P
a
per
|
Dis
cussion
P
a
per
|
Discussion
P
a
per
|
Discussio
n
P
a
per
|
that the precipitation bias is stationary for most parts of Europe, but strongly affected
by variability in arid and semi-arid regions such as Maghreb. For regions where precip-itation occurs as rather rare and localized events, internal variability may dominate the estimated seasonal biases on a local scale even when averaging over 30 yr (Maraun, 2012). In addition it has been proved for Morocco at least that bias in RCMs could be 5
weather regime dependent (Driouech et al., 2010).
Beside the direct application of climate model outputs after downscaling or
bias-correction into hydrological models, different bottom-up methods also exist
(Prudhomme et al., 2010). The so-called “delta change” or perturbation method be-longs to this type of approach (Anandhi et al., 2011; Ruelland et al., 2012): it consists in 10
perturbing the observed precipitation and temperature series to reproduce the changes observed between the control and future climatic simulations from climate models. The hypothesis behind is that climate models are not necessarily good at reproducing the present climate in a realistic manner (contrary to weather forecast models, they do not assimilate observations for example) but are mainly designed to simulate the trends of 15
the earth climate system related to external forcing (green-house gases, aerosols, solar variation, volcanic eruption). Most often, the method relies on monthly change factors (Ruelland et al., 2012) but this approach does not account for the possible changes in the high-order moments of the distribution other than the mean. Therefore, it may not
be efficient for semi-arid regions such as North Africa, with a small number of rainy
20
days and monthly totals often driven by extreme precipitation events (Tramblay et al., 2012a). Variants of the method have been proposed, that take into account the whole
distribution changes by modifying each quantile by a different change factor (Chiew
et al., 2009; Liu et al., 2011; Willems and Vrac, 2011).
Several studies have warned about the use of calibrated model parameters for diff
er-25
ent climatic conditions (Wilby, 2005; Vaze et al., 2010; Coron et al., 2012). These
stud-ies in different regions of the globe highlight the need for robust calibration approaches
HESSD
10, 5687–5737, 2013High-resolution Med-CORDEX regional climate model simulations
Y. Tramblay et al.
Title Page
Abstract Introduction
Conclusions References
Tables Figures
◭ ◮
◭ ◮
Back Close
Full Screen / Esc
Printer-friendly Version Interactive Discussion
Discussion
P
a
per
|
Dis
cussion
P
a
per
|
Discussion
P
a
per
|
Discussio
n
P
a
per
|
parameters could vary from one site to another, consequently there is a need for long
time series to test the model on sub-period representatives of different climatic
char-acteristics, to better quantify the uncertainties (Vaze et al., 2010; Coron et al., 2012; Li et al., 2012). It must be noted that this consideration is not new: Klemes (1986)
advocated the use of a differential split-sample test (DSST) procedure to validate
hy-5
drological models. The DSST approach relies on choosing calibration and validation
time slices with different climatic features (wet or dry years for instance). That way,
hy-drological models are validated with the most stringent settings, thereby providing an
efficient way to assess the time stability of their parameters.
In the present study the outputs of a RCM from the Med-CORDEX project at different
10
spatial resolutions are considered, together with different methods to evaluate the
fu-ture changes on surface water resources. Due to limited data availability, a conceptual
lumped hydrological model is chosen. Different downscaling approaches are tested,
including the direct application of RCM outputs, a quantile-mapping bias correction method and a quantile-perturbation approach. The purpose of this study is not to give 15
a complete diagnostic of the future projections but to review different approaches
rele-vant to conduct hydrological impact studies with high resolution RCMs in the semi-arid catchments of North Africa. Several methodological issues that have never been inves-tigated for this region are addressed in the present study, in particular:
1. What is the climate and hydrological change signal simulated by regional climate 20
model (RCM) based on the new Radiative Concentration Pathways scenarios (RCP4.5 and RCP8.5) used in CMIP5?
2. What is the impact of the resolution of the RCM on hydrological simulations and future projections?
3. Are the bias-correction for RCM simulations and the hydrological model parame-25
ters stationary and transferable to different climatic conditions (wet to dryer or dry
to wetter conditions)?
HESSD
10, 5687–5737, 2013High-resolution Med-CORDEX regional climate model simulations
Y. Tramblay et al.
Title Page
Abstract Introduction
Conclusions References
Tables Figures
◭ ◮
◭ ◮
Back Close
Full Screen / Esc
Printer-friendly Version Interactive Discussion
Discussion
P
a
per
|
Dis
cussion
P
a
per
|
Discussion
P
a
per
|
Discussio
n
P
a
per
|
To achieve these goals, we decided to investigate very recent dynamical downscaling simulations performed in the frame of the CORDEX program (http://wcrp-cordex.ipsl. jussieu.fr/, Giorgi et al., 2009; Colin et al., 2011) for the Mediterranean region (Med-CORDEX, www.medcordex.eu, Ruti et al., 2013) with one RCM (the French ALADIN-Climate developed at M ´et ´eo-France, CNRM). Evaluation (reanalysis as lateral bound-5
ary conditions) and scenarios (CMIP5 model as lateral boundary conditions)
simu-lations are available as well as twin simusimu-lations with two different spatial resolution
(the standard 50-km and the frontier 12-km) and two different emission gas scenarios
(optimistic RCP4.5 and pessimistic RCP8.5). To our knowledge, the 12-km scenario simulations used here are the higher-resolution simulations ever used to study climate 10
change over the Mediterranean area. It is why we chose this ensemble of runs partic-ularly designed to address the issues listed above.
2 Study area and datasets
2.1 Hydro-climatic data over the reference period
The catchment of the Makhazine dam in North Morocco drains an area of 1808 km2
15
(Fig. 1) under a Mediterranean climate, with a wet season with moderate temperatures from October to April and a hot dry season from May to September (Tramblay et al., 2012b). The basin consists of plains in the western part, while in the east the terrain becomes more rugged and mountainous, the altitude increases progressively eastward until reaching 1745 m.a.s.l. Because of the influence of the Atlantic Ocean, the basin 20
receives 1100 mm of precipitation per year on average but with a strong inter-annual variability. The Makhazine dam was built in 1979 for irrigation, water supply, energy production, and protection against floods. It is a mixed earth and rocks dam, creating
a reservoir with a storage capacity of 724×106m3 (the 6th largest of Morocco). The
mean annual inflow is 678×106m3and the mean evaporation is 1176 mm yr−1.
HESSD
10, 5687–5737, 2013High-resolution Med-CORDEX regional climate model simulations
Y. Tramblay et al.
Title Page
Abstract Introduction
Conclusions References
Tables Figures
◭ ◮
◭ ◮
Back Close
Full Screen / Esc
Printer-friendly Version Interactive Discussion
Discussion
P
a
per
|
Dis
cussion
P
a
per
|
Discussion
P
a
per
|
Discussio
n
P
a
per
|
The dam inflows are measured daily since 1984 at the Makhazine station. The daily pan evaporation measured between 1984 and 2011 and monthly air temperatures
be-tween 1975 and 1996 are also available. 11 stations with daily precipitation (P) located
within and outside the catchment were considered (Fig. 1). The study period is 1984– 2010 (27 hydrological years from September to August). The rainfall depth at the catch-5
ment scale was obtained through spatial interpolation with the Thiessen approach. No trends were detected in precipitation or temperature data aggregated over annual or monthly time steps between 1984 and 2010. The individual precipitation records at each station have been carefully checked to remove unrealistic values and identify the missing days/periods.
10
2.2 Regional climate simulations from Med-CORDEX 2.2.1 The ALADIN-climate regional climate model
We used the limited-area atmosphere RCM ALADIN-Climate (Radu et al., 2008; Colin et al., 2010; Herrmann et al., 2011) in its version 5 firstly described in Colin et al. (2010). ALADIN-Climate shares the same dynamical core as the cycle 32 of its weather fore-15
cast ALADIN (Aire Limit ´ee Adaptation dynamique D ´eveloppement InterNational) coun-terpart and the same physical package as the version 5 of the GCM ARPEGE-Climate (see D ´equ ´e 2010 or http://www.cnrm.meteo.fr/gmgec/arpege-climat/ARPCLI-V5.1/ index.html). ALADIN-Climate is a bi-spectral RCM with a semi-implicit semi-lagrangian
advection scheme. Horizontal diffusion, semi-implicit corrections and horizontal
deriva-20
tives are then computed with a finite family of analytical functions. In the case of AL-ADIN, a 2-D bi-Fourier decomposition is used. Contrary to the globe, the domain is not periodic, so a bi-periodicization is achieved in grid-point space by adding a so-called extension zone used only for Fourier transforms. The non-linear contributions to the equations are performed in grid point space. In this configuration ALADIN-25
Climate includes an 11-point wide bi-periodization zone in addition to the more clas-sical 8 point relaxation zone using the Davies technique. More details on the phyclas-sical
HESSD
10, 5687–5737, 2013High-resolution Med-CORDEX regional climate model simulations
Y. Tramblay et al.
Title Page
Abstract Introduction
Conclusions References
Tables Figures
◭ ◮
◭ ◮
Back Close
Full Screen / Esc
Printer-friendly Version Interactive Discussion
Discussion
P
a
per
|
Dis
cussion
P
a
per
|
Discussion
P
a
per
|
Discussio
n
P
a
per
|
parameterizations of ALADIN-Climate version 5 can be found in the above cited ref-erences and web site. It is worth nothing that ALADIN-Climate takes into account five
greenhouse gases (CO2, CH4, N2O and CFC) in addition to water vapour and ozone.
The scheme also takes into account five classes of aerosols. More details about the behaviour of ALADIN-Climate can be found in the literature for academic studies using 5
the Big-Brother framework (Radu et al., 2008; Colin et al., 2010), for the Mediterranean Sea water budget (Sanchez-Gomez et al., 2011) and for extreme precipitation (D ´equ ´e and Somot, 2008; Colin et al., 2010; Vrac et al., 2012). The version 5 is used in the framework of the regional CORDEX exercise (Mediterranean, Africa, North America areas) and is close to the ARPEGE-Climate version used in the CMIP5 exercise. Pre-10
vious version of ALADIN-Climate (version 4) was used for the European ENSEMBLES project in which it was inter-compared with the state-of-the art of the European RCMs at 50 and 25 km (Christensen et al., 2010).
Different configurations of this model can be used. They are obtained by varying the
spatial resolution, the size and position of the area of interest, and the dataset used for 15
the large scale forcing. More complex and unusual options are also available such as the use of spectral nudging and interactive air-sea coupling techniques (see Herrmann et al., 2011). Those options are not used in the current study. For the model definition, we used a Lambert conformal projection for pan-Mediterranean area at horizontal
res-olutions of 50 km (resp. 12 km) centred at 14◦E, 43◦N with 128 (resp. 432) grid points
20
in longitude and 90 (resp. 288) grid points in latitude including the bi-periodization (11)
and the relaxation zone (2×8). The model version has 31 vertical levels. The time
step used is 1800 s. (resp. 600 s.). This geographical set-up allows the Med-CORDEX
official area (www.medcordex.eu) to be fully included in the model central zone.
2.2.2 The regional climate simulations
25
Two twin families of four simulations available with the ALADIN-Climate RCM were used in the current study (Table 1). The eight simulations share the same area and the
HESSD
10, 5687–5737, 2013High-resolution Med-CORDEX regional climate model simulations
Y. Tramblay et al.
Title Page
Abstract Introduction
Conclusions References
Tables Figures
◭ ◮
◭ ◮
Back Close
Full Screen / Esc
Printer-friendly Version Interactive Discussion
Discussion
P
a
per
|
Dis
cussion
P
a
per
|
Discussion
P
a
per
|
Discussio
n
P
a
per
|
only by the spatial resolution: the standard runs are performed at a 50-km resolution which is the CORDEX standard for the CORE runs, while the very high-resolution RCM runs are performed at a frontier resolution of 12-km over the whole Mediterranean area. To our knowledge, the 12-km scenario simulations used here are the higher-resolution simulations ever used to study climate change over the Mediterranean area. D ´equ ´e 5
and Somot (2008) and Herrmann et al. (2011) proved that 12-km resolution is required to represent accurately extreme precipitation over land in the Mediterranean climate of France and extreme and coastal wind over the Mediterranean Sea. We recall that for the Mediterranean basin, Gibelin and D ´equ ´e (2003) used the first scenario simulation at 50-km whereas Gao et al. (2006) used a 20-km resolution for the first time.
10
Each family is composed by four simulations:
1. The so-called evaluation run in which the RCM is driven at its lateral boundary conditions by the ERA-Interim reanalysis (80-km at its full resolution). The riod simulated is 1979–2012 (minimal CORDEX period is 1989–2008). The pe-riod 1984–2010 is used in the current study for model evaluation. The climate 15
as simulated by ALADIN-Climate in the “evaluation mode” is the best possible as we consider that ERA-Interim is the best knowledge of the 4-D dynamic of the atmosphere available over the last 30 yr.
2. The historical run in which the RCM is driven by the historical run of a CMIP5 GCM. We used CNRM-CM5 (Voldoire et al., 2011) developed at CNRM to ensure 20
a consistency of the physics between the driving GCM and the driven RCM. Note that consistency is however not perfect as the land-surface scheme and the
radia-tive scheme are slightly different. However solar forcing, aerosol field and GHG
concentrations are similar in the RCM and GCM. After a 2 yr spin-up of ALADIN to ensure the stability of the land-surface scheme, the historical run covers the pe-25
riod 1950–2005. Among the 10 members’ runs with CNRM-CM5, we chose main member of CNRM-CM5 called HISTr8.
HESSD
10, 5687–5737, 2013High-resolution Med-CORDEX regional climate model simulations
Y. Tramblay et al.
Title Page
Abstract Introduction
Conclusions References
Tables Figures
◭ ◮
◭ ◮
Back Close
Full Screen / Esc
Printer-friendly Version Interactive Discussion
Discussion
P
a
per
|
Dis
cussion
P
a
per
|
Discussion
P
a
per
|
Discussio
n
P
a
per
|
3. The RCP4.5 scenario in which ALADIN-Climate is driven by the RCP4.5 scenario run made with CNRM-CM5 and corresponding to HISTr8 historical run. The period covered is 2006–2100.
4. The RCP8.5 scenario in which ALADIN-Climate is driven by the RCP8.5 scenario run made with CNRM-CM5 and corresponding to HISTr8 historical run. The period 5
covered is 2006–2100.
RCP4.5 and RCP8.5 corresponds to the naming of two of the new climate change scenarios (Radiative Concentration Pathway scenario) used in CMIP5 and in the AR5. They replace the former SRES scenarios used for example in CMIP3 and IPCC-AR4. The RCP4.5 (resp. RCP8.5) means that the GHG and aerosols concentrations 10
evolves in a way that leads to an additional radiative forcing equal to+4.5 W m−2(resp.
+8.5 W m−2) at the end of the 21st century with respect to the pre-industrial climate.
Consequently the RCP4.5 can be considered as an optimist scenario with respect to the GHG concentration whereas RCP8.5 is a more pessimistic option.
The 8 simulations performed with ALADIN-Climate and used in the current study 15
(Table 1) are part of the Med-CORDEX exercise that is the Mediterranean domain (one
of the 12 official domains) of the CORDEX program. To summarize, CORDEX is the
CMIP5 counterpart for the RCM. More information can be found on CORDEX in Giorgi et al. (2009) and Colin et al. (2011) (see also http://wcrp-cordex.ipsl.jussieu.fr/) and on Med-CORDEX in Ruti et al. (2013) or at www.medcordex.eu.
20
Note that all the simulations have been interpolated over the catchment basin us-ing the Thiessen polygons in order to be consistent with the interpolation performed for the observed precipitation. Indeed it is worth noting that at a 12-km resolution, 9 grid meshes are inside the catchment of interest whereas, at a 50-km resolution, the
catchment is smaller than a grid mesh (2500 km2).
HESSD
10, 5687–5737, 2013High-resolution Med-CORDEX regional climate model simulations
Y. Tramblay et al.
Title Page
Abstract Introduction
Conclusions References
Tables Figures
◭ ◮
◭ ◮
Back Close
Full Screen / Esc
Printer-friendly Version Interactive Discussion
Discussion
P
a
per
|
Dis
cussion
P
a
per
|
Discussion
P
a
per
|
Discussio
n
P
a
per
|
3 Methods
3.1 Hydrological modelling
The hydrological model considered is the GR4J, a conceptual lumped model
devel-oped by Perrin et al. (2003). GR4J simulates runoffvia two functions. First, a
produc-tion funcproduc-tion that accounts for precipitaproduc-tion (net precipitaproduc-tion) and evapotranspiraproduc-tion, 5
determines the precipitation fraction (effective precipitation) participating to flow and
supplying the production reservoir (interception and percolation). Next, a routing
func-tion calculates runoffat the catchment outlet. The four parameters of the model were
calibrated with daily discharge measured at the dam using unconstrained nonlinear optimization with the simplex search method (Lagarias et al., 1998). A warm-up period 10
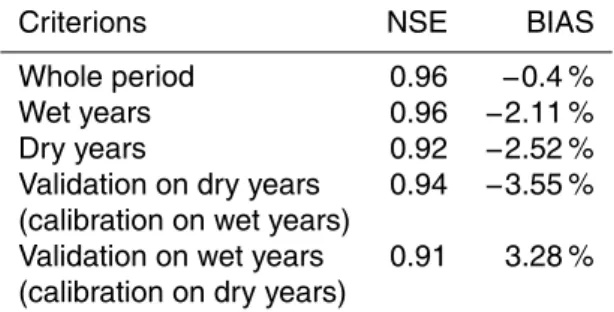
of 365 days was considered for the correct initialization of the production reservoir. The model was run at a daily time step but evaluated at the monthly time step, since the goal of the study is focused on water resources and not day-to-day variability. In this study, two objectives were considered: (i) a good agreement between the simulated and observed hydrographs; and (ii) a good agreement between the simulated and ob-15
served catchment runoffvolume. Therefore, the multi-objective function, for which the
lowest value indicate a good model agreement with observations, combines the Nash–
Sutcliffe efficiency coefficient (NSE) on simulated mean monthly discharge and the bias
(BIAS) on runoffvolume over the full time period considered:
f =(1−NSE) 1+|BIAS|
(1) 20
This function gives weight to both dynamic representation and water balance (Coron et al., 2011; Ruelland et al., 2012). The hydrological model was calibrated and validated
using a differential split-sample test (DSST, Klemes, 1986): The model was calibrated
on the wet years and validated on dry years, and inversely. The DSST is a robust approach to validate the model in the most extreme conditions, it is recommended for 25
climate change impact studies (Vaze et al., 2010; Coron et al., 2012). To identify the dry
HESSD
10, 5687–5737, 2013High-resolution Med-CORDEX regional climate model simulations
Y. Tramblay et al.
Title Page
Abstract Introduction
Conclusions References
Tables Figures
◭ ◮
◭ ◮
Back Close
Full Screen / Esc
Printer-friendly Version Interactive Discussion
Discussion
P
a
per
|
Dis
cussion
P
a
per
|
Discussion
P
a
per
|
Discussio
n
P
a
per
|
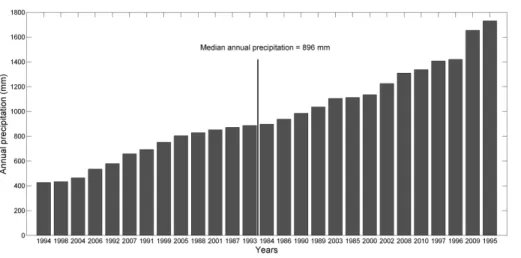
and wet years (Fig. 2), annual total precipitation was first computed for each hydrolog-ical year (from September to August), then the annual values were sorted: as a result,
the wet years (14 yr) are those above the median annual precipitation (896 mm yr−1),
the dry years are those below the median (13 yr). The selected dry years have on
av-erage−45 % less precipitation than the wet years. Here a standard split-sample test
5
(SST) would not be very meaningful to test the model in a climate change context since in the present study area the calibration and validation periods would have very similar characteristics, in the absence of long time trends in precipitation, discharge or evapotranspiration.
Different computation methods for Potential Evapotranspiration (PE) exist, but
sev-10
eral studies have shown the minor influences of the different formula on resulting river
flow (Oudin et al., 2005; Sperna Weiland et al., 2012). The formula proposed by Oudin
et al. (2005) for evapotranspiration is efficient for climate change impact studies since
it relies only on air temperature (Kai et al., 2008; Ruelland et al., 2012). It was com-puted using the mean monthly air temperature data available at the Makhazine station. 15
In a preliminary sensitivity analysis, the hydrological model has been forced by: (a) the evaporation measured daily at the dam, (b) monthly PE computed with monthly air temperatures, (c) mean monthly PE computed with mean monthly air temperatures and (d) mean monthly PE computed with mean monthly air temperatures interpolated
over the catchment considering a temperature gradient of−6.5◦C per kilometer, which
20
is consistent with specific works by Boudhar et al. (2010) on Moroccan High-Atlas. The
results (not shown here) indicated very similar simulations using the 3 different PE
in-puts. This shows that the intra-annual variations in evapotranspiration are much more important than the inter-annual variations. Since no trends were detected in monthly air temperatures or in the measured evaporation at the dam, the method (c) was selected 25
HESSD
10, 5687–5737, 2013High-resolution Med-CORDEX regional climate model simulations
Y. Tramblay et al.
Title Page
Abstract Introduction
Conclusions References
Tables Figures
◭ ◮
◭ ◮
Back Close
Full Screen / Esc
Printer-friendly Version Interactive Discussion
Discussion
P
a
per
|
Dis
cussion
P
a
per
|
Discussion
P
a
per
|
Discussio
n
P
a
per
|
3.2 Downscaling methods
Different options were tested to incorporate the climate change signal from the climate
model into the hydrological model. Since only monthly temperatures were available at
one station and because the hydrological model was very little sensitive to the different
PE inputs tested, the changes in temperature were incorporated into the hydrologi-5
cal simulations by a monthly change factor between the present period and the future period. This is a common practice when hydrological simulations are much more sen-sitive to the precipitation inputs than the temperature (Liu et al., 2011). Therefore the following two methods apply only for the precipitation outputs of the climate model.
3.2.1 Bias correction of precipitation
10
The bias correction of precipitation was performed using a quantile-mapping method. The “Cumulative Distribution Function-transform” (CDF-t) method developed by Michelangeli et al. (2009) was considered (freely available on www.r-project.org/). CDF-t is a variant of the quantile-quantile correction method between climate model and observed CDFs (D ´equ ´e, 2007; Piani et al., 2010; Themeßl et al., 2011; Lafon 15
et al., 2013). It takes into account the changes between the historic and the future time period, while quantile-quantile projects the simulated values onto the historic CDF to compute and match quantiles (Michelangeli et al., 2009; Lavaysse et al., 2012; Vrac
et al., 2012). In CDF-t, if the model CDF is offrange of the observed CDF, a constant
correction method is applied as proposed by D ´equ ´e (2007). If applied on GCM data, 20
it performs a change of spatial scale and could be seen as a downscaling approach (Vrac et al., 2012). If applied on RCM data with the same resolution as the observa-tion network, as it is the case in the present study, it can be seen as a bias correcobserva-tion
method. In the CDF-t approach, a transformationT is applied during an historical
pe-riod to the CDF of the climate model (FMH) to define a new CDF as close as possible
25
to the observed CDF (FOH):
T(FMH(x))=FOH(x) (2)
HESSD
10, 5687–5737, 2013High-resolution Med-CORDEX regional climate model simulations
Y. Tramblay et al.
Title Page
Abstract Introduction
Conclusions References
Tables Figures
◭ ◮
◭ ◮
Back Close
Full Screen / Esc
Printer-friendly Version Interactive Discussion
Discussion
P
a
per
|
Dis
cussion
P
a
per
|
Discussion
P
a
per
|
Discussio
n
P
a
per
|
By replacingx byFMH−1(u), withuany probability between [0 1]:
T(u)=FOH FMH−1(u)
(3)
which provides a definition ofT. Under the assumption thatT is stationary between the
historical and future periods (Vrac et al., 2012), the transformation can be applied to
FMF, the climate model CDF over a future period, to generate FOF, the future CDF of
5
the variable of interest (here catchment precipitation):
T(FMF(x))=FOF(x) (4)
This approach was applied on strictly positive daily precipitation each month, to take into account the seasonality since the CDF require independent and identically dis-tributed samples. Since the climate models usually simulate too many drizzle days, 10
a new precipitation threshold larger than zero was selected for the RCM simulations (Lavaysse et al., 2012). This new threshold was defined in order to keep the same number of wet days in the RCM and in observations during the historical period. For example with the MED11-EVAL simulation the new thresholds for dry days are varying ascending from 0.01 mm during the wettest month (December) to 0.96 mm during the 15
driest month (August). Experiments with a fixed threshold set at 0.1 mm day−1 were
also performed, providing fully equivalent results as those presented in Sect. 4.3. In several hydrological impact studies, the stationary hypothesis is not validated prop-erly, under the argument that it is not verifiable for future time horizons (Quintana et al., 2010; Ehret et al., 2012). However this hypothesis is verifiable, at least during historical 20
periods, as performed by Themeßl et al. (2011), Lafon et al. (2013), Vrac et al. (2012) and Maraun et al. (2012). In the current study, the stationary hypothesis of the bias correction performed with CDF-t was verified using the DSST and SST methods. Vali-dation was performed using quantiles-quantiles plots and the Kolmorogov-smirnov test between the observed and bias-corrected precipitation CDFs.
HESSD
10, 5687–5737, 2013High-resolution Med-CORDEX regional climate model simulations
Y. Tramblay et al.
Title Page
Abstract Introduction
Conclusions References
Tables Figures
◭ ◮
◭ ◮
Back Close
Full Screen / Esc
Printer-friendly Version Interactive Discussion
Discussion
P
a
per
|
Dis
cussion
P
a
per
|
Discussion
P
a
per
|
Discussio
n
P
a
per
|
3.2.2 Quantile perturbation
A quantile perturbation method does not consider the differences between observed
and simulated datasets but only the relative changes between past and future time pe-riods as simulated by climate models. Several authors have implemented this method for hydrological impact studies (Chiew et al., 2009; Liu et al., 2011; Willems and Vrac, 5
2011): we introduced a variant that is producing random ensembles of perturbed se-ries, to prevent that a single random generation may contain outliers. The computation was done for each month separately, between an observed period (CTRL), a simula-tion during the observasimula-tion period (SIM) and a projected future period (PROJ). The approach followed these steps:
10
1. Identification of the frequency of dry days (whenP <0.1 mm) in CTRL, SIM and
PROJ;
2. If the amount of dry days increases between SIM and PROJ, the corresponding amount of additional wet days in CTRL were randomly changed into dry days (100 randomly perturbed series (PERT) were generated);
15
3. If the amount of dry days decreases between SIM and PROJ, the corresponding amount of dry days was randomly changed into wet days in CTRL. The “new” wet days are randomly selected from wet days in CTRL (100 randomly perturbed series (PERT) were generated);
4. For each PERT series perturbed in steps (2) or (3), the empirical quantiles were 20
adjusted by the change factor (CF) between the PROJ and SIM quantiles for the
corresponding probabilitiesp:
CFp=QPROJp
QSIMp
(5)
Spline interpolation was applied when different sets of empirical probabilities p were
obtained for SIM and PROJ. 25
HESSD
10, 5687–5737, 2013High-resolution Med-CORDEX regional climate model simulations
Y. Tramblay et al.
Title Page
Abstract Introduction
Conclusions References
Tables Figures
◭ ◮
◭ ◮
Back Close
Full Screen / Esc
Printer-friendly Version Interactive Discussion
Discussion
P
a
per
|
Dis
cussion
P
a
per
|
Discussion
P
a
per
|
Discussio
n
P
a
per
|
Then, the ensemble of perturbed series obtained were used as inputs of the
hydro-logical model. The mean of the resulting runoffsimulations was considered for
eval-uating the climate change impacts on monthly discharges, thus avoiding the use of a single randomly perturbed series.
4 Results
5
4.1 Evaluation of RCM simulations at different resolutions
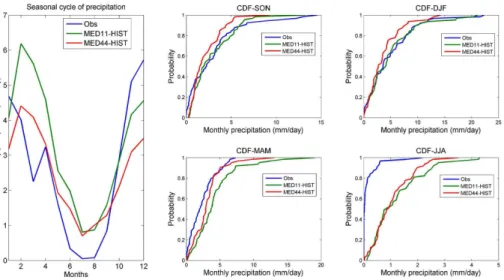
Although past model performance to reproduce the observed climate does not im-ply better skills for future projections, more confidence can be put into models able to reproduce the key characteristics of climate. The precipitation outputs of the RCM simulations are compared with the observed precipitation and temperature records. 10
Figure 3 shows the results for the ALADIN model driven by ERA-Interim during the evaluation period: the monthly cycle of precipitation and the CDF of monthly precipita-tion between 1984 and 2010. The same plots are shown in Fig. 4 but with the ALADIN model driven by CNRM-CM5 during the historical period (1984–2005). For MED11-EVAL, the high-resolution model at 12 km, there is a much better reproduction of the 15
seasonal cycle and the seasonal CDFs than with MED44-EVAL (50 km), except for the
summer: however, the results for this season are difficult to evaluate due to the very
limited amount of rain days. Indeed, during the period 1984–2010, there are 91 % of dry days for JJA (61 % for SON, 52 % for DJF and 60 % for MAM) in observed precipi-tation. The results are similar with ALADIN forced by CNRM-CM5, in particular for the 20
wet season (SON and DJF), showing the improvement in reproducing the observed patterns with the high-resolution model (MED11-HIST). In particular the most extreme precipitation events (i.e. exceeding the 95th percentile) are much better reproduced in the high resolutions runs (MED11-EVAL and MED11-HIST). However during the MAM and JJA seasons there is a strong positive bias (overestimation of precipitation) in par-25
HESSD
10, 5687–5737, 2013High-resolution Med-CORDEX regional climate model simulations
Y. Tramblay et al.
Title Page
Abstract Introduction
Conclusions References
Tables Figures
◭ ◮
◭ ◮
Back Close
Full Screen / Esc
Printer-friendly Version Interactive Discussion
Discussion
P
a
per
|
Dis
cussion
P
a
per
|
Discussion
P
a
per
|
Discussio
n
P
a
per
|
CNRM-CM5 forcing (lateral or surface) as it is the only difference between
MED11-HIST and MED11-EVAL. To evaluate if the precipitation bias was comparable during wet or dry years, the relative bias on precipitation totals for MED11-EVAL and MED44-EVAL was computed. Results are shown in Fig. 5: except during summer months, the
bias is not strongly different between dry and wet periods, with a difference less than
5
5 % in most cases.
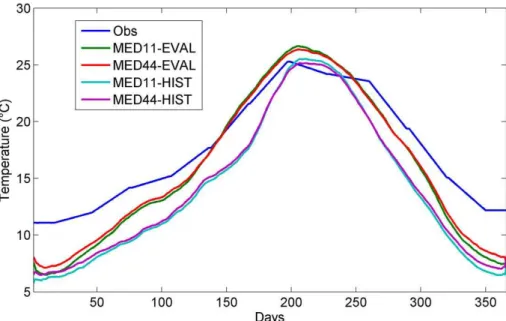
For the temperature, the comparison with observed data is limited since only mean monthly temperatures at the Makhazine station are available. The comparison is per-formed here with the monthly temperatures interpolated at the catchment scale
consid-ering a lapse rate of−6.5◦C per kilometer. It can be seen in Fig. 6 that both simulations
10
driven by ERA-Interim or CNRM-CM5 are able to reproduce the seasonal cycle. The RCM runs driven by ERA-Interim are warmer than the models driven by the GCM and
in better agreement with the observations. It can also be noted that the difference
be-tween the 50 and 12 km resolution models is weak with respect to the seasonal cycle of the bias.
15
The relative changes are then evaluated between the historical period 1984–2005 and a projection period 2041–2062 with the RCP4.5 and RCP8.5 emission scenarios. The projection period was chosen to start 30 yr after the end of observed data, to show
the projected changes by the medium-term. Different time horizons have been also
tested but similar results were obtained, except that the detected changes are more 20
marked when getting closer to the year 2100. The precipitation and temperature mean monthly cycles are presented in Fig. 7, for the historical period and the RCP4.5 and RCP8.5 scenarios at 12 km and 50 km resolution. The climate change signal is very
similar with the two models at different resolutions, depending on the scenario. For
precipitation, the RCP4.5 scenario projects a decrease of−15 % of total precipitation
25
and the RCP8.5 scenario, −19 %. These changes mainly occur during the wet
sea-son (November to April), with up to−25 % of precipitation in winter with the scenario
8.5. For temperature, an increase of +1.28◦C is projected with the scenario RCP4.5
and+1.87◦C with the scenario RCP8.5. Contrary to precipitation, these changes are
HESSD
10, 5687–5737, 2013High-resolution Med-CORDEX regional climate model simulations
Y. Tramblay et al.
Title Page
Abstract Introduction
Conclusions References
Tables Figures
◭ ◮
◭ ◮
Back Close
Full Screen / Esc
Printer-friendly Version Interactive Discussion
Discussion
P
a
per
|
Dis
cussion
P
a
per
|
Discussion
P
a
per
|
Discussio
n
P
a
per
|
projected mainly during summer months. The changes on temperature are likely to
have little impact on discharge, since there is almost no runoff during the summer,
while the decrease of precipitation amounts during winter months may have a critical impact on water resources.
4.2 Hydrological modelling results
5
The GR4J model is calibrated during the full period 1984–2010 and also on wet or dry
years, according the selection based on Fig. 2. The simulated monthly runoffobtained
with the model calibrated on the full period 1984–2010 is shown in Fig. 8. The calibrated
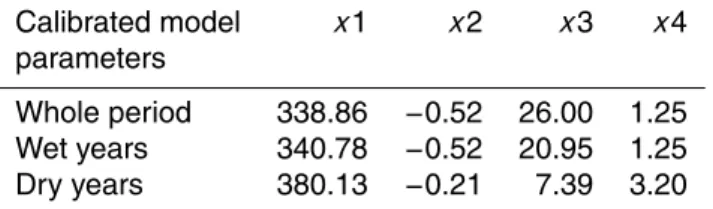
model parameters for the different periods are shown in Table 2 and the performance in
calibration and validation for the different periods is presented in Table 2. Results show
10
a good stability of the model parameters in between the wet and dry years (Table 3).
Satisfactory model efficiency is obtained for both calibration and validation periods,
with NSE coefficient above 0.9 and volume bias less than 5 % (Table 2). The lowest
performances are obtained when the model is calibrated on dry periods, as previously reported by Yapo et al. (1996) and Vaze et al. (2010). The good stability of the model 15
performances under different climatic conditions is certainly due to the long period of
record available (27 yr) and to the absence of hydro-climatic trends during this period. Yapo et al. (1996) previously noted that 8 yr of data was enough to obtain calibration insensitive to the period selected in Southeast USA while Vaze et al. (2010) reported the need for at least 20 yr of data in South Australia to reach the same goal. Indeed, in 20
semi-arid catchments, where precipitation shows a strong interannual variability, there is a need for longer periods of records to capture the whole range of variability that can be observed.
To evaluate the need of bias correction for the RCM outputs, the hydrological model
is run with the uncorrected daily outputs of precipitation from the different RCM
simu-25
HESSD
10, 5687–5737, 2013High-resolution Med-CORDEX regional climate model simulations
Y. Tramblay et al.
Title Page
Abstract Introduction
Conclusions References
Tables Figures
◭ ◮
◭ ◮
Back Close
Full Screen / Esc
Printer-friendly Version Interactive Discussion
Discussion
P
a
per
|
Dis
cussion
P
a
per
|
Discussion
P
a
per
|
Discussio
n
P
a
per
|
cycle of discharge. All the hydrological simulations driven by RCM precipitation repro-duce the dry season from June to October; however in most cases there is a severe
underestimation of runoffduring the SON and DJF seasons, in particular with
MED11-HIST and MED44-MED11-HIST. Since the comparison shown in Fig. 9 is performed with the set of model parameters calibrated with observed precipitation, the possibility to recali-5
brate the hydrological model to compensate for the bias of RCM precipitation was also tested. Relative satisfactory results in calibration were obtained with the precipitation
from the RCM driven by ERA, with NSE coefficients of respectively 0.9 and 0.87 for the
RCM at 12 km and 50 km resolution, with a bias lower than 4 %. However the
perfor-mance in validation using SST or DSST is poor, with the bias on runoffvolume reaching
10
20 %. In addition, the re-calibrated model parameters are very different than those
ob-tained with observed precipitation. It can be argued that even though it is not a physical model (i.e. with its parameters related to measurable physical processes), strong devi-ations from the set of parameters obtained with observed precipitation make the validity of the calibrated parameters questionable. The model parameters compensate for the 15
precipitation bias in the RCM simulations, thus proving unfeasible parameter values resulting in a loss of hydrological processes representation.
4.3 Stationarity of the precipitation bias in RCM simulations
Since the raw RCM outputs of precipitation cannot reproduce the discharge when used
in the hydrological model, there is a need to correct their bias prior to make future runoff
20
scenarios. By construction, with the non-parametric approach for bias-correction con-sidered in the present study, the distribution after correction is identical to the observed distribution during the calibration period. The main assumption of the approach is the
stationarity in time of the transformation used to corrected RCM data, i.e. for different
time periods or in between time periods of contrasted climatic situations. The station-25
arity of the bias is first tested with a SST: the bias correction method is calibrated for each month on the hydrological years 1984–1997 (14 yr) and validated on 1998–2010 (13 yr). The goal is to evaluate if the bias corrected outputs of precipitation from the
HESSD
10, 5687–5737, 2013High-resolution Med-CORDEX regional climate model simulations
Y. Tramblay et al.
Title Page
Abstract Introduction
Conclusions References
Tables Figures
◭ ◮
◭ ◮
Back Close
Full Screen / Esc
Printer-friendly Version Interactive Discussion
Discussion
P
a
per
|
Dis
cussion
P
a
per
|
Discussion
P
a
per
|
Discussio
n
P
a
per
|
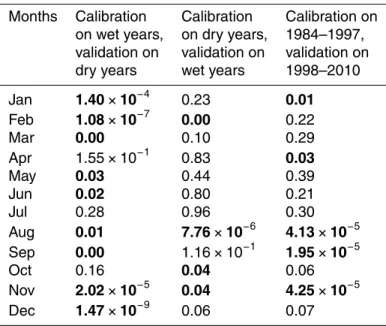
RCM match the observed precipitation during a validation period different than the
cali-bration period. For the sake of brevity, the results are presented for MED11-EVAL, since it is the simulation closest to the observed precipitation, but similar results are obtained with MED44-EVAL. Figure 10 shows the quantiles-quantiles plots in validation:
signifi-cant differences are found even after bias correction in particular for high precipitation
5
quantiles during the wettest months. According to the Kolmorogov–Smirnov test, at the 5 % confidence level, the null hypothesis is rejected for the months of January, March, April, August, September and November (Table 3). Similar conclusions are reached
with different calibration and validation samples (2/3 for calibration, 1/3 for validation),
since the choice of the calibration period could add uncertainties (Lafon et al., 2013), 10
or when considering seasonal bias correction functions.
In addition, a DSST is also considered in a similar way than for the hydrological model, between dry and wet periods. This test can be performed here since, except for summer months, the bias of the model is similar between dry and wet periods (Fig. 5). Table 3 indicate that when the bias correction is calibrated on wet years and validated 15
on dry years, it produces bias-corrected distributions significantly different than those
observed for most months (9 out of 12). On the opposite, better results are obtained when calibrating the bias-correction on dry years. The impacts on discharge are shown on Fig. 11, with the GR4J model driven by observed and bias-corrected MED11-EVAL precipitation during wet and dry years. It can be seen that the discharge is not re-20
produced adequately when the bias-correction is validated on dryer years than those of the calibration sample. Since future projections indicate a decrease of precipitation (Fig. 7), such bias correction method is questionable in this type of semi-arid catch-ments. These results are consistent with the conclusions of Maraun (2012) obtained with pseudo-reality experiments. It must be noted that in semi-arid climate with a strong 25
variability, longer series might be needed to bias-correct RCM outputs in a robust way as previously stated by Vrac et al. (2012), in particular for summer months with a high number of dry days. Results indicate that for the present catchment 27 yr may not be
HESSD
10, 5687–5737, 2013High-resolution Med-CORDEX regional climate model simulations
Y. Tramblay et al.
Title Page
Abstract Introduction
Conclusions References
Tables Figures
◭ ◮
◭ ◮
Back Close
Full Screen / Esc
Printer-friendly Version Interactive Discussion
Discussion
P
a
per
|
Dis
cussion
P
a
per
|
Discussion
P
a
per
|
Discussio
n
P
a
per
|
4.4 Projected hydrological changes with the quantile perturbation method
Since the bias-correction of precipitation cannot be validated under changing climatic conditions, the future projections were carried out only with the quantile-perturbation approach that does not rely on any stationarity hypothesis. One future period 2041– 2062 is considered, with the RCM simulations at 12 km and 50 km under the RCP4.5 5
and RCP8.5 emission scenarios. The model projections indicate dryer and hotter con-ditions for the future (Fig. 7), consequently here two sets of parameters are considered to evaluate the hydrological impacts with the GR4J model: the first set consists in the parameters obtained using the whole observation period for calibration (Table 3), the second set consists in the parameters obtained in calibration with dry years only. This 10
allows evaluating the differences in the climate change signal that could be obtained
with different sets of model parameters. The times-series of observed precipitation
are perturbed months by months using the quantile-perturbation method described in Sect. 3.2.2. The PE is also perturbed by monthly change factors on temperature.
Figure 12 shows the change factors obtained each month, when perturbing the 15
observed precipitation by the change between the MED11-HIST (1984–2005) and MED11-RCP4.5 (2041–2062) simulations, for scenario RCP 4.5, and by the change between the MED11-HIST and MED11-RCP8.5 simulations, for the scenario RCP 8.5 and the same periods as for RCP 4.5. The changes in the magnitude of the precipi-tation quantiles are also accompanied with a change in the number of wet days, that 20
are reduced in both scenarios as low as−25 % (Fig. 13). Very similar results are
ob-tained with the simulations at the 50 km resolution (not shown here). It can be seen that
the changes are very different depending on the months and the different precipitation
quantiles. This implies that projected changes are different for different precipitation
in-tensities; therefore a mean change here would lead to severe under- or over-estimation. 25
By comparison to the widely used delta change method on monthly means, the quan-tile perturbation method allows evaluating the changes in precipitation extremes (Chiew et al., 2009; Liu et al., 2012). It is particularly relevant in the present catchment, since in
HESSD
10, 5687–5737, 2013High-resolution Med-CORDEX regional climate model simulations
Y. Tramblay et al.
Title Page
Abstract Introduction
Conclusions References
Tables Figures
◭ ◮
◭ ◮
Back Close
Full Screen / Esc
Printer-friendly Version Interactive Discussion
Discussion
P
a
per
|
Dis
cussion
P
a
per
|
Discussion
P
a
per
|
Discussio
n
P
a
per
|
most months the 10 % largest daily precipitation events contribute for more than 50 % of total precipitation. Here a decrease in high quantiles of precipitation are projected for the months of February, March, April, September, October, November and December, with both scenarios. Tramblay et al. (2012a) also noticed a decrease of precipitation extremes under the future scenario A1B over North Morocco.
5
These changes are translated into the hydrological model by a 30 % decrease of
runoffwith the scenario RCP4.5 and 50 % with the scenario RCP8.5 with the RCM at
12 km, and respectively 35 % and 57 % with the RCM at 50 km (Fig. 14). These result-ing hydrological changes are the consequences of the modifications in both precipita-tion intensity and the sequence of dry and wet days. Both scenarios indicate a large de-10
crease in surface water resources mostly during the wet season and the signal is more important with the RCM at 50 km (Fig. 14). The climate change signal from the RCM
simulations at different resolutions has a similar impact on the hydrological simulations
even if their performances in reproducing the observed climate differ. The projected
changes exceed by far the uncertainties of the model bias in present climate (less than 15
5 %). The impact of different model parameters on projections is small (Fig. 14) even
if thex1 parameter, the capacity of the production reservoir, is more important for the
set 2 (dry period,x1=380.13) than for the set 1 (whole period,x1=338.86).
5 Conclusions and perspectives
This study provides the first evaluation for hydrological impact studies of the high-20
resolution RCM simulations available in framework of the Med-CORDEX initiative. A new version of the ALADIN-Climate model was considered at two resolutions, 12 km and 50 km, with the lateral boundary conditions provided by ERA-Interim and the CNRM-CM5 GCM. The climate model was evaluated in present climate, to compare its output of precipitation and temperature with the observations, and also in the future, 25
HESSD
10, 5687–5737, 2013High-resolution Med-CORDEX regional climate model simulations
Y. Tramblay et al.
Title Page
Abstract Introduction
Conclusions References
Tables Figures
◭ ◮
◭ ◮
Back Close
Full Screen / Esc
Printer-friendly Version Interactive Discussion
Discussion
P
a
per
|
Dis
cussion
P
a
per
|
Discussion
P
a
per
|
Discussio
n
P
a
per
|
reproduce the seasonal patterns, the seasonal distributions and the extreme events of precipitation. Adequate representation of precipitation by climate models is a challeng-ing task in the Mediterranean region with a strong spatial and temporal variability and where monthly or seasonal totals are often driven by extreme events, in particular in its southernmost shores. Therefore this new generation of high-resolution regional climate 5
model simulations allows a better representation of this variability. For temperature, the comparison was limited here since only monthly observed data were available but all simulations were able to reproduce the annual cycle. However, when the un-corrected precipitation and temperature from the climate model simulations at both resolutions are used as input of the hydrological model, they do not reproduce with enough ade-10
quacies the hydrological response. Even with the high resolution simulations, there is still a significant bias in precipitation that precludes their direct use in a hydrological model. As a consequence, there is a need for an additional step in order to use them in hydrological impact studies.
The parameters of the GR4J hydrological model at the monthly time step did not 15
show a significant variability between dry and wet calibration periods in the catch-ment studied; robust results were obtained at the monthly scale, which is relevant for water resources management. Numerous studies have warned about the calibration of conceptual models for studies of climate change. Nevertheless, the fact remains that these findings are site-dependent and model-dependent. In our case study, using 20
a model evaluated at the monthly time step during a long period (27 yr), the results of calibration and validation show high stability over time, even between two radically
different sets of years (−45 % difference in precipitation between dry and wet years)
that are more different than the projected changes in precipitation (−19 % in
precipi-tation projected for the period 2041–2062 under the scenario RCP8.5). However the 25
possible changes in land use are not considered here, neither in the RCM nor in the
hydrological model. They could have a strong impact on the rainfall-runoffrelationship
and PE in the future, if significant changes in land use or land cover are experienced. In the present catchment, located away from urban centers and mostly agricultural and
HESSD
10, 5687–5737, 2013High-resolution Med-CORDEX regional climate model simulations
Y. Tramblay et al.
Title Page
Abstract Introduction
Conclusions References
Tables Figures
◭ ◮
◭ ◮
Back Close
Full Screen / Esc
Printer-friendly Version Interactive Discussion
Discussion
P
a
per
|
Dis
cussion
P
a
per
|
Discussion
P
a
per
|
Discussio
n
P
a
per
|
inhabited, they are not expected to change greatly, since they did not change over the last 30 yr due to the dam construction precluding urbanization.
Results indicate that even with the high resolution model (12 km), forced by reanal-ysis data, the bias correction of precipitation by quantile-matching does not give sat-isfactory results in validation in the hydrological model. If quantile mapping correction 5
techniques performed well in temperate or continental climates (Themeßl et al., 2011; Lafon et al., 2013), this is not the case in semi-arid regions (Maraun, 2012). There is a need for improved bias correction techniques, adapted to the semi arid climates characterized by a strong variability and the importance of extreme events. In
partic-ular quantile mapping methods suffer from different drawbacks that could be critical
10
in semi-arid regions: there is no physical consistency between the different corrected
variables, as for example temperature and precipitation, when such consistency ex-ists in the GCM and RCM simulations (Quintana et al., 2010). In addition, it does not distinguish the origin of the bias and neglect feedback mechanisms such as changes
in atmospheric circulation patterns, which could affect the stationarity of the standard
15
bias-correction methods (Driouech et al., 2010; Ehret et al., 2012).
Therefore, a quantile perturbation approach was introduced for scenario building, which made it possible to account for the changes in various moments of the distribu-tion. It allowed reproducing the possible changes induced by a modification of extreme events, which have a large contribution to precipitation total amounts in this catchment. 20
Future hydrological changes were projected with this quantile perturbation approach providing ensembles of perturbed series. The climate change signal with scenarios
4.5 and 8.5 shows a decrease from−30 % to −57 % in surface runofffor 2041–2062,
when for the same period the projections for precipitation ranges between−15 % and
−19 % and for temperature are expecting to rise between +1.3◦C and +1.9◦C. Using 25
HESSD
10, 5687–5737, 2013High-resolution Med-CORDEX regional climate model simulations
Y. Tramblay et al.
Title Page
Abstract Introduction
Conclusions References
Tables Figures
◭ ◮
◭ ◮
Back Close
Full Screen / Esc
Printer-friendly Version Interactive Discussion
Discussion
P
a
per
|
Dis
cussion
P
a
per
|
Discussion
P
a
per
|
Discussio
n
P
a
per
|
resources in this region and results obtained in the present study are consistent with previous studies in the same region (Schilling et al., 2012; Milano et al., 2012, 2013). Further work should now test other approaches to evaluate the climate change signal and compare the results with those obtained in the present study. In particular other types of bias-correction methods and hydrological models should be considered but 5
also the use of RCM with an improved description of the present-climate hydrological cycle (improved mean behavior and extreme events).
We are however aware that individual RCM simulations do not allow to take into account two of the main sources of uncertainty in regional climate change, that is to say the choice of the RCM and the choice of the forcing GCM (D ´equ ´e et al., 2012). This will 10
be possible in the future with the extension of the number of Med-CORDEX simulations and database (www.medcordex.eu): coordinated 15 scenario simulations at 50-km and 6 scenario simulations at 12-km are planned within the coming years. Therefore in the near future, more Med-CORDEX simulations will be available to provide multimodel ensembles allowing to tackle, for example, the model choice uncertainty (GCM and 15
RCM) or the model physics choice for a given model. Then hydrological impact studies could be undertaken across the Mediterranean basin considering this ensemble of high-resolution simulations to provide a robust diagnostic of the future projections.
Acknowledgements. The observed data was provided by the department of Water Research and Planning (DRPE) of Morocco and the Hydraulic Basin Agency of Loukkos-T ´etouan. 20
We thank A. Alias (CNRM) for running the Mediterranean ALADIN simulations. This work is a contribution to the HyMeX program (HYdrological cycle in the Mediterranean Experiment) through INSU-MISTRALS support and to the Med-CORDEX initiative (COordinated Regional climate Downscaling EXperiment – Mediterranean region). The third author has received funding from the French National Research Agency (ANR) project REMEMBER (contract 25
ANR-12-SENV-001) and from the European Commission through the FP7 CLIM-RUN project. The ALADIN simulations used in the current work can be downloaded from the Med-CORDEX database (www.medcordex.eu) maintained by ENEA (special thanks to E. Lombardi). Thanks are also due to Cl ´ementine Tramblay for her inspiring comments.