ACPD
13, 23719–23755, 2013Fffect of air pollution controls on trends in shortwave radiation
C.-M. Gan et al.
Title Page
Abstract Introduction
Conclusions References
Tables Figures
◭ ◮
◭ ◮
Back Close
Full Screen / Esc
Printer-friendly Version
Interactive Discussion
Discussion
P
a
per
|
D
iscussion
P
a
per
|
Discussion
P
a
per
|
Discuss
ion
P
a
per
|
Atmos. Chem. Phys. Discuss., 13, 23719–23755, 2013 www.atmos-chem-phys-discuss.net/13/23719/2013/ doi:10.5194/acpd-13-23719-2013
© Author(s) 2013. CC Attribution 3.0 License.
Atmospheric Chemistry and Physics
Open Access
Discussions
Geoscientiic Geoscientiic
Geoscientiic Geoscientiic
This discussion paper is/has been under review for the journal Atmospheric Chemistry and Physics (ACP). Please refer to the corresponding final paper in ACP if available.
Assessment of the e
ff
ect of air pollution
controls on trends in shortwave radiation
over the United States from 1995 through
2010 from multiple observation networks
C.-M. Gan1, J. Pleim1, R. Mathur1, C. Hogrefe1, C. N. Long2, J. Xing1, S. Roselle1, and C. Wei1
1
Atmospheric Modeling and Analysis Division, National Exposure Research Laboratory, US Environmental Protection Agency, Research Triangle Park, North Carolina, USA
2
Climate Physics Group, Pacific Northwest National Laboratory, Richland, Washington, USA
Received: 2 August 2013 – Accepted: 28 August 2013 – Published: 10 September 2013
Correspondence to: C.-M. Gan ([email protected], [email protected])
ACPD
13, 23719–23755, 2013Fffect of air pollution controls on trends in shortwave radiation
C.-M. Gan et al.
Title Page
Abstract Introduction
Conclusions References
Tables Figures
◭ ◮
◭ ◮
Back Close
Full Screen / Esc
Printer-friendly Version
Interactive Discussion
Discussion
P
a
per
|
D
iscussion
P
a
per
|
Discussion
P
a
per
|
Discuss
ion
P
a
per
|
Abstract
Long term datasets of all-sky and clear-sky downwelling shortwave (SW) radiation, cloud cover fraction and aerosol optical depth (AOD) are analyzed together with sur-face concentration from several networks (e.g. SURFRAD, CASTNET, IMPROVE and ARM) in the United States (US). Seven states with varying climatology are selected 5
to better understand the effects of aerosols and clouds on SW radiation. This
analy-sis aims to assess the effects of reductions in anthropogenic aerosol burden resulting
from substantial reductions in emissions of sulfur dioxide (SO2) and nitrogen oxides
(NOx) over the past 16 yr across the US on trends in SW radiation. The SO2and NOx
emission data show decreasing trends from 1995 to 2010 which indirectly validates the 10
effects of the Clean Air Act (CAA) in the US. Meanwhile, the total column AOD and
surface total PM2.5 observations also show decreasing trends in the eastern US but
slightly increasing trends in the western US. Moreover, measured surface
concentra-tions of several other pollutants (i.e. SO2, SO4 and NOx) have the same behavior as
the AOD and total PM2.5. First, all-sky downwelling SW radiation is assessed together
15
with the cloud cover. Results of this analysis show strong increasing trends in all-sky downwelling SW radiation with decreasing trends in cloud cover. However, since
ob-servations of both all-sky direct and diffuse SW radiation are increasing, there may be
other factors contributing to the radiation trends in addition to the decreasing trends in
overall cloud cover. To investigate the role of direct radiative effects of aerosols,
clear-20
sky downwelling radiation is analyzed so that cloud effects are eliminated. However,
similar increasing trends in clear-sky direct and diffuse SW radiation are observed.
While significantly decreasing trends in AOD and surface concentration along with in-creasing SW radiation (both all-sky and clear-sky) in the eastern US during 1995–2010 imply the occurrence of direct aerosol mediated “brightening”, the increasing trends of 25
both all-sky and clear sky diffuse SW radiation contradicts this conclusion since diffuse
radiation would be expected to decrease as aerosols direct effects decrease. After
ACPD
13, 23719–23755, 2013Fffect of air pollution controls on trends in shortwave radiation
C.-M. Gan et al.
Title Page
Abstract Introduction
Conclusions References
Tables Figures
◭ ◮
◭ ◮
Back Close
Full Screen / Esc
Printer-friendly Version
Interactive Discussion
Discussion
P
a
per
|
D
iscussion
P
a
per
|
Discussion
P
a
per
|
Discuss
ion
P
a
per
|
due to more high-level cirrus from increasing air traffic over the US. In contrast to the
eastern US, radiation observations in the western US do not show any indication of
“brightening” which is consistent with the observations (e.g. AOD, PM2.5 and surface
concentration) that show the aerosol loading increasing slightly. This outcome is not unexpected because the CAA controls were mainly aimed at reducing air pollutants 5
emission in the eastern US and air pollutant level in the western US are much lower.
1 Introduction
Solar radiation incident at the surface of the Earth is a key regulator of climate and the primary energy source for life. Several studies in the past (Ohmura and Lang, 1989; Gilgen et al., 1998; Stanhill and Cohen, 2001; Liepert, 2002; Wild et al., 2004; Wild, 10
2009) have shown evidence of “global dimming” which was described as a widespread decrease of downwelling solar radiation from the early 1960s up to the late 1980s. However, starting during the 1990s, this trend reversed with some regions such as Europe and North America now experiencing “brightening” (Wild et al., 2005, 2009; Pinker et al., 2005; Dutton et al., 2006; Long et al., 2009) possibly due to the air pollu-15
tion controls. In particular, Wild et al. (2009) and Long et al. (2009) have demonstrated the “brightening” trend with surface radiation measurements (e.g. Baseline Surface Radiation Network (BSRN), Surface Radiation Budget Network (SURFRAD) and At-mospheric Radiation Measurement (ARM)) in Europe and the United States (US). Wild et al. (2009) argued that the “global brightening” in the first part of the 20th century 20
was tied to the aerosol loading while Long et al. (2009) attributed this phenomena to decreasing cloudiness which may or may not be associated with aerosols. Therefore, this study is extended to evaluate the possible causes of the “brightening” in US with more surface measurements.
It is likely that the changes in the emissions of aerosols and aerosol precursors, as 25
well as trends in cloud cover, are tied to changes in surface solar radiation. In
ACPD
13, 23719–23755, 2013Fffect of air pollution controls on trends in shortwave radiation
C.-M. Gan et al.
Title Page
Abstract Introduction
Conclusions References
Tables Figures
◭ ◮
◭ ◮
Back Close
Full Screen / Esc
Printer-friendly Version
Interactive Discussion
Discussion
P
a
per
|
D
iscussion
P
a
per
|
Discussion
P
a
per
|
Discuss
ion
P
a
per
|
potential to change anthropogenic aerosol loading which can be associated with trends in regional radiation budgets over the past 16 yr. In order to have a better
understand-ing of the aerosol effects and radiation trends, this study employs several observation
networks such as SURFRAD, ARM, CASTNET (Clean Air Status and Trend Network) and IMPROVE (Interagency Monitoring of Protection Visual Environments) across the 5
US from 1995 to 2010.
Section 2 gives an overview of each network together with their measurements, in-struments, and uncertainties. The methodologies that are applied to each dataset are also discussed. In Sect. 3, the results from the analyses of these datasets are
pre-sented. In this section, the effect of the reduction of SO2 and NOx emissions on the
10
radiation budget is assessed by using AOD and surface concentration measurements. In addition, the downwelling SW radiation and cloud cover observations are evaluated
to further investigate the aerosol effect. Finally, Sect. 4 summarizes the findings and
conclusions from our analyses.
2 Data and methodology
15
2.1 Surface radiation budget network (SURFRAD)
Data from several sources are used in this study. The first dataset is from SURFRAD
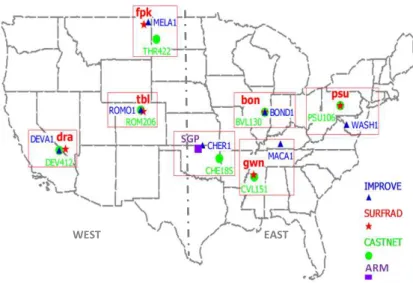
that includes seven sites that examine different climates throughout US in Illinois,
Mon-tana, Mississippi, Colorado, Pennsylvania, Nevada and South Dakota and is main-tained by the National Oceanic and Atmospheric Administration (NOAA). However, the 20
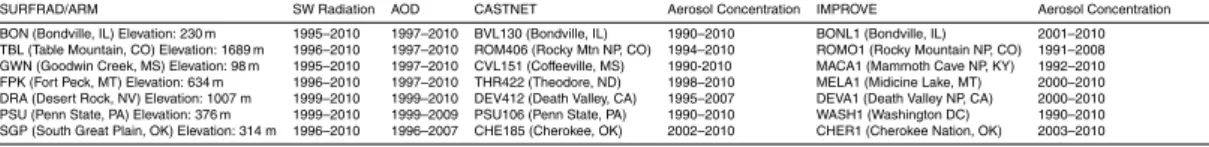
data from South Dakota is not used in this study as the measurements commenced only in 2003. Additional details on each site such as name, operation year and location can be found in Table 1 and Fig. 1. Note that even though measurements still continue to the present, in this study we use data collected at the locations through calendar year 2010.
ACPD
13, 23719–23755, 2013Fffect of air pollution controls on trends in shortwave radiation
C.-M. Gan et al.
Title Page
Abstract Introduction
Conclusions References
Tables Figures
◭ ◮
◭ ◮
Back Close
Full Screen / Esc
Printer-friendly Version
Interactive Discussion
Discussion
P
a
per
|
D
iscussion
P
a
per
|
Discussion
P
a
per
|
Discuss
ion
P
a
per
|
The SURFRAD network not only provides measurements of radiation but also AOD, cloud cover fraction and a variety of meteorological parameters. In this study, we mainly focus on all-sky and clear-sky downwelling SW radiation and AOD. This network
mea-sures the direct and diffuse SW radiation with an Eppley Normal Incidence
Pyrhe-liometer (NIP) and shaded Eppley Black and White (B&W), respectively to produce 5
all-sky SW radiation. If the solar tracker does not work properly, a Spectrolab model SR-75 pyranometer is used to measure the all-sky SW radiation. The AOD data is de-rived based on the measurement of the five spectral SW channels from a MultiFilter Rotating Shadowband Radiometer (MFRSR). Additional detail on the SURFRAD in-struments and measurement techniques can be found in Augustine et al. (2000, 2005, 10
2008).
All SURFRAD broadband radiation measurements have a temporal resolution of 3 min averages of 1 s samples up through 31 December 2008, and thereafter are pro-duced as 1 min averages. However, the resolution of the AOD data varies depending on the raw measurement of the MFRSR as the AOD measurements are not made when 15
clouds interfere with the direct solar beam. Thus, there are not always coincident AOD and SW measurements. In order to keep the data as continuous as possible, quality assurance practices are applied; for instance, exchanging instruments with newly cal-ibrated units annually. The QCRad methodology of Long and Shi (2008) is applied to the radiation data to ensure the data quality is within acceptable range. According to 20
this method, the realistic limits for examining unusual measurements are characterized based on the climatological analyses of radiation observations, particularly from the ARM projects. To produce continuous clear-sky estimates and infer bulk cloud proper-ties from radiation observations, the Radiative Flux Analysis (RFA) is applied after the quality testing. This sophisticated analysis tool is a combination of several analyses 25
ACPD
13, 23719–23755, 2013Fffect of air pollution controls on trends in shortwave radiation
C.-M. Gan et al.
Title Page
Abstract Introduction
Conclusions References
Tables Figures
◭ ◮
◭ ◮
Back Close
Full Screen / Esc
Printer-friendly Version
Interactive Discussion
Discussion
P
a
per
|
D
iscussion
P
a
per
|
Discussion
P
a
per
|
Discuss
ion
P
a
per
|
In this study, the final products which are used in the comparisons are the annual averages. For the radiation data, the averages are estimated based on the approach of
Long et al. (2009) which not only reduces the effects of unavailable data (e.g. missing
or bad) but also helps to avoid the practice of “fill in” for unavailable data. First, the data are sorted into 15-min bins across each 24 h day (i.e. 96 bins across the day). Then 5
the data within each 15-min bin are averaged to obtain an annual average diurnal cycle (i.e. averaging 365 diurnal cycles). For example, all data for the year 1998 are binned at 15-min resolution to calculate an annual 1998 average diurnal cycle. Next, this annual average diurnal cycle is averaged across the 96 15 min bins to produce the final annual average value. This approach is applied to each year (1995–2010) for the data at each 10
SURFRAD and ARM site. Note that, if the data is incomplete or less than 80 % for the entire year (e.g. the first year of measurement), all data for this particular year is
removed from the trend evaluation to minimize any artificial effect on inferred seasonal
variations and trends.
The second measurement that is used in this study is the cloud-free (cloud screen-15
ing) AOD, but it is only available since 1997. The detail of the calibration method, the AOD calculation and the cloud screening method can be found in Harrison et al. (1994) and Augustine et al. (2008). To have the most realistic comparison of AOD with SW radiation trends, we only used AOD measurements that have been cloud screened.
However, this cloud screening is different from the Long and Ackerman (2000)
clear-20
sky identification (CSI) method as the CSI method is intended to identify times of hemi-spherically cloud-free skies, whereas AOD retrievals only require that the path between the instrument and the sun be cloud-free. Thus the Long and Ackerman CSI is much more restrictive than for the AOD retrievals.
To guarantee the quality of the AOD data, Augustine et al. (2008) had compared 25
the measurements at Bondville and Sioux Falls with collocated AERONET sites and
showed good agreement in phase and amplitude at both sites (e.g.R2 values of 0.89
ACPD
13, 23719–23755, 2013Fffect of air pollution controls on trends in shortwave radiation
C.-M. Gan et al.
Title Page
Abstract Introduction
Conclusions References
Tables Figures
◭ ◮
◭ ◮
Back Close
Full Screen / Esc
Printer-friendly Version
Interactive Discussion
Discussion
P
a
per
|
D
iscussion
P
a
per
|
Discussion
P
a
per
|
Discuss
ion
P
a
per
|
in summer, which is expected as the AOD values are highest during that time of year. The data can be found at http://www.srrb.noaa.gov/surfrad/index.html.
2.2 Atmospheric radiation measurement (ARM)
The ARM Climate Research Facility is maintained by the Department of Energy (DOE) and is a multi-platform scientific user facility that supports research of the uncertainties 5
of climate models with clouds and aerosols particularly. It has three permanent fixed research facilities (i.e. the Southern Great Plains (SGP) and the North Slope of Alaska (NSA) in the US, and the Tropical Western Pacific (TWP)) which are designed to obtain
data for studying the effects of aerosols, precipitation, surface radiation and clouds on
global climate change. ARM also includes additional fixed and mobile sites that are 10
under development to extend the research area in a diverse way.
In this study, we are focusing on the surface radiation data from the SGP site. This facility has multiple radiation measurement systems in the same area. These radi-ation systems include an Eppley NIP, Precision Spectral Pyranometers (PSP) and shaded Model 8-48 B&W for the SW radiation measurements. For the observations 15
of downwelling direct, diffuse and all-sky SW, the approximated uncertainties are 3 %
or 4 W m−2, 6 % or 20 W m−2and 6 % or 10 W m−2, respectively. To guarantee the best
possible continuous data, the instruments’ performance is verified daily (Peppler et al., 2008).
The SW radiation data is generated by the RFA algorithm (Long and Ackerman, 20
2000; Long and Gaustad, 2004), which is applied to the ARM data from the SGP net-work of broadband SW radiometer sites. This is the same algorithm that is applied to the SURFRAD SW radiation dataset (see Section 2.1 for detail). In addition, this dataset is quality tested by the QCRad methodology (Long and Shi, 2008) and its an-nual average is obtained by the same methodology as described in Sect. 2.1.
ACPD
13, 23719–23755, 2013Fffect of air pollution controls on trends in shortwave radiation
C.-M. Gan et al.
Title Page
Abstract Introduction
Conclusions References
Tables Figures
◭ ◮
◭ ◮
Back Close
Full Screen / Esc
Printer-friendly Version
Interactive Discussion
Discussion
P
a
per
|
D
iscussion
P
a
per
|
Discussion
P
a
per
|
Discuss
ion
P
a
per
|
2.3 Clean air status and trend network (CASTNET)
This network was established under the 1990 Clean Air Act (CAA) Amendments and has continued and expanded the National Dry Deposition Network, which began in 1987. It is a national, long-term environmental monitoring program which is operated by the Environmental Protection Agency (EPA) and the National Park Service. It is 5
designed to provide data for evaluating trends in air quality, atmospheric deposition
and ecological effects that result from air pollutant emission reductions. Currently, this
network operates approximately 84 monitoring sites through the contiguous US, Alaska and Canada. However, for this study, we are only interested in those sites which are in the vicinity of SURFRAD and ARM sites. The information on the selected CASTNET 10
sites that are used in this study can be found in Table 1 and Fig. 1. This network focuses on the measurements of the concentration of sulfur and nitrogen species and ozone. Concentration measurements for all species except for ozone are made as weekly averages with the open-face 3-stage filter pack which is mounted atop a 10 m tower to collect air pollutants in the form of gases and particles. Ozone measurements are 15
reported each hour.
In this study, the weekly measurement of sulfur dioxide (SO2), particulate sulfate
(SO4) and particulate nitrate (NO3) are processed to obtain annual means at the seven
selected sites geographically paired with SURFRAD sites (see Fig. 1). In order to pro-vide high quality data, the measurements were analyzed relative to data quality indica-20
tors (DQI) such as precision, accuracy and completeness and their associated metrics (CASTNET 2010 Annual Report, 2012). These analyses demonstrate that CASTNET data can be used with confidence for multi-year trend analysis. The standards and policies for all components of project operation from site selection through final data reporting are documented in the CASTNET Quality Assurance Project Plan Revision 25
ACPD
13, 23719–23755, 2013Fffect of air pollution controls on trends in shortwave radiation
C.-M. Gan et al.
Title Page
Abstract Introduction
Conclusions References
Tables Figures
◭ ◮
◭ ◮
Back Close
Full Screen / Esc
Printer-friendly Version
Interactive Discussion
Discussion
P
a
per
|
D
iscussion
P
a
per
|
Discussion
P
a
per
|
Discuss
ion
P
a
per
|
2.4 Interagency monitoring of protection of visual environments (IMPROVE)
The IMPROVE program began in 1988 and is a cooperative measurement effort
de-signed to establish current visibility and aerosol conditions in mandatory Class I areas (CIAs) and identify chemical species and emission sources responsible for existing an-thropogenic and natural visibility impairment. This network consists of approximately 5
212 sites (170 on-going and 42 discontinued sites). Again, we are only interested in those sites which are in the vicinity of SURFRAD and ARM sites (see Fig. 1 and Ta-ble 1).
Each monitoring approach has its own inherent limitations and biases. Determina-tion of gravimetric mass has both negative and positive artifacts. For example, ammo-10
nium nitrate (NH4NO3) and other semivolatiles are lost during sampling; on the other
hand, measured mass includes particle-bound water. Moreover, some species may react with atmospheric gases, which will further increase the positive mass artifact. In particular, estimating aerosol species concentrations requires assumptions concerning the chemical form of various compounds, such as nitrates, sulfates, organic material 15
and soil composition. For example, the IMPROVE Report V (June 2011) shows that
differences on the order of 20 % in organic carbon (OC) mass can occur, depending
on which sampling system is used. However, all these uncertainties in gravimetric and speciation measurements are considered to be within an acceptable range (Malm et al., 2011). More details regarding sites locations, instruments, aerosol sampling and 20
analysis and uncertainties in measurements can be found in IMPROVE Report V June 2011. The data can be found at http://vista.cira.colostate.edu/improve/Data/data.htm.
2.5 Trend estimation
The results from each observation network are presented in all figures as time series of annual mean anomalies (except AOD is represented as annual mean) for each site 25
ACPD
13, 23719–23755, 2013Fffect of air pollution controls on trends in shortwave radiation
C.-M. Gan et al.
Title Page
Abstract Introduction
Conclusions References
Tables Figures
◭ ◮
◭ ◮
Back Close
Full Screen / Esc
Printer-friendly Version
Interactive Discussion
Discussion
P
a
per
|
D
iscussion
P
a
per
|
Discussion
P
a
per
|
Discuss
ion
P
a
per
|
of western US (i.e. averaging the annual mean of TBL, FPK and DRA to obtain the western network mean). Least square fits (LSF) are applied to the eastern and west-ern network mean to determine the tendencies (dash black line). The scatter of the individual sites represents the uncertainty of the network mean and the consistency of the measurements among the various sites in a given region. To ensure the estimated 5
trends are statistically significant, a regression analysis is used to account for autocor-relation and variability in the observed data. This statistical methodology is based on Weatherhead et al. (1998), which has been applied in many studies (Hsu et al., 2012; de Meij et al., 2012). The general principle and its application in our study are briefly discussed in the following paragraph.
10
After obtaining the annual mean for each dataset (i.e. SW radiation, AOD and aerosol
concentration), each trend is determined as the slope coefficient (m) of the LSF.
As-suming a simple linear model,
Yt =mXt+c+Nt (1)
whereYt is the observed value at time t, c is the intercept term, m is the slope, Xt
15
is year t of the time series and Nt is the noise of the time series (i.e. residual from
the straight-line fit at timet). This noise term is assumed to be autoregressive with a
lag of one time period (i.e.Nt =φNt−1+εt, where φis the autocorrelation coefficient
and εt are independent and identically distributed random variables with mean zero,
and variance σε2). Once the m has been estimated using generalized least squares
20
regression (i.e. ˆm), the standard deviation of ˆmcan be estimated by:
σm≈σn
t32 s
1+φ
1−φ (2)
whereσN is the standard deviation of the noise parameterNt, and t is the number of
years. The significance of the trend can be assessed using the ratio |σmˆ|
m, i.e. the
ACPD
13, 23719–23755, 2013Fffect of air pollution controls on trends in shortwave radiation
C.-M. Gan et al.
Title Page
Abstract Introduction
Conclusions References
Tables Figures
◭ ◮
◭ ◮
Back Close
Full Screen / Esc
Printer-friendly Version
Interactive Discussion
Discussion
P
a
per
|
D
iscussion
P
a
per
|
Discussion
P
a
per
|
Discuss
ion
P
a
per
|
normally distributed with mean zero and standard deviation 1. Thus, if this ratio is 1.96 or greater, the trend is significant at the 95 % confidence level. Similarly, if this ratio is greater than 1.65, the trend is significant at the 90 % confidence level. In general, Table 2 shows that all trends are significant at the 95 % confidence level except the
clear-sky direct SW in both eastern and western US from radiation sites and NO3 in
5
eastern US from IMPROVE observations are lower than 90 % confidence level. Note
that it becomes harder to detect a trend with a given level of confidence as σm
in-creases. Unless stated otherwise, the term “significant” in this study indicates that the
estimated trend is statistically significantly different from zero at the given confidence
level. 10
3 Result and discussion
Several studies (Streets et al., 2006; Smith et al., 2011; McDonald et al., 2012; Xing et al., 2013; Hand et al., 2012) show the CAA controls have successfully reduced air
pol-lutants emissions in the US since 1990, especially SO2and NOx. For instance, the SO2
and NOx emissions processed using the methodology described in Xing et al. (2013)
15
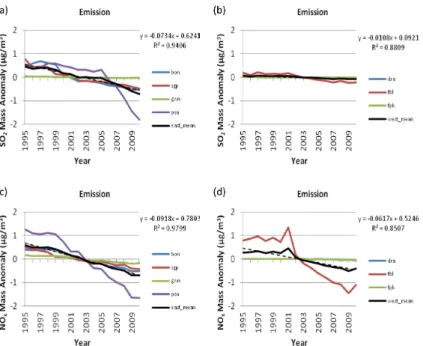
show decreasing trends for each site (Fig. 2a–d). The emission data displayed in this
figure is extracted from the single grid 12 km×12 km cells containing each monitoring
site so that the equivalent network mean can be computed in the same manner as for the observational data. To obtain a more representative depiction of US emission trends, the average based on all grid cells in the west and east regions is also calcu-20
lated (i.e. east and west region mean) because the network mean may be dominated by one of the sites. For example, although the western network mean (averaging of three sites) is mostly driven by the TBL emission (shown in Fig. 2b), the overall western re-gion mean (averaging of western states) still demonstrate a decreasing trend in Fig. 3b.
Note that, as shown in Figs. 2 and 3, these emission trends, either network (SO2east:
25
−0.07 µg m−3yr−1, SO2west:−0.01 µg m−3yr−1, NOxeast:−0.09 µg m−3yr−1and NOx
west: −0.06 µg m−3yr−1) or regional averages (SO2 east: −0.56 Tg yr
−1
ACPD
13, 23719–23755, 2013Fffect of air pollution controls on trends in shortwave radiation
C.-M. Gan et al.
Title Page
Abstract Introduction
Conclusions References
Tables Figures
◭ ◮
◭ ◮
Back Close
Full Screen / Esc
Printer-friendly Version
Interactive Discussion
Discussion
P
a
per
|
D
iscussion
P
a
per
|
Discussion
P
a
per
|
Discuss
ion
P
a
per
|
−0.16 Tg yr−1, NOxeast: −0.41 Tg yr−
1
and NOx west:−0.22 Tg yr−
1
), indicate a more dramatic change in the eastern US compared to the western US. This is most likely because of the CAA controls were aimed to reduce the air pollutants emission in the eastern US where most of the electric generation units (EGUs) and other industrial
facilities are located. In other words, since the SO2 and NOx emissions are low in the
5
western US to begin with, the application of CAA controls did not affect pollutant
emis-sions as drastically.
The AOD is often used as a surrogate for the tropospheric aerosol burden; conse-quently long-term changes in AOD can also be used to verify the trends in the tro-pospheric aerosol burden as well as associated trends in their optical and radiative 10
characteristics. Therefore, one of the analyses is to examine the trends in total column AOD at the SURFRAD and ARM sites in conjunction with surface concentration mea-surements at the paired CASTNET and IMPROVE sites (refer to Fig. 1 and Table 1).
To begin with, we investigate the cloud-screened AOD from SURFRAD and ARM
together with total PM2.5 from IMPROVE to assess the effect of reductions in
anthro-15
pogenic aerosol burden resulting from substantial reductions in emissions of SO2and
NOx over the past 16 yr across the US. As presented in Fig. 4a–d, both trends of
the cloud-screened AOD (East: −0.0012 1 yr−1 and West: 0.0009 1 yr−1) and PM2.5
(East:−0.30 µg m−3yr−1 and West: 0.02 µg m−3yr−1) agree well with each other (i.e.
decreasing in the eastern US while the western US demonstrates a small increasing 20
trend). This is not surprising to because the air pollutants level is much higher in the
eastern US before 1995 while the western mean AOD (less than 0.1) and PM2.5 (less
than 5 µg m−3) are always much lower than the eastern values. Another possible
ex-planation for this phenomenon at the western sites could be potential changes in the long range transport of aerosol/dust plumes which can cause enhancements in both 25
ACPD
13, 23719–23755, 2013Fffect of air pollution controls on trends in shortwave radiation
C.-M. Gan et al.
Title Page
Abstract Introduction
Conclusions References
Tables Figures
◭ ◮
◭ ◮
Back Close
Full Screen / Esc
Printer-friendly Version
Interactive Discussion
Discussion
P
a
per
|
D
iscussion
P
a
per
|
Discussion
P
a
per
|
Discuss
ion
P
a
per
|
aerosol burden are consistent with the analysis of Hsu et al. (2012) who reported large reductions in AOD over eastern US and Europe.
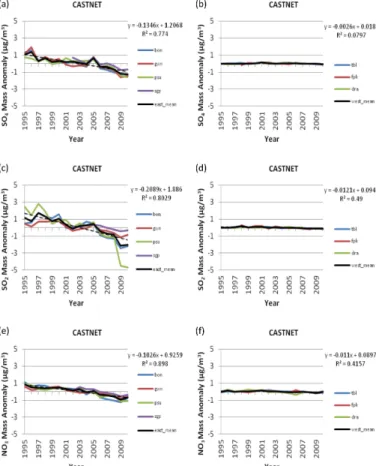
Analysis of trends in surface concentrations from IMPROVE (i.e. SO4
east:-0.093 µg m−3yr−1, SO4west: 0.004 µg m−
3
yr−1, NO3east: 0.003 µg m−
3
yr−1and NO3
west: 0.007 µg m−3yr−1) and CASTNET (i.e. SO2east:−0.209 µg m
−3
yr−1, SO2west: 5
−0.012 µg m−3yr−1, SO4east:−0.135 µg m−
3
yr−1, SO4west:−0.003 µg m−
3
yr−1, NO3
east:−0.103 µg m−3yr−1and NO3west:−0.011 µg m−
3
yr−1) also shows similar results
(see Fig. 5 and 6), except that NO3from CASTNET is decreasing while NO3from
IM-PROVE has a small increasing trend in both regions and SO4in the western US from
both networks shows almost no trend. As shown in both figures, the changes in SO2,
10
SO4 and NO3 are relatively small (almost no trend) in the western US. The small
dif-ference in NO3 between networks may be due to the locations of the measurements
that may be influenced by nearby agriculture activities. The overall results indicate that
the impact of the large reductions in emissions of SO2and NOxresulting from a variety
of control measures under the CAA and its amendments is evident in the decreasing 15
trends in both the surface particulate matter concentrations as well as the AOD es-pecially in the eastern US (Streets et al., 2006; Smith et al., 2011; McDonald et al.,
2012; Xing et al., 2013; Hand et al., 2012). Note that the minor differences between
the emission and the surface concentration trends in the western US may due to the methodology of emission processing. According to Xing et al. (2013), there are some 20
assumptions and uncertainties in the emission data which can be caused by the lag in reporting in rural areas of the western US during the early period and changes in measurement methodologies of certain sources.
The surface radiation measurements from SURFRAD and ARM are evaluated in this
study since the aerosol loading in the atmosphere can have a strong effect on radiation.
25
The change of aerosol loading and cloud cover affect the amount of solar energy that
reaches the ground. In theory, the direct SW radiation is affected by clouds, absorptive
aerosols and certain radiatively active gases (e.g. water vapor and ozone) while the
ACPD
13, 23719–23755, 2013Fffect of air pollution controls on trends in shortwave radiation
C.-M. Gan et al.
Title Page
Abstract Introduction
Conclusions References
Tables Figures
◭ ◮
◭ ◮
Back Close
Full Screen / Esc
Printer-friendly Version
Interactive Discussion
Discussion
P
a
per
|
D
iscussion
P
a
per
|
Discussion
P
a
per
|
Discuss
ion
P
a
per
|
molecules. Since the Rayleigh scattering of molecules is much smaller than the other two factors, it could be neglected in this study.
First, we examined the cloud cover trends together with the all-sky downwelling,
direct and diffuse SW radiation trends at these seven sites. In Figure 7 a-d, the
all-sky downwelling (East: 0.63 W m−2yr−1 and West: 0.51 W m−2yr−1) and direct (East:
5
0.41 W m−2yr−1 and West: 0.17 W m−2yr−1) SW radiation in both regions exhibits
in-creasing trends which indicate more solar energy reaches the ground. At the same
time, the trends of all-sky diffuse (East: 0.26 W m−2yr−1 and West: 0.40 W m−2yr−1)
SW radiation (Fig. 7e–f) also increase in east and west regions while the cloud cover
(East:−0.002 1 yr−1 and West−0.001 1 yr−1) in Fig. 7g–h shows a decreasing trend.
10
This outcome suggests that other factors besides the direct effects of aerosol loading
are affecting the all-sky diffuse SW radiation. Moreover, the study of SW and LW
ra-diation by Augustine and Dutton (2013), and SW by Long et al. (2009), suggests that the SW brightening in US is related to a decrease in cloud coverage and aerosol direct
effects may only play a smaller role in this phenomenon. Also, if the all-sky downwelling
15
SW radiation is associated with decreasing cloud cover trends in the eastern US, this
may be indicative of indirect effects of decreasing aerosol loading since reduced
con-centrations of cloud condensation nuclei (CCN) can cause reductions in cloud albedo and lifetime (Lohmann and Feichter, 2005). Although the all-sky downwelling SW radia-tion is increasing, it is hard to attribute this trend to the individual or combined changes 20
in either the aerosol loading or clouds since these measurements reflect both effects.
Therefore, evaluating the clear-sky downwelling, direct and diffuse SW radiation may
give us a better idea of direct aerosol effects on SW radiation as it eliminates the cloud
effects.
In Figure 8, the clear-sky downwelling SW radiation (East: 0.37 W m−2yr−1and West:
25
0.48 W m−2yr−1) is increasing in both regions of US but the clear-sky direct SW
radi-ation (East: −0.009 W m−2yr−1 and West: 0.001 W m−2yr−1) shows almost no trend.
Moreover, the clear-sky diffuse SW (East: 0.38 W m−2yr−1and West: 0.48 W m−2yr−1)
ACPD
13, 23719–23755, 2013Fffect of air pollution controls on trends in shortwave radiation
C.-M. Gan et al.
Title Page
Abstract Introduction
Conclusions References
Tables Figures
◭ ◮
◭ ◮
Back Close
Full Screen / Esc
Printer-friendly Version
Interactive Discussion
Discussion
P
a
per
|
D
iscussion
P
a
per
|
Discussion
P
a
per
|
Discuss
ion
P
a
per
|
inconsistent with the analysis of AOD and surface concentration trends, particularly
those in the eastern US. However, similar trends in clear-sky diffuse SW radiation were
reported in the analysis of Long et al. (2009) who suggested that increasing trends at all of the sites analyzed in the present study may be indicative of radiation changes owing
to processes other than the dry aerosol direct effects such as aerosol
indirect/semi-5
indirect effects and/or the variation in the atmospheric humidity profile (e.g. increased
high-altitude air traffic) that generate thin cirrus haze but are still traditionally included
in the clear-sky classifications. For example, as noted by Dupont et al. (2008), an op-tical depth of about 0.15 or less at visible band is considered as “clear-sky” in the classification of the RFA methodology and this definition is consistent with human and 10
sky imager observations (Long et al., 2006). Furthermore, as explained by Long et al. (2009), the AOD retrievals include a field-of-view (FOV) larger than the solar disk, such that enhanced forward scattering would be inferred as a reduction in optical depth. As a result, subvisual cirrus would lead to enhanced measurements of the clear-sky
downwelling diffuse SW component while at the same time biasing the AOD retrievals
15
low, with any increase in the direct due to actual decreases in aerosols offset by
in-creased large mode ice crystal scattering of SW out of the direct instrument FOV into
the diffuse field (Long et al., 2009). Meanwhile, these results suggest that the aerosol
is not the key factor that influences the trend in clear-sky diffuse SW in the western US
because the changes in AOD and surface concentrations are relatively small (almost 20
no trend or slightly increasing) while the trends of the clear-sky SW and clear-sky direct behave similar as those trends in eastern US.
Despite these confounding factors, the increasing trend in clear-sky downwelling SW radiation in the eastern US may be at least partially caused by the reduction of anthro-pogenic aerosol loading as the AOD and surface concentrations both have decreasing 25
trends. Xing et al. (2013) showed that the control measures under the CAA have led to
substantial reductions in emissions (total SO2and NOxemissions in the US decreased
ACPD
13, 23719–23755, 2013Fffect of air pollution controls on trends in shortwave radiation
C.-M. Gan et al.
Title Page
Abstract Introduction
Conclusions References
Tables Figures
◭ ◮
◭ ◮
Back Close
Full Screen / Esc
Printer-friendly Version
Interactive Discussion
Discussion
P
a
per
|
D
iscussion
P
a
per
|
Discussion
P
a
per
|
Discuss
ion
P
a
per
|
between AOD and clear-sky downwelling SW radiation is suggestive of decreasing
aerosol direct radiative effects. One of the possible causes of increasing clear-sky
dif-fuse radiation can be the location of the sites which are close to urban regions and
may be influenced by air traffic activities as shown in Fig. 9 (several international and
regional airports are located in this region). The contrail-generated ice haze from the 5
associated air traffic may confound the interpretation of clear and cloudy sky at those
sites in eastern US (Long et al., 2009). Also, note that the clear-sky downwelling SW radiation is estimated based on RFA (Long and Ackerman, 2000; Long and Gaustad, 2004) so there are some uncertainties in this estimation. For example, Long and Ack-erman (2000) showed that the interpolated fits produced clear-sky radiation estimated 10
with a root mean square uncertainty of∼3 % which is caused by the unidentified column
water vapor and aerosol changes normally occurring between clear-sky fitted days.
In order to further examine the causes of the increasing trend in clear-sky diffuse
SW in the eastern US, we analyzed the US domestic airline route network from the major airlines (i.e. Continental, United, US Airways and Delta). This analysis illustrated 15
that a majority of the routes (see Fig. 10 for the combined routes from US Airways and Delta.) are over the eastern US with major airport hubs (see Fig. 9) in urban area such as Chicago, New York City, Atlanta, and Houston which can lead to an increase in contrail-generated haze (i.e. subvisual cirrus) (http://contrailscience.com/interactive-flight-map-visualization/). Moreover, Fig. 11 illustrates the total flight hours of aircraft 20
over the US (source: US Bureau of transportation Statistics) rose notably from 1996 through 2010. The growth of aviation together with the major airline routes crossing the eastern US can potentially enhance the contrail-generated haze and this can further
enhance the “clear-sky” diffuse SW measurements (Yang et al., 2010; Burkhardt et al.,
2010). Also, note that during the last 3 yr (2008–2010) the total flight hours are reducing 25
while the clear-sky diffuse is also decreasing which can be one of the clues that the
contrails is related to the diffuse radiation. Consequently, this finding can be one of
the possible causes of the increasing clear-sky diffuse SW radiation trend since the
ACPD
13, 23719–23755, 2013Fffect of air pollution controls on trends in shortwave radiation
C.-M. Gan et al.
Title Page
Abstract Introduction
Conclusions References
Tables Figures
◭ ◮
◭ ◮
Back Close
Full Screen / Esc
Printer-friendly Version
Interactive Discussion
Discussion
P
a
per
|
D
iscussion
P
a
per
|
Discussion
P
a
per
|
Discuss
ion
P
a
per
|
4 Summary and conclusions
The analysis conducted in this study attempts to determine the consequence of the changes in troposphere aerosol burden arising from substantial reductions in
emis-sions of SO2and NOxassociated with control measures under the CAA over the past
16 yr especially on trends in solar radiation. Radiation measurements for the period 5
1995–2010 from the SURFRAD and ARM sites in the US are analyzed in conjunc-tion with observaconjunc-tions of surface concentraconjunc-tions (CASTNET and IMPROVE) and AOD (SURFRAD) at sites in the vicinity of these radiation measurement sites. This pairing of data from various networks provides an opportunity to examine trends in aerosol
burden and associated radiative effects for various sub-regions across the US and give
10
insight into the causes of observed “brightening”.
The outcome from this study suggests that emission controls (Streets et al., 2006; Smith et al., 2011; McDonald et al., 2012; Xing et al., 2013; Hand et al., 2012) resulted in a substantial reduction in aerosol burden over the North American troposphere, es-pecially across the eastern US, and also shows an associated increase in surface so-15
lar radiation over large portions of the eastern US. However, analysis of the clear-sky
diffuse SW radiation shows that the radiative impacts of decreasing aerosol
concentra-tions are confounded by other factors. Specifically, the clear-sky diffuse SW radiation
was shown to have an increasing trend at all sites, the opposite of what would be ex-pected if changes in radiation were solely attributable to changes in the aerosol direct 20
effect. There are several possible interpretations to resolve this seeming contradiction.
To begin with, we examined the high-altitude air traffic (spatial and temporal) over the
US which can potentially enhance the cirrus haze occurances together with the pro-cedure for the classification of “clear-sky” conditions in the radiation retrieval
method-ology. The analysis shows that air traffic is heaviest over many areas of the eastern
25
US and that there has been a steady decadal growth of air traffic (Long et al., 2009).
sub-ACPD
13, 23719–23755, 2013Fffect of air pollution controls on trends in shortwave radiation
C.-M. Gan et al.
Title Page
Abstract Introduction
Conclusions References
Tables Figures
◭ ◮
◭ ◮
Back Close
Full Screen / Esc
Printer-friendly Version
Interactive Discussion
Discussion
P
a
per
|
D
iscussion
P
a
per
|
Discussion
P
a
per
|
Discuss
ion
P
a
per
|
visual cirrus and cirrus haze that have an influence on the clear-sky downwelling SW
radiation partitioning (between the direct and diffuse components) observed at the
sur-face. Particularly, the AOD retrievals include a FOV larger than the solar disc which can enhance the forward scattering and hence be erroneously interpreted as decreases in optical depth. At the same time, migration of a mostly dry aerosol small-mode scatter-5
ing and absorption to a mix that includes a significant large mode primarily scattering
component can act to offset any increase in the direct component FOV from
decreas-ing aerosols by increased scatterdecreas-ing into the diffuse component due to ice crystals,
as detailed in Long et al. (2009). Unraveling the contributions of the various direct,
semi-indirect and indirect aerosol effects as well as other cloud effects to changes in
10
SW radiation will be pursued through the use of coupled modeling systems such as WRF-CMAQ (Wong et al., 2012) and will be the subject of future studies. Meanwhile,
the causes for the increase of the clear-sky diffuse SW in the western US can be
sim-ilar to the eastern US because the AOD and the surface aerosol concentrations in the western US are low since 1995 and do not vary remarkably.
15
In conclusion, this analysis suggest that there was a SW radiation “brightening” over the past 16 yr in the US (Wild et al., 2009; Long et al., 2009). For all-sky, the “bright-ening” occurs at the same time that cloudiness exhibits a decreasing trend suggesting
indirect effects of the decreasing aerosols. The clear-sky may be associated at least in
part with a decrease in aerosols, particularly in the eastern US where substantial reduc-20
tions in anthropogenic emissions of SO2and NOx, (Xing et al., 2013; Hand et al., 2012)
resulting from the implementation of control measures have resulted in a decrease in the tropospheric aerosol burden. The relationship of the radiation brightening trend to aerosol decreases is less apparent at the western US; this region could be influenced by local terrain influences as well as episodic long-range pollution transport which may 25
contribute to the lack of a clear association between trends in aerosol burden and sur-face radiation at these locations. Nevertheless, the association of “brightening” with the
aerosol direct effect is confounded by increasing trends in clear-sky diffuse SW. Thus, it
radi-ACPD
13, 23719–23755, 2013Fffect of air pollution controls on trends in shortwave radiation
C.-M. Gan et al.
Title Page
Abstract Introduction
Conclusions References
Tables Figures
◭ ◮
◭ ◮
Back Close
Full Screen / Esc
Printer-friendly Version
Interactive Discussion
Discussion
P
a
per
|
D
iscussion
P
a
per
|
Discussion
P
a
per
|
Discuss
ion
P
a
per
|
ation. Moreover, the indirect aerosol and other cloud effects (Ruckstuhl et al., 2008) as
well as the water vapor concentration (Haywood et al., 2011) can potentially influence the surface solar energy. Thus, more studies are needed to evaluate these factors. Fur-thermore, the existence of an association between trends in surface solar radiation and aerosol burden provide a unique test for the current generation of climate-chemistry 5
models. Multi-decadal model calculations with the coupled WRF-CMAQ model (Wong et al., 2012) are being performed for the 1990–2010 period to test the ability of the model to simulate not only the changes in aerosol burden over the US arising from the implementation of the CAA, but also the associated radiation brightening as analyzed in the present analysis. Results from these modeling studies and their comparison with 10
the trends inferred from the observations will be reported in subsequent contributions.
Acknowledgements. This research was performed while Chuen-Meei Gan held a National Re-search Council ReRe-search Associateship Award at US EPA. The reRe-search presented in this study was supported through an interagency agreement between the US Department of En-ergy (funding IA DE-SC0003782) and the US Environmental Protection Agency (funding IA
15
RW-89-9233260). It has been subject to the US EPA’s administrative review and approved for publication. The author also would like thank John Augustine from NOAA-SURFRAD for his support and assistance in obtaining the SURFRAD data. C. N. Long acknowledges the sup-port of the Climate Change Research Division of the US Department of Energy as part of the Atmospheric System Research (ASR) Program.
20
References
Augustine, J. A., DeLuisi, J. J., and Long, C. N.: SURFRAD – A national surface radiation budget network for atmospheric research, B. Am. Meteorol. Soc., 81, 2341–2357, doi:10.1175/1520-477(2000)081<2341:SANSRB>2.3.CO;2, 2000.
Augustine, J. A., Hodges, G. B., Cornwall, C. R., Michalsky, J. J., and Medina, C. I.: An
up-25
ACPD
13, 23719–23755, 2013Fffect of air pollution controls on trends in shortwave radiation
C.-M. Gan et al.
Title Page
Abstract Introduction
Conclusions References
Tables Figures
◭ ◮
◭ ◮
Back Close
Full Screen / Esc
Printer-friendly Version
Interactive Discussion
Discussion
P
a
per
|
D
iscussion
P
a
per
|
Discussion
P
a
per
|
Discuss
ion
P
a
per
|
Augustine, J. A., Hodges, G. B., Dutton, E. G., Michalsky, J. J., and Cornwall, C. R.: An aerosol optical depth climatology for NOAA’s national surface radiation budget network (SURFRAD), J. Geophys. Res., 113, D11204, doi:10.1029/2007JD009504, 2008.
Augustine, J. A. and Dutton, E. G.: Variability of the surface radiation budget over the United States from 1996 through 2011 from high-quality measurements, J. Geophys. Res. Atmos.,
5
118, 43–53, doi:10.1029/2012JD018551,2013.
Burkhardt, U., Kärcher, B., and Schumann, U.: Global modeling of the contrail and contrail cirrus climate impact, AMS BAMS, doi:10.1175/2009BAMS2656.1, April 2010.
CASTNET 2010 Annual Report: available at: http://java.epa.gov/castnet/documents.do, April 2012.
10
CASTNET Quality Assurance Project Plan Revision 8.: available at http://java.epa.gov/castnet/ documents.do, October 2011.
de Meij, A., Pozzer, A. and Leilieveld, J.: Trend analysis in aerosol optical depths and pollutant emission estimates between 2000 and 2009, Atmos. Environ., 51, 75–86, doi:10.1016/j.atmosenv.2012.01.059, 2012.
15
Dupont J. C., Haeffelin, M., and Long, C. N.: Evaluation of cloudless-sky periods detected by shortwave and longwave algorithms using lidar measurements, Geophys. Res. Lett., 35, L10815, doi:10.1029/2008GL033658, 2008.
Dutton, E. G., Nelson, D. W., Stone, R. S., Longenecker, D., Carbaugh, G., Harris, J. M. and Wendell, J.: Decadal variations in surface solar irradiance as observed in a globally remote
20
network, J. Geophys. Res., 111, D19101, doi:10.1029/2005JD006901, 2006.
Gan, C.M., Gross, B., Moshary, F., and Ahmed, S.: Analysis of the Interaction of Aerosol Trans-port Layers on Local Air Quality, IGARSS 2008.
Gilgen, H., Wild, M., and Ohmura, A.: Means and trends of shortwave irradiance at the surface estimated from GEBA, J. Clim., 11, 2042–2061, 1998.
25
Hand, J. L., Schichtel, B. A., Malm, W. C. and Pitchford, M. L.: Particulate sulfate ion concen-tration and SO2 emission trends in the United States from the early 1990s through 2010, Atmos. Chem. Phys., 12, 10353–10365, doi:10.5194/acp-12-10353-2012, 2012.
Harrison, L., Michalsky, J., and Berndt, J.: Automated multifilter rotating shadow-band radiome-ter: An instrument for optical depth and radiation measurements, Appl. Opt., 33, 5118–5125,
30
ACPD
13, 23719–23755, 2013Fffect of air pollution controls on trends in shortwave radiation
C.-M. Gan et al.
Title Page
Abstract Introduction
Conclusions References
Tables Figures
◭ ◮
◭ ◮
Back Close
Full Screen / Esc
Printer-friendly Version
Interactive Discussion
Discussion
P
a
per
|
D
iscussion
P
a
per
|
Discussion
P
a
per
|
Discuss
ion
P
a
per
|
Haywood, J. M., Bellouin, N., Jones, A., Boucher, O., Wild, M. and Shine, K. P.: The roles of aerosol, water vapor and cloud in future global dimming/brightening, J. Geophys. Res. 116, D20203, doi:10.1029/2011JD016000, 2011.
Hsu, N.C., Gautam, R., Sayer, A. M., Bettenhausen, C., Li, C., Jeong, M. J., Tsay, S.-C. and Holben, B. N.: Global and regional trends of aerosol optical depth over land and ocean
5
using SeaWiFS measurements from 1997 to 2010, Atmos. Chem. Phys., 12, 8037–8053, doi:10.5194/acp-12-8037-2012, 2012.
IMPROVE Spatial and Seasonal Patterns and Temporal Variability of Haze and its Constituents in the United States: Report V June 2011 (available at http://vista.cira.colostate.edu/improve/ Publications/Reports/2011/2011.htm), 2011.
10
Malm, W. C., Schichteland, B. A. and Pitchford, M. L.: Chapter 8. Uncertainties in PM2.5 Gravi-metric and Speciation Measurements of IMPROVE Annual Report, 2011.
Mathur, R.: Estimating the impact of the 2004 Alaskan forest fires on episodic particulate matter pollution over the eastern United States through assimilation of satellite derived aerosol optical depths in a regional air quality model, J. Geophys. Res., 113, D17302,
15
doi:10.1029/2007JD009767, 2008.
McDonald, B. C., Dallmann, T. R., Martin, E. W., and Harley, R. A.: Long-term trends in nitrogen oxide emissions from motor vehicles at national, state, and air basin scales, J. Geophys. Res., 117, D00V18, doi:10.1029/2012JD018304, 2012.
Miller, D. J., Sun, K., Zondlo, M. A., Kanter, D., Dubovik, O., Welton, E. J., Winker, D. M., and
20
Ginoux, P.: Assessing boreal forest fire smoke aerosol impacts on US air quality: A case study using multiple data sets, J. Geophys. Res.,116, D22209, doi:10.1029/2011JD016170, 2011.
Liepert, B. G.: Observed reductions of surface solar radiation at sites in the United States and worldwide from 1961 to 1990, Geophys. Res. Lett., 29, 1421, doi:10.1029/2002GL014910,
25
2002.
Lohmann, U. and Feichter, J.: Global indirect aerosol effects: a review, Atmos. Chem. Phys., 5, 715–737, doi:10.5194/acp-5-715-2005, 2005.
Long, C. N., and Ackerman, T. P.: Identification of clear skies from broadband pyranometer measurements and calculation of downwelling shortwave cloud effects, J. Geophys. Res.,
30
ACPD
13, 23719–23755, 2013Fffect of air pollution controls on trends in shortwave radiation
C.-M. Gan et al.
Title Page
Abstract Introduction
Conclusions References
Tables Figures
◭ ◮
◭ ◮
Back Close
Full Screen / Esc
Printer-friendly Version
Interactive Discussion
Discussion
P
a
per
|
D
iscussion
P
a
per
|
Discussion
P
a
per
|
Discuss
ion
P
a
per
|
Long, C. N., and Gaustad, K. L.: The shortwave (SW) clear-sky detection and fitting algorithm: Algorithm operational details and explanations, ARM TR-004, 26 pp., U. S. Dep. of Energy, Washington, D.C. (available at http://science.arm.gov/vaps/swflux.stm), 2004.
Long, C. N., Ackerman, T. P., Gaustad, K. L., and Cole, J. N. S.: Estimation of fractional sky cover from broadband shortwave radiometer measurements, J. Geophys. Res., 111,
5
D11204, doi:10.1029/2005JD006475, 2006.
Long, C. N., and Shi, Y.: An automated quality assessment and control algorithm for surface ra-diation measurements, Open Atmos. Sci. J., 2, 23–37, doi:10.2174/1874282300802010023, 2008.
Long, C. N., Dutton, E. G., Augustine, J. A., Wiscombe, W., Wild, M., McFarlane, S. A., and
10
Flynn, C. J.: Significant decadal brightening of downwelling shortwave in the continental United States, J. Geophys. Res., 114, D00D06, doi:10.1029/2008JD011263, 2009.
Ohmura, A. and Lang, H.: Secular variation of global radiation over Europe, in Current Prob-lems in Atmospheric Radiation, edited by J. Lenoble and J. F. Geleyn, 98–301, A. Deepak, Hampton, Va, 1989.
15
Peppler, R. A., Kehoe, K. E., Sonntag, K. L., Bahrmann, C. P., Richardson, S. J., Christensen, S. W., McCord, R. A., Doty, K. J., Wagener, R., Eagan, R. C., Liljegren, J. C., Orr, B. W., Sisterson, D. L., Halter, T. D., Keck, N. N., Long, C. N., Macduff, M. C., Mather, J. H., Perez, R. C., Voyles, J. W., Ivey, M. D., Moore, S. T., Nitschke, K. L., Perkins, B. D., and Turner, D. D.: Quality Assurance of ARM Program Climate Research Facility Data,
DOE/SC-ARM/TR-20
082, 65 pp., Dep. of Energy, Washington, D. C. (available at http://www.arm.gov/publications/ tech_reports/doe-sc-arm-tr-082.pdf), 2008.
Pinker, R. T., Zhang, B., and Dutton, E. G.: Do satellites detect trends in surface solar radiation?, Science, 308, 850–854, 2005.
Ruckstuhl, C., Philipona, R., Behrens, K., Coen, M. C., Durr, B., Heimo, A., Matzler, C., Nyeki,
25
S., Ohmura, A., Vuilleumier, L., Weller, M., Wehrli, C., and Zelenka, A.: Aerosol and cloud effects on solar brightening and the recent rapid warming, Geophys. Res. Lett., 35, L12708, doi:10.1029/2008GL034228, 2008.
Smith, S. J., van Aardenne, J., Klimont, Z., Andres, R. J., Volke, A., and Delgado Arias, S.: Anthropogenic sulfur dioxide emissions: 1850—2005, Atmos. Chem. Phys., 11, 1101–1116,
30
ACPD
13, 23719–23755, 2013Fffect of air pollution controls on trends in shortwave radiation
C.-M. Gan et al.
Title Page
Abstract Introduction
Conclusions References
Tables Figures
◭ ◮
◭ ◮
Back Close
Full Screen / Esc
Printer-friendly Version
Interactive Discussion
Discussion
P
a
per
|
D
iscussion
P
a
per
|
Discussion
P
a
per
|
Discuss
ion
P
a
per
|
Stanhill, G. and Cohen, S.: Global dimming: A review of the evidence for a widespread and significant reduction in global radiation, Agric. For. Meteorol., 107, 255–278, doi:10.1016/S0168-1923(00)00241-0, 2001.
Streets, D. G., Wu, Y., and Chin, M.: Two-decadal aerosol trends as a likely explana-tion of the global dimming / brightening transiexplana-tion, Geophys. Res. Lett., 33, L15806,
5
doi:10.1029/2006GL026471, 2006.
Uno, I, Eguchi, K., Yumimoto, K., Liu, Z., Hara, Y., Sugimoto, N., Shimizu, A. and Takemura, T.: Large Asian dust layers continuously reached North America in April 2010. Atmos. Chem. Phys., 11, 7333–7341, doi:10.5194/acp-11-7333-2011, 2011.
Weatherhead, E. C., Reinsel, G. C., Tiao, G. C., Meng, X.-L., Choi, D., Cheang, W.-K., Keller,
10
T., DeLuisi, J., Wuebbles, D. J., Kerr, J. B., Miller, A. J., Oltmans, S. J. and Frederick, J. E.: Factors affecting the detection of trends: Statistical considerations and applications to environmental data, J. Geophys. Res., 103, 17149–17161, doi:10.1029/98JD00995, 1998. Wild, M.: Global dimming and brightening: A review, J. Geophys. Res., 114, D00D16,
doi:10.1029/2008JD011470, 2009.
15
Wild, M., Ohmura, A., Gilgen, H., and Rosenfeld, D.: On the consistency of trends in radiation and temperature records and implications for the global hydrological cycle, Geophys. Res. Lett., 31, L11201, doi:10.1029/2003GL019188, 2004.
Wild, M., Gilgen, H., Roesch, A., Ohmura, A., Long, C. N., Dutton, E. G., Forgan, B., Kallis, A., Russak, V., and Tsvetkov, A.: From dimming to brightening: Decadal changes in surface
20
solar radiation, Science, 308, 847–850, doi:10.1126/science.1103215, 2005.
Wild, M., Trüssel, B., Ohmura, A., Long, C. N., König-Langlo, G., Dutton, E. G., and Tsvetkov, A.: Global dimming and brightening: An update beyond 2000, J. Geophys. Res., 114, D00D13, doi:10.1029/2008JD011382, 2009.
Wong, D. C., Pleim, J. E., Mathur, R., Binkowski, F. S., Otte, T. L., Gilliam, R. C., Pouliot, G., Xiu,
25
A., Young, J. O., and Kang, D.: WRF-CMAQ Two-way Coupled System with Aerosol Feed-back: Software Development and Preliminary Results. Geoscientific Model Development. Copernicus Publications, Katlenburg-Lindau, Germany, 5, 299–312, 2012.
Xing, J., Pleim, J., Mathur, R., Pouliot, G., Hogrefe, C., Gan, C.-M., and Wei, C.: Historical gaseous and primary aerosol emissions in the United States from 1990 to 2010, Atmos.
30
ACPD
13, 23719–23755, 2013Fffect of air pollution controls on trends in shortwave radiation
C.-M. Gan et al.
Title Page
Abstract Introduction
Conclusions References
Tables Figures
◭ ◮
◭ ◮
Back Close
Full Screen / Esc
Printer-friendly Version
Interactive Discussion
Discussion
P
a
per
|
D
iscussion
P
a
per
|
Discussion
P
a
per
|
Discuss
ion
P
a
per
|
Table 1.Listing of site identification of each site for different networks and their measurement
period which are used in this study.
SURFRAD/ARM SW Radiation AOD CASTNET Aerosol Concentration IMPROVE Aerosol Concentration
BON (Bondville, IL) Elevation: 230 m 1995–2010 1997–2010 BVL130 (Bondville, IL) 1990–2010 BONL1 (Bondville, IL) 2001–2010
TBL (Table Mountain, CO) Elevation: 1689 m 1996–2010 1997–2010 ROM406 (Rocky Mtn NP, CO) 1994–2010 ROMO1 (Rocky Mountain NP, CO) 1991–2008
GWN (Goodwin Creek, MS) Elevation: 98 m 1995–2010 1997–2010 CVL151 (Coffeeville, MS) 1990-2010 MACA1 (Mammoth Cave NP, KY) 1992–2010
FPK (Fort Peck, MT) Elevation: 634 m 1996–2010 1997–2010 THR422 (Theodore, ND) 1998–2010 MELA1 (Midicine Lake, MT) 2000–2010
DRA (Desert Rock, NV) Elevation: 1007 m 1999–2010 1999–2010 DEV412 (Death Valley, CA) 1995–2007 DEVA1 (Death Valley NP, CA) 2000–2010
PSU (Penn State, PA) Elevation: 376 m 1999–2010 1999–2009 PSU106 (Penn State, PA) 1990–2010 WASH1 (Washington DC) 1990–2010
ACPD
13, 23719–23755, 2013Fffect of air pollution controls on trends in shortwave radiation
C.-M. Gan et al.
Title Page
Abstract Introduction
Conclusions References
Tables Figures
◭ ◮
◭ ◮
Back Close
Full Screen / Esc
Printer-friendly Version
Interactive Discussion
Discussion
P
a
per
|
D
iscussion
P
a
per
|
Discussion
P
a
per
|
Discuss
ion
P
a
per
|
Table 2. Trends (slope) for each dataset between periods of 1995 to 2010, along with the
standard error and confidence level, respectively.
Trend Std. Error σm|mˆ| Confidence Level % Emission Region Mean
SO2east −0.5637 0.0129 43.68 > 95 SO2west −0.1643 0.0037 44.19 > 95 NOxeast −0.4086 0.0226 18.04 > 95 NOxwest −0.2231 0.0168 13.32 > 95
Emission Network Mean
SO2east −0.0734 0.0030 24.88 > 95 SO2west −0.0108 0.0004 28.18 > 95 NOxeast −0.0918 0.0015 60.03 > 95 NOxwest −0.0617 0.0030 20.56 > 95
SURFRAD and ARM
AOD east −0.0012 0.0003 4.26 > 95 AOD west 0.0009 0.0001 6.70 > 95 All-sky SW down east 0.6296 0.0566 11.13 > 95 All-sky SW down west 0.5131 0.0359 14.28 > 95 Clear-sky SW down east 0.3691 0.0292 12.65 > 95 Clear-sky SW down west 0.4799 0.0443 10.82 > 95 All-sky direct SW east 0.4149 0.0576 7.21 > 95 All-sky direct SW west 0.1739 0.0488 3.56 > 95 Clear-sky direct SW east -0.0085 0.0315 0.27 < 90 Clear-sky direct SW west 0.0005 0.0331 0.015 < 90 All-sky diffuse SW east 0.2555 0.0235 10.86 > 95 All-sky diffuse SW west 0.4009 0.0489 8.21 > 95 Clear-sky diffuse SW east 0.3764 0.0107 35.11 > 95 Clear-sky diffuse SW west 0.4781 0.0253 18.88 > 95 Cloud cover east −0.0021 0.0003 6.13 > 95 Cloud cover west −0.0012 0.0004 2.71 > 95
IMPROVE
PM2.5east −0.2998 0.0114 26.34 > 95 PM2.5west 0.0181 0.0074 2.44 > 95 SO4east −0.0933 0.0071 13.10 > 95 SO4west 0.0038 0.0009 4.39 > 95 NO3east 0.0025 0.0065 0.39 < 90 NO3west 0.0069 0.0013 5.37 > 95
CASTNET
ACPD
13, 23719–23755, 2013Fffect of air pollution controls on trends in shortwave radiation
C.-M. Gan et al.
Title Page
Abstract Introduction
Conclusions References
Tables Figures
◭ ◮
◭ ◮
Back Close
Full Screen / Esc
Printer-friendly Version
Interactive Discussion
Discussion
P
a
per
|
D
iscussion
P
a
per
|
Discussion
P
a
per
|
Discuss
ion
P
a
per
|
WEST EAST
ACPD
13, 23719–23755, 2013Fffect of air pollution controls on trends in shortwave radiation
C.-M. Gan et al.
Title Page
Abstract Introduction
Conclusions References
Tables Figures
◭ ◮
◭ ◮
Back Close
Full Screen / Esc
Printer-friendly Version
Interactive Discussion
Discussion
P
a
per
|
D
iscussion
P
a
per
|
Discussion
P
a
per
|
Discuss
ion
P
a
per
|
Fig. 2.Annual anomalies of SO2(first row) and NOx(second row) emission for each site
ACPD
13, 23719–23755, 2013Fffect of air pollution controls on trends in shortwave radiation
C.-M. Gan et al.
Title Page
Abstract Introduction
Conclusions References
Tables Figures
◭ ◮
◭ ◮
Back Close
Full Screen / Esc
Printer-friendly Version
Interactive Discussion
Discussion
P
a
per
|
D
iscussion
P
a
per
|
Discussion
P
a
per
|
Discuss
ion
P
a
per
|
Fig. 3.Annual anomalies of SO2 (left) and NOx (right) emission for each region mean (solid