ACPD
13, 935–982, 2013CLARA-A1: the CM SAF cloud, albedo and radiation dataset
K.-G. Karlsson et al.
Title Page
Abstract Introduction
Conclusions References
Tables Figures
◭ ◮
◭ ◮
Back Close
Full Screen / Esc
Printer-friendly Version Interactive Discussion
Discussion
P
a
per
|
Dis
cussion
P
a
per
|
Discussion
P
a
per
|
Discussio
n
P
a
per
|
Atmos. Chem. Phys. Discuss., 13, 935–982, 2013 www.atmos-chem-phys-discuss.net/13/935/2013/ doi:10.5194/acpd-13-935-2013
© Author(s) 2013. CC Attribution 3.0 License.
Atmospheric Chemistry and Physics Discussions
This discussion paper is/has been under review for the journal Atmospheric Chemistry and Physics (ACP). Please refer to the corresponding final paper in ACP if available.
CLARA-A1: the CM SAF cloud, albedo and
radiation dataset from 28 yr of global
AVHRR data
K.-G. Karlsson1, A. Riihel ¨a2, R. M ¨uller3, J. F. Meirink4, J. Sedlar1, M. Stengel3, M. Lockhoff3, J. Trentmann3, F. Kaspar3, R. Hollmann3, and E. Wolters4,*
1
Swedish Meteorological and Hydrological Institute (SMHI), Norrk ¨oping, Sweden 2
Finnish Meteorological Institute (FMI), Helsinki, Finland 3
Deutscher Wetterdienst (DWD), Offenbach, Germany 4
Royal Netherlands Meteorological Institute (KNMI), De Bilt, The Netherlands *
now at: HKV Consultants, Lelystad, The Netherlands
Received: 12 November 2012 – Accepted: 20 December 2012 – Published: 9 January 2013
Correspondence to: K.-G. Karlsson (karl-goran.karlsson@smhi.se)
Published by Copernicus Publications on behalf of the European Geosciences Union.
ACPD
13, 935–982, 2013CLARA-A1: the CM SAF cloud, albedo and radiation dataset
K.-G. Karlsson et al.
Title Page
Abstract Introduction
Conclusions References
Tables Figures
◭ ◮
◭ ◮
Back Close
Full Screen / Esc
Printer-friendly Version Interactive Discussion
Discussion
P
a
per
|
Dis
cussion
P
a
per
|
Discussion
P
a
per
|
Discussio
n
P
a
per
Abstract
A new satellite-derived climate dataset – denoted CLARA-A1 (“The CM SAF cLoud, Albedo and RAdiation dataset from AVHRR data”) – is described. The dataset cov-ers the 28-yr period from 1982 until 2009 and consists of cloud, surface albedo and radiation budget products derived from the AVHRR (Advanced Very High Resolution
5
Radiometer) sensor carried by polar orbiting operational meteorological satellites. Its content, anticipated accuracies, limitations and potential applications are described. The dataset is produced by the EUMETSAT Climate Monitoring Satellite Application Facility (CM SAF) project.
The dataset has its strengths in the long duration, its foundation upon a homogenized
10
AVHRR radiance data record, and in some unique features, e.g. the availability of 28 yr of summer surface albedo and cloudiness parameters over the polar regions. Quality characteristics are also well investigated and particularly useful results can be found over the tropics, mid- to high-latitudes and over nearly all oceanic areas.
Being the first CM SAF dataset of its kind, an intensive evaluation of the quality of
15
the datasets was performed and major findings wrt. to merits and shortcomings of the datasets are reported. However, the CM SAF’s long-term commitment to perform two additional reprocessing events within the time frame 2013–2017 will allow a proper handling of limitations as well as upgrading the dataset with new features (e.g. uncer-tainty estimates) and extension of the temporal coverage.
20
1 Introduction
Sustained climate monitoring activities are extremely important for assessing the pre-sumed anthropogenically induced and accelerated climate change during the recent hundred years (Trenberth et al., 2002; Karl et al., 1995). Since the fundamental forcing of the climate is the net input and output of radiation into the Earth-Atmosphere system
25
radia-ACPD
13, 935–982, 2013CLARA-A1: the CM SAF cloud, albedo and radiation dataset
K.-G. Karlsson et al.
Title Page
Abstract Introduction
Conclusions References
Tables Figures
◭ ◮
◭ ◮
Back Close
Full Screen / Esc
Printer-friendly Version Interactive Discussion
Discussion
P
a
per
|
Dis
cussion
P
a
per
|
Discussion
P
a
per
|
Discussio
n
P
a
per
|
tion budget components and associated influencing factors, both at the Earth’s surface and at the top of the atmosphere (TOA). Among the influencing factors, changes in global cloudiness and surface albedo are two essential factors with large impacts on the radiation budget that require special attention (Dufresne and Bony, 2008; Bekryaev et al., 2010; Flanner et al., 2011).
5
The need for global monitoring inherently means that satellites must play an increas-ingly important role due to the ability to observe the Earth at high spatial and temporal resolution. However, it is vital that the satellite radiance datasets are carefully collected and prepared in order to achieve the highest standards of homogeneity and calibration (Ohring et al., 2005). In addition, one must assure that retrieval methods applied to
10
original radiance datasets are appropriate and used in a consistent manner. The EU-METSAT Climate Monitoring Satellite Application Facility (CM SAF) project was formed in 1998 to address these issues and, in particular, to ensure a proper use of opera-tional meteorological satellite data for climate monitoring purposes. A comprehensive description of CM SAF activities and plans is given by Schultz et al. (2009).
15
Satellite observations have a very short history in a climatological perspective; use-ful systematic measurements did not begin until around 1980 (Davis, 2007). Conse-quently, it is only possible to study satellite-based observational series spanning at most three decades. Despite this seemingly critical limitation, it is important that these observations are analysed and prepared for future continuation in order to be used for
20
careful evaluation of short- and medium-term climate fluctuations, in particular those suggested by climate scenarios from climate model simulations. Equally important is the ability to assist in the evaluation of climate models’ ability to describe historic cli-mate fluctuations during the last decades through hindcast simulations.
One of the longest satellite observation records is that collected by the Advanced
25
Very High Resolution Radiometer (AVHRR) operated onboard the polar orbiting NOAA satellites (also carried by the Metop-A polar orbiter operated by EUMETSAT from 2006). Measurements began already in 1978 and have continued until present date (Kogan et al., 2011). The last AVHRR sensor is scheduled for launch in 2017 (on
ACPD
13, 935–982, 2013CLARA-A1: the CM SAF cloud, albedo and radiation dataset
K.-G. Karlsson et al.
Title Page
Abstract Introduction
Conclusions References
Tables Figures
◭ ◮
◭ ◮
Back Close
Full Screen / Esc
Printer-friendly Version Interactive Discussion
Discussion
P
a
per
|
Dis
cussion
P
a
per
|
Discussion
P
a
per
|
Discussio
n
P
a
per
Metop-C) but AVHRR-like datasets will be available from sensors on future satellite missions. This can be accomplished by sub-setting the spectral channels from new imagers, noting that many of them inherit the original AVHRR channels. Examples of these new imagers are the Visible Infrared Imager Radiometer Suite (VIIRS – carried by the NOAA satellite successors Suomi NPP and the forthcoming JPSS satellites,
5
Justice et al., 2011), the Sea and Land Surface Temperature Radiometer (SLSTR – to be carried by ESA ENVISAT successor satellites Sentinel 3A and 3B, Coppo et al., 2009) and the METimage sensor (to be carried by EUMETSAT Metop successors from the EUMETSAT Polar System – Second Generation (EPS-SG), see Schm ¨ulling, 2010). Thus, AVHRR-like observations will be available for several additional decades
10
to come, putting the AVHRR sensor in the front row among satellite sensors best suited for climate monitoring purposes.
Climate Data Records (CDR) based on historic AVHRR data have been compiled by e.g. the International Satellite Cloud Climatology Project (ISCCP, Rossow and Schiffer, 1999) but only based on a sub-set of the full AVHRR spectral channel dataset. The first
15
multi-parameter dataset making use of all AVHRR channels is the AVHRR Pathfinder Atmospheres Extended (PATMOS-x) dataset. PATMOS-x has been generated in sev-eral versions and the latest algorithm and dataset versions are described by Heidinger et al. (2012), Foster and Heidinger (2012) and Walther and Heidinger (2012).
This paper presents a new comprehensive cloud and radiation dataset prepared by
20
the CM SAF project based on global historic AVHRR data. It includes similar cloud products as the PATMOS-x dataset but produced with different algorithms. In addition, it also includes products for the surface albedo and the surface radiation budget. The dataset is given the acronym CLARA, formed from the expression “The CM SAF cLoud, Albedo and RAdiation dataset”. We will use CLARA in the remainder of the text to
25
ACPD
13, 935–982, 2013CLARA-A1: the CM SAF cloud, albedo and radiation dataset
K.-G. Karlsson et al.
Title Page
Abstract Introduction
Conclusions References
Tables Figures
◭ ◮
◭ ◮
Back Close
Full Screen / Esc
Printer-friendly Version Interactive Discussion
Discussion
P
a
per
|
Dis
cussion
P
a
per
|
Discussion
P
a
per
|
Discussio
n
P
a
per
|
use AVHRR and that this is the first of several reprocessing releases. The observation period amounts to 28 years, starting in 1982 and ending in 2009.
The basic AVHRR radiance dataset is described in Sect. 2 followed by method de-scriptions and initial results and comparisons with existing satellite datasets for the three groups of products in Sects. 3–5. Section 6 discusses early validation results,
5
limitations and appropriate application areas. The concluding Sect. 7 summarises the main features of the dataset and outlines future plans for the extension and improve-ment of the dataset.
2 The historic AVHRR dataset
Table 1 describes the AVHRR instrument, its various versions and the satellites
car-10
rying them. Initially, the instrument only measured in four spectral bands (AVHRR/1), but from 1982, a fifth channel at 12 µm was added (AVHRR/2). Further, a sixth channel at 1.6 µm was added in 1998 (AVHRR/3); however this channel was only accessible if switched with the previous third channel at 3.7 µm. The retrieval of cloud physical properties (in particular particle effective radius and liquid/ice water path – see more
15
detailed descriptions later in Sect. 3.2) is sensitive to the shortwave near-infrared chan-nel being used, which was for example investigated in Stengel et al. (2012). Table 2 summarizes when either of the channels 3A and 3B has been active on the AVHRR/3 instruments. The AVHRR instrument measures at a horizontal resolution close to 1 km at nadir but only data at a reduced resolution of approximately 4 km are permanently
20
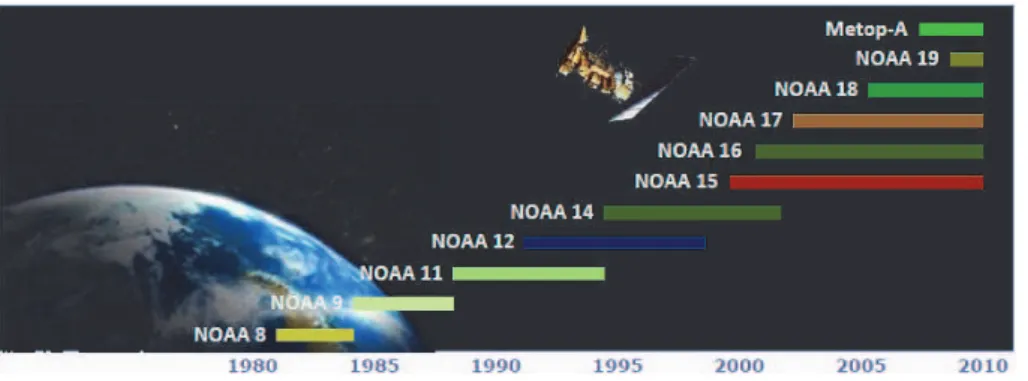
archived and currently available with global coverage since the onset of measurements. Figure 1 describes the coverage of observations used in CLARA-A1 for each in-dividual satellite over the entire period. Cloud product retrieval methods have been dependent on access to two infrared split-window channels at 11 and 12 µm, mean-ing that only data from satellites carrymean-ing the AVHRR/2 or AVHRR/3 instruments have
25
been used. As seen in Fig. 1, this leads to a reduced time sampling (i.e., only one
ACPD
13, 935–982, 2013CLARA-A1: the CM SAF cloud, albedo and radiation dataset
K.-G. Karlsson et al.
Title Page
Abstract Introduction
Conclusions References
Tables Figures
◭ ◮
◭ ◮
Back Close
Full Screen / Esc
Printer-friendly Version Interactive Discussion
Discussion
P
a
per
|
Dis
cussion
P
a
per
|
Discussion
P
a
per
|
Discussio
n
P
a
per
satellite available for daily observations) between 1982 and 1991. On the other hand, from 2001 and onwards, more than two satellites are available for daily observations.
Observations from polar orbiting sun synchronous satellites are made at the same local solar time at each latitude band. Normally, satellites are classified into observa-tion nodes according to the local solar time when crossing the equator during daytime
5
(illuminated conditions). For the NOAA/Metop-A satellite observations, a system with one morning observation node and one afternoon observation node has been utilised as the fundamental polar orbiting observation system. Theoretically, this yields four equally-distributed observations per day (if including the complementary observation times at night and in the evening when the satellite passes again 12 h later).
How-10
ever, equator-crossing times have varied slightly between satellites. Morning satellites have generally been confined to the local solar time interval 07:00–08:00 and afternoon satellites to the interval 13:30–14:30 (Foster and Heidinger, 2012). However, a more significant deviation was introduced for the morning satellites NOAA-17 and Metop-A, now being defined in a so-called mid-morning orbit with equator crossing times close
15
to 10:00. A specific problem with the observation nodes for the NOAA satellites has been the difficulty in keeping observation times stable for each individual satellite (e.g. as described by Ignatov et al., 2004).
An important aspect for any product-based climate dataset (formally denoted The-matic Climate Data Records – TCDRs) is that retrieved products have to be derived
20
from accurately calibrated and homogenized radiances, formally denoted Fundamen-tal Climate Data Records (FCDRs). This is necessary for several reasons but most importantly for assuring that analysed trends are not artificially caused by differences between individual satellites and changes in observation frequencies and times. We have used an AVHRR FCDR prepared by NOAA (Heidinger et al., 2010). This FCDR
25
tar-ACPD
13, 935–982, 2013CLARA-A1: the CM SAF cloud, albedo and radiation dataset
K.-G. Karlsson et al.
Title Page
Abstract Introduction
Conclusions References
Tables Figures
◭ ◮
◭ ◮
Back Close
Full Screen / Esc
Printer-friendly Version Interactive Discussion
Discussion
P
a
per
|
Dis
cussion
P
a
per
|
Discussion
P
a
per
|
Discussio
n
P
a
per
|
gets have been found to provide reasonably stable and reliable results. (i.e., at least in the sense that only small trends or degradations have been detected as opposed to the situation for visible channels, e.g. see Trishchenko et al., 2002). However, future upgrades of the AVHRR FCDR need to address existing calibration uncertainties for the infrared channels as well (e.g. see Mittaz et al., 2009).
5
3 Cloud products
The presentation of the derived cloud products in CLARA-A1 has been subdivided into the following three sub-groups:
1. Basic cloud products derived from the EUMETSAT Nowcasting Satellite Applica-tion Facility NWC SAF cloud processing package
10
2. Cloud products derived from the CM SAF Cloud Physical Properties (CPP) pack-age
3. Multi-parameter cloud product representations
The first group of cloud products (consisting of cloud amount or cloud fraction – denoted CFC – and cloud-top level – denoted CTO) represents the general
three-15
dimensional occurrence of clouds as described by the horizontal and vertical extension of cloud layers. The second group (cloud phase – CPH, cloud optical thickness – COT, cloud liquid and ice water path – LWP and IWP, respectively) represents cloud optical and microphysical properties. Finally, the third group (joint cloud-property histograms – JCH) represents condensed forms of cloud information involving both previous groups.
20
The CLARA-A1 cloud data set is based on instantaneous AVHRR Global Area Cov-erage (GAC) retrievals which have been used to derive the spatio-temporally avCov-eraged data sets at original swath level (4 km horizontal resolution). The products are avail-able as daily and monthly composites for each satellite on a regular latitude/longitude grid with a spatial resolution of 0.25◦
×0.25◦. In addition, results for the CFC and the 25
ACPD
13, 935–982, 2013CLARA-A1: the CM SAF cloud, albedo and radiation dataset
K.-G. Karlsson et al.
Title Page
Abstract Introduction
Conclusions References
Tables Figures
◭ ◮
◭ ◮
Back Close
Full Screen / Esc
Printer-friendly Version Interactive Discussion
Discussion
P
a
per
|
Dis
cussion
P
a
per
|
Discussion
P
a
per
|
Discussio
n
P
a
per
surface albedo (SAL, introduced in Sect. 4) products are available on two equal-area polar grids at 25 km resolution for the Arctic and Antarctic regions, respectively. These grids are centred at the poles and cover areas of 1000 km×1000 km.
The monthly averages are also available in aggregated form (i.e. merging all satel-lites). Acknowledging the different observation capabilities during night and during day
5
and also taking into account existing diurnal variations in cloudiness, a further sep-aration of results into daytime and night-time portions has also been done. Here, all observations made under twilight conditions (solar zenith angles between 80–95 de-grees) have been excluded in order to avoid being affected by specific cloud detection problems occurring in the twilight zone (as explained by Derrien and LeGleau, 2010).
10
All cloud products to be described in the following sub-sections (and also the fol-lowing surface albedo and surface radiation products) are described in detail in Prod-uct User Manuals (PUM), Algorithm Theoretical Basis Documents (ATBD) and Val-idation reports (VAL) available via the CM SAF web user interface accessible from www.cmsaf.eu. These documents are important since the peer-reviewed publications
15
referred to in the following may not include the latest algorithm changes.
3.1 Basic cloud products derived from the NWC SAF cloud processing package
The CFC product is derived directly from results of a cloud screening or cloud masking method. CFC is defined as the fraction of cloudy pixels per grid box compared to the total number of analysed pixels in the grid box; CFC is expressed in percent. This
prod-20
uct is calculated using the NWC SAF Polar Platform System (PPS) cloud processing software. The algorithm (Dybbroe et al., 2005) is based on a multi-spectral threshold-ing technique applied to every pixel of the satellite scene. Several threshold tests may be applied (and must be passed) before a pixel is assigned to be cloudy or cloud-free. Thresholds are assigned depending on present viewing and illumination conditions
25
ACPD
13, 935–982, 2013CLARA-A1: the CM SAF cloud, albedo and radiation dataset
K.-G. Karlsson et al.
Title Page
Abstract Introduction
Conclusions References
Tables Figures
◭ ◮
◭ ◮
Back Close
Full Screen / Esc
Printer-friendly Version Interactive Discussion
Discussion
P
a
per
|
Dis
cussion
P
a
per
|
Discussion
P
a
per
|
Discussio
n
P
a
per
|
(e.g. land use categories and surface emissivities) is also taken into account. Thus, thresholds are dynamically defined, and therefore unique, for each individual pixel.
The CTO product is also derived using the NWC SAF PPS cloud software. Two sepa-rate algorithms are used, one for opaque clouds, and one for fractional and semitrans-parent clouds. For opaque clouds, cloudy top of atmosphere radiances from various
5
levels in the atmosphere are simulated using the RTTOV radiative transfer code (Saun-ders et al., 1999). The simulations are then compared and matched against measured radiances. Semi-transparent clouds are identified as clouds having significant bright-ness temperature differences between AVHRR channels 3B, 4 and 5 (i.e. at 3.7 µm, 11 µm and 12 µm). In a subsequent step, the cloud-top height is derived in an
iter-10
ative manner by analysing the distribution of 11 µm and 12 µm radiance differences. This difference is large for thin ice clouds over sufficiently warm surfaces below the semi-transparent cloud layer as a consequence of the fact that ice clouds appear more opaque at 12 µm due to differences in refractive indices for water and ice.
Observe that the CTO product exists in three different flavours, all simply different
15
representations of the same product:
1. Cloud Top Temperature (CTT), expressed in Kelvin.
2. Cloud Top Height (CTH), expressed as altitude (m) relative to topography. 3. Cloud Top Pressure (CTP), expressed as pressure (hPa).
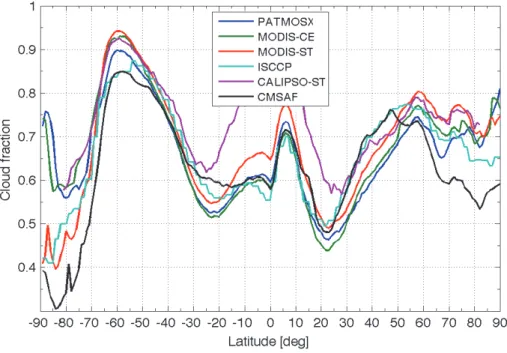
Examples of the monthly CFC and CTO products are shown in Fig. 2 for July 2007.
20
A corresponding yearly mean of zonally-averaged results for afternoon orbits (NOAA-18) is shown in Fig. 3. Results are here compared with results from five other satellite-based datasets (PATMOS-x, ISCCP, MODIS-Science Team, MODIS-CERES team and CALIPSO-Science Team). The reference datasets were extracted from the GEWEX global cloud assessment database (Stubenrauch et al., 2012).
25
From Fig. 3 we observe quite good agreement with the other datasets with respect to the overall global distribution of cloudiness; this also concerns the geographical
ACPD
13, 935–982, 2013CLARA-A1: the CM SAF cloud, albedo and radiation dataset
K.-G. Karlsson et al.
Title Page
Abstract Introduction
Conclusions References
Tables Figures
◭ ◮
◭ ◮
Back Close
Full Screen / Esc
Printer-friendly Version Interactive Discussion
Discussion
P
a
per
|
Dis
cussion
P
a
per
|
Discussion
P
a
per
|
Discussio
n
P
a
per
tribution of cloud features according to Fig. 2 (although not shown for the other ref-erence datasets). However, there are some features of the CLARA-A1 dataset that deviate from the other datasets. Cloud amounts appear to be generally lower, espe-cially over the polar regions. Additionally, the CLARA-A1 CFC is substantially lower over the Southern Ocean between 50–70◦S. We suspect issues related to the extent 5
of sea ice in the Southern Ocean during the polar winter to be the primary contributor to the suspected low bias; efforts are underway for improving the seasonal CFC here for the next AVHRR GAC reprocessing event.
Another deviation from the other datasets can be seen for the latitude bands between 20 to 40 degrees on both hemispheres where the CLARA-A1 CFC is slightly larger
10
than the other passive satellite observations (although, this is only valid for afternoon passages). This has been identified as inappropriately relaxed cloud thresholds in the transition zone between pure desert areas and tropical vegetated areas, and to remove this feature will be a top priority task for the 2nd reprocessing of the dataset.
Concerning the CTO product in Fig. 2, the northward movement and intensification
15
of the ITCZ over the Asian branch in July is well depicted here. Results agree quite well with other reference datasets (not shown here) despite some differences in the basic cloud amounts. More specific features and differences to other datasets are better visible in multi-parameter visualisations (see Sect. 3.3).
Extensive validation efforts comparing with surface observations, A-Train
observa-20
tions (mainly from the CALIPSO-CALIOP sensor) and the datasets displayed in Fig. 3 suggests that CFC results are accurate to within 10 % (absolute). Corresponding stud-ies of CTO results indicate accuracstud-ies of 60 hPa for CTP and within 500 m for CTH (although, the latter only achieved if filtering out topmost CALIPSO-CALIOP cloud lay-ers with cloud optical thickness lower than 0.3).
25
ACPD
13, 935–982, 2013CLARA-A1: the CM SAF cloud, albedo and radiation dataset
K.-G. Karlsson et al.
Title Page
Abstract Introduction
Conclusions References
Tables Figures
◭ ◮
◭ ◮
Back Close
Full Screen / Esc
Printer-friendly Version Interactive Discussion
Discussion
P
a
per
|
Dis
cussion
P
a
per
|
Discussion
P
a
per
|
Discussio
n
P
a
per
|
3.2 Cloud products derived from the CM SAF Cloud Physical Properties (CPP) package
Four CLARA-A1 optical and microphysical cloud products are derived using the CPP algorithm (Roebeling et al. 2006). These are: cloud phase – CPH, cloud optical thick-ness – COT, liquid water path – LWP and ice water path – IWP. The central principle
5
of the method to retrieve these cloud properties is that the reflectance of clouds at a non-absorbing wavelength in the visible region (0.6 or 0.8 µm) is largely dependent on the optical thickness with little dependence on particle effective radius (re), whereas the reflectance of clouds at an absorbing wavelength in the near-infrared region (1.6 or 3.7 µm) is strongly dependent on effective radius (Nakajima and King, 1992). In the
10
CPP algorithm, the Doubling-Adding KNMI (DAK, De Haan et al., 1987; Stammes, 2001) radiative transfer model (RTM) is used to simulate 0.6- and 1.6-/3.7-µm TOA re-flectances as a function of viewing geometry, cloud optical thickness, effective radius, and cloud phase. These simulated reflectances are stored in a look-up table (LUT).
COT andreare retrieved for cloudy pixels in an iterative manner by simultaneously
15
comparing satellite-observed reflectances to the LUT of RTM-simulated reflectances. Simulations are made for both ice and water clouds, enabling the retrieval of CPH. In those cases when simulated radiances for ice and water clouds overlap (suggesting two different solutions for COT andre), the solution is found by also utilizing cloud-top-temperature and the assumption that water clouds should be warmer than 265 K. In
20
a subsequent step, the liquid water path (LWP) of water clouds can be computed using the following relation (Stephens, 1978):
LWP=2/3ρlτre (1)
whereρlis the density of liquid water andτis the COT. For water clouds, effective radii
25
between 1 and 24 µm are retrieved. The ice water path (IWP) is approximated using the same relation as for LWP but with COT andreretrievals based on RTM simulations for imperfect hexagonal ice crystals. Homogeneous distributions of C0, C1, C2, and C3
ACPD
13, 935–982, 2013CLARA-A1: the CM SAF cloud, albedo and radiation dataset
K.-G. Karlsson et al.
Title Page
Abstract Introduction
Conclusions References
Tables Figures
◭ ◮
◭ ◮
Back Close
Full Screen / Esc
Printer-friendly Version Interactive Discussion
Discussion
P
a
per
|
Dis
cussion
P
a
per
|
Discussion
P
a
per
|
Discussio
n
P
a
per
type ice crystals from the COP library (Hess et al., 1998) are assumed, with effective radii of 6, 12, 26, and 51 µm, respectively. A final, but critical, remark is that the CPP products depend on the availability of reflectances from visible channels; consequently CPP products are exclusively daytime products.
Figure 4 illustrates the CPH, LWP and IWP products for one selected month (July
5
2007). Notice the consequence of requiring solar zenith angles (SZA) below 72◦; the
majority of the globe south of 50◦S experiences too large SZAs or is in the midst of
the polar night. The CPP products give a good description of large-scale cloud cli-matologies, such as the liquid-dominated stratocumulus regions offthe west coast of continents and the deep convective nature of mainly ice-topped clouds along the ITCZ.
10
The mid-latitude cyclone tracks are also present on both hemispheres. Limitations are most notably seen in the Arctic, where inadequate characterization of sea ice has led to the retrieval of too large cloud water paths.
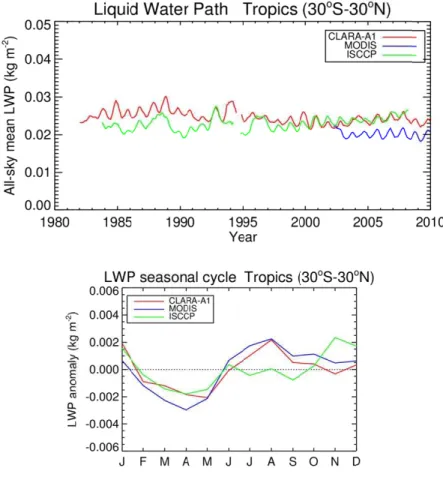
A comparison of LWP in the Tropics with two other satellite-based datasets is shown in Fig. 5. One of them (ISCCP) has a similar observation length as CLARA-A1, but
15
has a large contribution from geostationary satellites; the other (MODIS) spans less than a decade. The three datasets agree reasonably well in the absolute amount of tropical cloud liquid water, but have different levels of variability. As expected, MODIS is most stable, because it involves a single, well-calibrated, instrument. CLARA-A1 and ISCCP show considerable trends during various parts of the time series. Although part
20
of this variability may be real, it is likely related to artifacts such as jumps between satellites, orbital drift, and availability of different channels (AVHRR ch3a vs. ch3b). Despite these issues, a promising finding is that the three datasets, and in particular CLARA-A1 and MODIS, agree relatively well on the average seasonal cycle of tropical LWP (see lower panel of Fig. 5). Comparisons were also made (not shown) with an
25
con-ACPD
13, 935–982, 2013CLARA-A1: the CM SAF cloud, albedo and radiation dataset
K.-G. Karlsson et al.
Title Page
Abstract Introduction
Conclusions References
Tables Figures
◭ ◮
◭ ◮
Back Close
Full Screen / Esc
Printer-friendly Version Interactive Discussion
Discussion
P
a
per
|
Dis
cussion
P
a
per
|
Discussion
P
a
per
|
Discussio
n
P
a
per
|
siderably larger spread between different datasets. It is clear that current estimations of this parameter are still very uncertain (e.g. Eliasson et al., 2011).
To summarise the findings from validation efforts, results suggest accuracies for CPH, COT, LWP and IWP of 15 % (absolute frequencies of water clouds), 15 %, 20 % and 50 %, respectively.
5
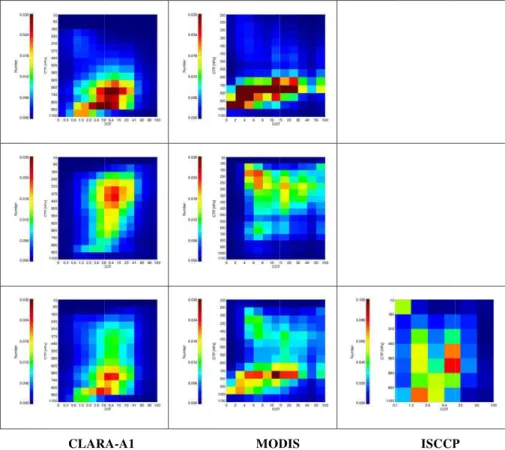
3.3 Multi-parameter cloud product representations
The joint cloud property histogram (JCH) product is a combined histogram of CTP and COT covering the solution space of both parameters. This two-dimensional histogram gives the absolute numbers of occurrences for specific COT and CTP combinations defined by specific bins, separated into liquid and ice clouds. Notice that the product is
10
defined in a slightly coarser grid (1×1 degree resolution) in order to achieve higher
sta-tistical significance and to maintain manageable file sizes. As the product is currently archived, analysis is possible in several modes, from the grid-point resolution (local dis-tributions), over smaller, user-specified geographical domains (regional distributions) or for all grid-points describing average distributions for the entire globe.
15
Figure 6 shows the JCH product integrated globally for March 2007, compared to corresponding histograms from the MODIS Science Team and ISCCP. It is obvious that all three datasets show very different CTP-COT distributions. Some similarities are found with the MODIS distribution with respect to the vertical distribution of clouds but it is clear that the MODIS range of COT values is much larger than both CM SAF and
20
ISCCP. Additionally, on the global scale, CM SAF had a tendency to give lower frequen-cies of optically thin (t <5) ice clouds compared with MODIS. This can be attributed to a higher efficiency by MODIS-based methods in detecting these clouds because of the availability of sounding channels (not available for CM SAF or ISCCP). In general, all three datasets have different bin sizes in COT and CTP, making direct interpretations
25
difficult.
ACPD
13, 935–982, 2013CLARA-A1: the CM SAF cloud, albedo and radiation dataset
K.-G. Karlsson et al.
Title Page
Abstract Introduction
Conclusions References
Tables Figures
◭ ◮
◭ ◮
Back Close
Full Screen / Esc
Printer-friendly Version Interactive Discussion
Discussion
P
a
per
|
Dis
cussion
P
a
per
|
Discussion
P
a
per
|
Discussio
n
P
a
per
4 The surface albedo product
The AVHRR radiance data record and the cloud mask product (i.e. the basic cloud screening product used for generation of CFC) have been utilized to generate a 28-yr record of terrestrial surface albedo. This dataset, henceforth called CLARA-A1 SAL, describes the global black-sky surface albedo over the waveband of 0.25–2.5 µm. The
5
dataset is generated at the same spatial resolution and projection(s) as the CLARA-A1 cloud products. The dataset is available as five-day (pentad) or monthly means. Examples of the CLARA-A1 SAL product for January and July 2007 are given in Fig. 7. The dataset and its validation are described in detail by Riihel ¨a et al. (2012); there-fore we will only provide a brief overview here. The retrieval algorithm is composed
10
of sequential steps of (1) topography corrections in geolocation and radiometry over mountainous terrain, (2) an atmospheric correction for scattering and absorption ef-fects of aerosols and other constituents, (3) a correction for reflectance anisotropy of vegetated surfaces and spectral albedo calculation, and (4) a narrow-to-broadband conversion to derive the albedo over the full waveband. Snow and ice are special
15
cases; as the reflectance anisotropy of snow is large and varies according to snow type (Peltoniemi et al., 2005), we derive only broadband bidirectional reflectances from the AVHRR overpasses and derive the surface albedo by averaging the bidirectional reflectances spanning the viewing hemisphere.
The dataset has been validated against in situ albedo observations from the
Base-20
line Surface Radiation Network (Ohmura et al., 1998), the Greenland Climate Network (Steffen et al., 1996), and the Surface Heat Balance of the Arctic Ocean (SHEBA) and Tara floating ice camps (Perovich et al., 2002; Gascard et al., 2008). Apart from the ice camps, data coverage of 10 yr or more was required at each validation site. The validation results showed that CLARA-A1 SAL can retrieve the surface albedo with
25
ACPD
13, 935–982, 2013CLARA-A1: the CM SAF cloud, albedo and radiation dataset
K.-G. Karlsson et al.
Title Page
Abstract Introduction
Conclusions References
Tables Figures
◭ ◮
◭ ◮
Back Close
Full Screen / Esc
Printer-friendly Version Interactive Discussion
Discussion
P
a
per
|
Dis
cussion
P
a
per
|
Discussion
P
a
per
|
Discussio
n
P
a
per
|
the heterogeneity of high-resolution near-infrared surface reflectances at CLARA-A1 SAL pixel scales. This indicates that spatial representativeness issues in the in situ albedo measurements have to be considered when assessing the product quality (Ri-ihel ¨a et al., 2012).
The timeseries was also compared with existing surface albedo products from
5
MODIS (Schaaf et al., 2002) and CERES FSW (Rutan et al., 2009). Both comparisons showed similar results; on a global scale, CLARA-A1 SAL mean albedo is 10–20 % higher than either CERES or MODIS mean albedo in relative terms. The MODIS com-parison is presented in more detail by Riihel ¨a et al. (2012). Here we show an overview of the CERES comparison results in Fig. 8. The figure shows the monthly mean albedo
10
from both CLARA-A1 SAL and CERES FSW averaged over the commonly retrievable land/snow area after CLARA-A1 SAL has been coarsened to the 1-by-1 degree spatial resolution of CERES FSW. The dashed line shows the relative difference between the products. As we can see, the difference is fairly constant in time. An analysis of the differences on latitudinal bands (not shown) reveals that the products agree best over
15
the boreal zone north of 50◦N, whereas the largest disagreements are over the tropical
latitudes. Regional exceptions to this tendency of course do occur.
5 Surface radiation budget products
5.1 Algorithm overview – solar surface irradiance
The Mesoscale Atmospheric Global Irradiance Code (MAGIC) algorithm is used for
20
the retrieval of the solar surface irradiance (SIS) (Mueller et al., 2004, 2009). A brief description of the applied algorithm is given below following Wang et al. (2011). The effect of the atmospheric variables ozone, aerosol, water vapour and clouds and of the surface albedo is considered by radiative transfer calculations. Atmospheric transmit-tance is pre-calculated and saved in a look-up table (LUT) for a variety of combinations
25
ACPD
13, 935–982, 2013CLARA-A1: the CM SAF cloud, albedo and radiation dataset
K.-G. Karlsson et al.
Title Page
Abstract Introduction
Conclusions References
Tables Figures
◭ ◮
◭ ◮
Back Close
Full Screen / Esc
Printer-friendly Version Interactive Discussion
Discussion
P
a
per
|
Dis
cussion
P
a
per
|
Discussion
P
a
per
|
Discussio
n
P
a
per
rived from pre-calculated LUTs for the atmospheric state given at the specific location and time for each pixel. However, instead of a traditional LUT approach which requires a huge amount of pre-calculations, a more sophisticated approach, the hybrid eigen-vector approach, is applied. This approach is motivated by linear algebra and takes benefit of the eigenvector behaviour of the system (see Mueller et al. (2009) and more
5
coherently Mueller et al. (2012) for further details about the eigenvector hybrid ap-proach). The effect of the solar zenith angle on the transmission, hence the surface solar irradiance, is considered by the use of the Modified Lambert-Beer (MLB) function (Mueller et al., 2004).
The algorithm considers the effect of aerosols with different aerosol optical
thick-10
ness, single scattering albedo, and asymmetry parameters. The respective informa-tion is taken from an aerosol climatology which is based on the Aerocom model me-dian (Kinne et al., 2006) merged with Aeronet in-situ data (Holben et al., 1998). Water vapour is considered by its density and a standard profile. The water vapour density is taken from the ERA-Interim project (Dee, 2011). In addition to the atmospheric
vari-15
ables also the effect of the surface albedo is considered. For this purpose surface albedo is calculated based on the spatial distribution of 20 surface types following the recommendation of the Surface and Atmospheric Radiation Budget (SARB) working group, which is part of the Clouds and the Earth’s Radiant Energy System (CERES) mission.
20
Variations in cloud properties induce variations in the top of atmosphere albedo. In this respect, the top of atmosphere albedo is used as input to consider the effects of clouds. Hence, the algorithm requires the satellite-derived TOA broadband albedo in the shortwave spectral region as input parameter. However, this quantity is not mea-sured directly by the AVHRR instrument, but has to be calculated. As a first step, the
25
ACPD
13, 935–982, 2013CLARA-A1: the CM SAF cloud, albedo and radiation dataset
K.-G. Karlsson et al.
Title Page
Abstract Introduction
Conclusions References
Tables Figures
◭ ◮
◭ ◮
Back Close
Full Screen / Esc
Printer-friendly Version Interactive Discussion
Discussion
P
a
per
|
Dis
cussion
P
a
per
|
Discussion
P
a
per
|
Discussio
n
P
a
per
|
function (BRDF, also termed Angular Dependence Model (ADM)) derived for ERBE (Suttles et al., 1986). Figure 9 shows a diagram of the algorithm processing steps and the used input.
The output of the MAGIC algorithm is the all-sky surface solar irradiances in the 0.2– 4.0 µm wavelength region. The extra-terrestrial total solar irradiance is 1365 W m−2and 5
is adjusted according to the Earth-Sun distance. Figure 10 shows a long term mean of the CLARA-A1 solar irradiance data for September as an example. Information on the data quality is provided for the surface sites from the Baseline Surface Radiation Network (BSRN, Ohmura et al., 1989). All main features of the global distribution of surface irradiance are visible in the CLARA SIS data set, including the stratocumulus
10
regions in the eastern Atlantic and eastern Pacific as shown by their reduced surface irradiance. During the evaluation the data quality was found to be strongly degraded over bright surfaces (i.e. snow covered areas, desert) and the corresponding data were set to missing (white areas in Fig. 10).
5.2 Algorithm overview – terrestrial part 15
The CM SAF algorithm to derive the surface downwelling longwave (SDL) radiation from the AVHRR GAC data set is based on the monthly mean surface downwelling longwave radiation data from the ERA-Interim data set. The CLARA-A1 cloud fraction (CFC) data set and high-resolution topographic information are used to generate the SDL data set on the global 0.25◦grid.
20
The surface downwelling longwave radiation from the AVHRR GAC data set is calcu-lated from the monthly mean of the clear-sky surface downwelling longwave radiation derived from ERA-Interim and the cloud correction term (CCF) multiplied with CLARA-A1 CFC data set at 0.25×0.25 degree resolution:
SDLCLARA=SDLclr+CFCCLARA∗CCF (2)
25
here SDLclrdenotes the monthly mean clear-sky surface downwelling longwave radia-tion from ERA-Interim and CFCCLARAis the CLARA-A1 cloud fraction (CFC).
ACPD
13, 935–982, 2013CLARA-A1: the CM SAF cloud, albedo and radiation dataset
K.-G. Karlsson et al.
Title Page
Abstract Introduction
Conclusions References
Tables Figures
◭ ◮
◭ ◮
Back Close
Full Screen / Esc
Printer-friendly Version Interactive Discussion
Discussion
P
a
per
|
Dis
cussion
P
a
per
|
Discussion
P
a
per
|
Discussio
n
P
a
per
The cloud correction factor (CCF) is defined as the ratio of the difference between the model clear-sky and all-sky surface longwave downwelling radiation to the model cloud fraction:
CCF= ∆SDL
CFCERA =
SDLallsky−SDLclr
CFCERA (3)
5
where CFCERArepresents the reanalysis grid-box horizontal cloud fraction. The cloud correction factor describes the sensitivity of the surface downwelling longwave radiation to changes in cloud fraction. It is derived from linear regression for grid boxes that ex-hibit a CFC variability of more than 10 % and for grid boxes with a correlation coefficient between∆SDL and CFC above 0.6. For the remaining grid boxes, CCF is extrapolated
10
from neighbouring grid boxes. Figure 11 shows the temporally averaged cloud correc-tion factor derived from the 31 year-long ERA-Interim data set. No correccorrec-tion is applied to the clear-sky downwelling longwave surface radiation in the inner tropical region, where high amounts of water vapour result in an opaque boundary layer for thermal radiation, making the cloud effect on SDL negligible. The largest cloud effect can be
15
seen in the mid-latitudes, especially in the Southern Hemisphere were low-level clouds have a huge impact on downward longwave radiation. Monthly-varying CCFs are used in the derivation of CLARA-A1 SDL.
Topography substantially modifies the surface net longwave radiation, because of the change in near-surface temperature induced by changes in altitude. Based on
ob-20
servations, Wild et al. (1995) found that the surface downwelling longwave radiation decreases on average by 2.8 W m−2 per 100 m in elevation. To account for this e
ffect when generating the CLARA-A1 SDL data set, the Global Land One-km Base Ele-vation Project (GLOBE) database has been used to calculate the topography on the 0.25◦ global grid. The GLOBE data set is a global 1-km gridded, quality-controlled 25
ACPD
13, 935–982, 2013CLARA-A1: the CM SAF cloud, albedo and radiation dataset
K.-G. Karlsson et al.
Title Page
Abstract Introduction
Conclusions References
Tables Figures
◭ ◮
◭ ◮
Back Close
Full Screen / Esc
Printer-friendly Version Interactive Discussion
Discussion
P
a
per
|
Dis
cussion
P
a
per
|
Discussion
P
a
per
|
Discussio
n
P
a
per
|
the differences in the surface elevation between the two grids. The conservation of the surface downwelling longwave radiation on the original ERA-Interim grid is taken into account during the topographic correction. The multi-year averaged surface down-welling longwave radiation for July is shown in Fig. 12. The high quality of this data set is indicated by the validation using the BSRN surface measurements. The
large-5
scale features of this data set correspond to the ERA-Interim data. The small scale features in CLARA SDL, e.g. in topographically-varying regions lead to a significant improvement for regional climate monitoring and analysis.
Based on the surface radiation products, cloud radiative effect products are derived and provided in addition. Finally, the outgoing thermal radiation and the surface
ra-10
diation budget are available as well. All CM SAF GAC surface radiation data sets are globally available as monthly means from 1982 to 2009 on an equal-angle grid of 0.25◦.
An overview of product characteristics (i.e. associated accuracies and uncertainties) is given in Table 3.
6 Discussion 15
The strength of the CLARA-A1 dataset is the long observation record since many other available datasets (e.g. from MODIS) are only available for the last decade. In addition, access to multiple shortwave channels allows a better retrieval of cloud optical proper-ties and access to split-window channels in the thermal infrared region allows a better delineation of cirrus cloudiness compared to datasets based exclusively on just one
20
visible and infrared channel (e.g. ISCCP). Regional results have also been evaluated extensively (e.g. see Karlsson and Dybbroe, 2010; Riihel ¨a et al., 2012) and are stable after many years of development and use in the CM SAF project.
Still, for some areas on the globe results are less reliable and users may have to await further updates of the dataset for securing a proper use. This is further
empha-25
sized by noting that, despite homogenization efforts, the current dataset has remaining weaknesses in the temporal coverage and frequency of observations. Consequently,
ACPD
13, 935–982, 2013CLARA-A1: the CM SAF cloud, albedo and radiation dataset
K.-G. Karlsson et al.
Title Page
Abstract Introduction
Conclusions References
Tables Figures
◭ ◮
◭ ◮
Back Close
Full Screen / Esc
Printer-friendly Version Interactive Discussion
Discussion
P
a
per
|
Dis
cussion
P
a
per
|
Discussion
P
a
per
|
Discussio
n
P
a
per
CLARA-A1 applications aiming at performing global trend analyses from this first edi-tion of the dataset must be done with great care. To illustrate the problem with the temporal sampling, we examine the CLARA-A1 time series of daily mean global CFC over the full period 1982–2009 in Fig. 13. Included is the corresponding daily mean CFC from the PATMOS-x version 5 dataset with cloud screening based on methods
5
described by Heidinger et al. (2012). We immediately notice a clear decreasing trend for CLARA-A1 CFC over the period amounting to approximately 10 %. The correspond-ing trend for PATMOS-x is approximately 5 %. Since the CFC values for CLARA-A1 and PATMOS-x are more or less the same in the beginning of the period, it leads to that PATMOS-x values are about 5 % higher than CLARA at the end of the period. This is
10
also consistent with results in Fig. 3 where PATMOS-x values are generally higher than CLARA-A1, in particular near the poles.
Thus, both datasets indicate a negative global temporal trend (although with diff er-ent magnitudes) in CFC over the period. However, if we compare with results from all available surface stations (synoptic observations) we see only a trend in the difference
15
between the two datasets meaning that only satellite results have a negative trend in Fig. 14 (bias trend shown in lower panel). To avoid being influenced by a changing surface observation network, we have here only used surface stations that were active over the full observation period. Unfortunately this biases the geographic distribution of the 165 stations included to primarily European and North American stations. Thus,
20
results in Fig. 14 are more representative for the Northern Hemisphere than for the entire globe. Nevertheless, we do not see signs of a large negative trend in cloudiness for this restricted surface observation dataset. Another interesting fact is that if look-ing exclusively at daytime and night-time results from CLARA-A1 (not shown here), no trends are seen as opposed to results for the total satellite-based dataset. However,
25
ACPD
13, 935–982, 2013CLARA-A1: the CM SAF cloud, albedo and radiation dataset
K.-G. Karlsson et al.
Title Page
Abstract Introduction
Conclusions References
Tables Figures
◭ ◮
◭ ◮
Back Close
Full Screen / Esc
Printer-friendly Version Interactive Discussion
Discussion
P
a
per
|
Dis
cussion
P
a
per
|
Discussion
P
a
per
|
Discussio
n
P
a
per
|
The introduction of morning-evening satellites in the 90s, and even a slight dominance of morning-evening satellites during the last ten years, could be responsible for creat-ing this trend in global cloud amounts. Future editions of the CLARA dataset need to address these limitations, through either solving the temporal sampling differences or by the use of mitigation methods.
5
Another aspect that needs improvement in coming editions is daytime cloud screen-ing over sub-tropical land regions where the current dataset is not optimal. This has led to some overestimated cloud amounts and a too high frequency of optically thin water clouds. Furthermore, the daytime distribution of thin water clouds and thin ice clouds in this region is then slightly biased meaning that, e.g. studies of sub-tropical and tropical
10
cirrus cloudiness are compromised.
Nevertheless, for other regions (e.g. over mid- and high-latitudes, over most oceanic regions and over polar regions during the polar summer) results should be of suffi -cient quality for allowing detailed studies. For example, the long temporal record of the CLARA-A1 dataset would be a valuable asset for studies focussing on the sea ice –
15
cloud interactions during the polar summer when surface albedo, radiation and cloud properties are available. This is also supported by the good validation results obtained from the surface albedo retrievals over snow and ice (Riihel ¨a et al., 2012).
The advantages of the CLARA-A1 product time series stem from its origins in a ho-mogenized long-term AVHRR radiance dataset. This is particularly important for
prod-20
ucts that rely exclusively on AVHRR visible channels compared to the ones that are based on the full multispectral channel dataset. Those products are the Cloud Physical Products, the SAL product and the solar part of the surface radiation budget products. Closely related to this topic, one can also notice that the SAL product covers a suffi -ciently long timespan to be of use as a reference against (for example) surface albedo
25
parameterizations in climate models, and the homogenization of the underlying radi-ance data avoids the inter-satellite discontinuities that could threaten the cohesion of the timeseries. The stability of the CLARA-A1 SAL timeseries was evaluated using the central part of the Greenland Ice Sheet as a site whose albedo was expected to
ACPD
13, 935–982, 2013CLARA-A1: the CM SAF cloud, albedo and radiation dataset
K.-G. Karlsson et al.
Title Page
Abstract Introduction
Conclusions References
Tables Figures
◭ ◮
◭ ◮
Back Close
Full Screen / Esc
Printer-friendly Version Interactive Discussion
Discussion
P
a
per
|
Dis
cussion
P
a
per
|
Discussion
P
a
per
|
Discussio
n
P
a
per
main fairly constant over a long period (Riihel ¨a et al., 2012). The results showed that the maximum deviation of CLARA-A1 SAL monthly mean albedo over this site from its 28-yr mean was 6.8 %, including some natural variability associated with e.g. varying solar zenith angles. Also, the 28-year mean albedo for this site was estimated to be 0.844 which is very well in line with literature citations for the albedo of dry fresh snow
5
(0.85, Konzelmann and Ohmura, 1995).
There are also some caveats which need to be kept in mind when using the CLARA-A1 SAL dataset. The aerosol optical depth (AOD) input in the atmospheric correction was kept universally constant at 0.1 in this first edition. We acknowledge that this sce-nario is accurate only over the polar regions where the atmosphere is dry and thin,
10
and that considerable over- and underestimations will occur over regions with high and variable aerosol loading. Efforts are currently underway to identify a dataset or algorithm that will allow for an accurate correction for aerosol effects in the next re-lease of the CLARA-A SAL. However, we wish to point out that over vegetated terrain, the near-infrared reflectance typically dominates the resulting broadband albedo. As
15
aerosol scattering and absorption effects are smaller in the near-infrared region, our simulations indicate that a true AOD of 0.25 will only cause an additional relative er-ror of 3–5 % in the retrieved broadband albedo given typical grass reflectances and viewing/illumination geometries. Based on AOD retrievals from, e.g. MISR (Martonchik et al., 1998), the annual mean AOD is less than this for most non-tropical regions of
20
the Earth. This of course is also not the case over deserts, where retrieval errors can be considerably larger.
Other issues such as sporadic cloud masking errors (especially during low sun con-ditions) or inaccuracies in the land cover dataset used to resolve the CLARA-A1 SAL algorithms may cause retrieval errors as well. The users are recommended to utilize
25
the existing support data (number of observations and standard deviation per pixel) to remove suspect retrievals from their analysis.
ACPD
13, 935–982, 2013CLARA-A1: the CM SAF cloud, albedo and radiation dataset
K.-G. Karlsson et al.
Title Page
Abstract Introduction
Conclusions References
Tables Figures
◭ ◮
◭ ◮
Back Close
Full Screen / Esc
Printer-friendly Version Interactive Discussion
Discussion
P
a
per
|
Dis
cussion
P
a
per
|
Discussion
P
a
per
|
Discussio
n
P
a
per
|
point of the dataset. As such, we recommend the dataset particularly for climate model validation and climate monitoring studies involving the polar regions.
The data sets of the surface shortwave radiation quantities (SIS, SNS, SAL, CFS) exhibit high quality and are mainly derived from satellite observations. Also the quality of the up- and downwelling longwave surface fluxes is remarkable good, expressed by
5
a low bias and absolute differences in comparison with BSRN stations. However, these data sets use substantial information from reanalyses. This should be considered if the data is used for evaluation of reanalyses and other model-derived data sets. However, the high quality makes this variable very valuable for the analysis of the greenhouse warming, which directly affects SDL.
10
The surface solar irradiance data is expected to be useful for studies dealing with historical global dimming and brightening effects as well as with analyses of trends of extreme events (drought, heat waves). In addition, it is expected to be used for solar energy applications in amendment of data retrieved from geostationary satellites. Yet, please note that the mentioned applications are hampered by the data gaps over bright
15
surfaces. Here, the accuracy of the data has been evaluated to be systematically lower and has consequently been masked. However, the majority of the Earth’s surface is not affected by this limitation.
The temporal stability and homogeneity of the surface radiation data sets have not yet been fully evaluated. While all possible measures have been taken in the
gen-20
eration of these data sets, artificial shifts or trends in the final data sets cannot be excluded. Application of these data sets for the analysis of temporal changes/trend is recommended only after a careful evaluation of the temporal behaviour of these data sets.
The accuracy of the total surface radiation budget and the thermal cloud radiative
25
effect might exceed the accuracy requirements of users.
However, the central decision criteria for the question whether a data set is useful for an application or not is a transparent and extensive evaluation and documentation. This important issue is well covered by the discussed CLARA-A1 data set. All individual
ACPD
13, 935–982, 2013CLARA-A1: the CM SAF cloud, albedo and radiation dataset
K.-G. Karlsson et al.
Title Page
Abstract Introduction
Conclusions References
Tables Figures
◭ ◮
◭ ◮
Back Close
Full Screen / Esc
Printer-friendly Version Interactive Discussion
Discussion
P
a
per
|
Dis
cussion
P
a
per
|
Discussion
P
a
per
|
Discussio
n
P
a
per
components of the data set are well documented and validated Respective documen-tation comprises user manuals, validation reports and algorithm theoretical baseline documents (all documents available at www.cmsaf.eu). The extensive validation en-ables a good estimation of application uncertainties induced by the CLARA-A1 data sets.
5
Finally, we claim that over oceanic and sparsely populated areas satellite based data is still the main observational data source. Here, the CLARA-A1 data set definitely fills a gap of observational data for climate monitoring and analysis purposes.
7 Conclusions and future plans
This paper has described the CLARA-A1 dataset – a 28-yr cloud, surface albedo and
10
radiation budget dataset based on data from the AVHRR sensor on polar orbiting op-erational meteorological satellites. Its content, anticipated accuracies, limitations and potential applications have been described in some detail. However, the evaluation and validation of the products has been extensive and we intend to provide more details in subsequent papers.
15
The dataset has its strength in the long duration, its foundation upon a homogenized AVHRR radiance data record, and in some unique features compared to other avail-able datasets. For example, we would like to highlight the availability of 28 yr of polar summer surface albedo and cloudiness parameters. Quality characteristics are also well investigated and particularly useful results can be found over the tropics, mid- to
20
high-latitudes and over nearly all oceanic areas.
Being the first CM SAF dataset of this kind, some shortcomings and limitations have been identified, especially with regard to daytime cloud retrieval results over the sub-tropical land regions and also the polar winter results in the region closest to the poles. Also, retrievals over regions with high aerosol loading conditions are an issue in the
25
ACPD
13, 935–982, 2013CLARA-A1: the CM SAF cloud, albedo and radiation dataset
K.-G. Karlsson et al.
Title Page
Abstract Introduction
Conclusions References
Tables Figures
◭ ◮
◭ ◮
Back Close
Full Screen / Esc
Printer-friendly Version Interactive Discussion
Discussion
P
a
per
|
Dis
cussion
P
a
per
|
Discussion
P
a
per
|
Discussio
n
P
a
per
|
levels. For example, it will include extension of the dataset with data forward in time for years 2010–2015 and backward in time to 1978 (including data from the AVHRR/1 sensor starting with the Tiros-N satellite). The ultimate goal is that this, together with actions to harmonise results for night-time and daytime conditions and to correct for orbital drift effects, will eventually lead to capabilities of composing more trustworthy
5
results with a potential of describing real global and regional trends of the various derived parameters.
Acknowledgement. The authors want to thank Andrew Heidinger at NOAA/NESDIS Center for
Satellite Applications and Research, Madison, Wisconsin for providing the method for inter-calibrating historic AVHRR radiances and for encouraging the CM SAF project team to compile
10
AVHRR GAC-based climatologies.
This work is funded by EUMETSAT in cooperation with the national meteorological institutes of Germany, Sweden, Finland, the Netherlands, Belgium, Switzerland and United Kingdom.
References
Bekryaev, R. V., Polyakov, I. V., and Alexeev, V. A.: Role of polar amplification in long-term
15
surface air temperature variations and modern arctic warming, J. Climate, 23, 3888–3906, doi:10.1175/2010JCLI3297.1, 2010.
Claffey, K., Elder, B., and Bottenheim, J.: Exploring Arctic transpolar drift during dramatic sea ice retreat, EOS, 89, 21–28, 2008.
Coppo, P., Ricciarelli, B., Brandani, F., Delderfield, J, Ferlet, M., Mutlow, C., Munro, G.,
Nightin-20
gale, T., Smith, D., Bianchi, S., Nicol, P., Kirschstein, S., Hennig, T., Engel, W., Frerick, J., and Nieke, J.: SLSTR: a high accuracy dual scan temperature radiometer for sea and land surface monitoring from space, J. Mod. Opt., 57, 1815–1830, Special Issue: Advanced In-frared Technology and Applications. Selected papers from the 10th International Workshop, 8–11 September 2009.
25
Davis, G.: History of the NOAA satellite program, Appl. Remote Sens., 1, 012504, doi:10.1117/1.2642347, 2007.
De Haan, J. F., Bosma, P., and Hovenier, J. W.: The adding method for multiple scattering calculations of polarized light, Astron. Astrophys., 183, 371–391, 1987.
ACPD
13, 935–982, 2013CLARA-A1: the CM SAF cloud, albedo and radiation dataset
K.-G. Karlsson et al.
Title Page
Abstract Introduction
Conclusions References
Tables Figures
◭ ◮
◭ ◮
Back Close
Full Screen / Esc
Printer-friendly Version Interactive Discussion
Discussion
P
a
per
|
Dis
cussion
P
a
per
|
Discussion
P
a
per
|
Discussio
n
P
a
per
Dee, D. P., Uppala, S. M., Simmons, A. J., Berrisford, P., Poli, P., Kobayashi, S., Andrae, U., Balmaseda, M. A., Balsamo, G., Bauer, P., Bechtold, P., Beljaars, A. C. M., van de Berg, L., Bidlot, J., Bormann, N., Delsol, C., Dragani, R., Fuentes, M., Geer, A. J., Haimberger, L., Healy, S. B., Hersbach, H., H ´olm, E. V., Isaksen, L., K ˚allberg, P., K ¨ohler, M., Matricardi, M., McNally, A. P., Monge-Sanz, B. M., Morcrette, J.-J., Park, B.-K., Peubey, C., de
Ros-5
nay, P., Tavolato, C., Th ´epaut, J.-N., and Vitart, F.: The ERA-Interim reanalysis: configura-tion and performance of the data assimilaconfigura-tion system, Quarterly J. Roy. Meteorol. Soc., 137, doi:10.1002/qj.828, 553–597, 2011.
Derrien, M. and LeGleau, H.: Improvement of cloud detection near sunrise and sunset by temporal-differencing and region-growing techniques with real-time SEVIRI, Int. J. Remote
10
Sens., 31, 1765–1780, doi:10.1080/01431160902926632, 2010.
Dufresne, J.-L. and Bony, S.: An assessment of the primary sources of spread of global warming estimates from coupled atmosphere-ocean models, J. Climate, 21, 5135–5144, doi:10.1175/2008JCLI2239.1, 2008.
Dybbroe, A., Thoss, A., and Karlsson, K.-G.: NWCSAF AVHRR cloud detection and analysis
15
using dynamic thresholds and radiative transfer modelling – Part I: Algorithm description, J. Appl. Meteorol., 44, 39–54, 2005.
Eliasson, S., Buehler, S. A., Milz, M., Eriksson, P., and John, V. O.: Assessing observed and modelled spatial distributions of ice water path using satellite data, Atmos. Chem. Phys., 11, 375–391, doi:10.5194/acp-11-375-2011, 2011.
20
Flanner, M. G., Shell, K. M., Barlage, M., Perovich, D. K., and Tschudi, M. A.: Radiative forcing and albedo feedback from the Northern Hemisphere cryosphere between 1979 and 2008, Nat. Geosci., 4, 151–155, doi:10.1038/ngeo1062, 2011.
Foster, M. and Heidinger, A. K.: PATMOS-x: Results 1 from a diurnally-corrected thirty-year satellite cloud climatology, J. Climate, doi:10.1175/JCLI-D-11-00666.1, 2012.
25
Gascard, J.-C., Bruemmer, B., Offermann, M., Doble, M., Wadhams, P., Forsberg, R., Han-son, S., Skourup, H., Gerland, S., Nicolaus, M., Metaxian, J.-P., Grangeon, J., Haapala, J., Rinne, E., Haas, C., Heygster, G., Jakobson, E., Palo, T., Wilkinson, J., Kaleschke, L., Claf-fey, K., Elder, B., and Bottenheim, J.: Exploring arctic transpolar drift during dramatic sea ice retreat, EOS, 89, 21–28, 2008.
30