J. Evid. Based Med. Healthc., pISSN- 2349-2562, eISSN- 2349-2570/ Vol. 3/Issue 77/Sept. 26, 2016 Page 4165
OCULAR MORBIDITY PATTERNS AND ITS ASSOCIATION WITH SOCIO-ECONOMIC AND
SELECTIVE DEMOGRAPHIC VARIABLES OBSERVED IN STUDENTS OF GOVERNMENT
SCHOOLS AND MADRASAHS OF KOLKATA: A COMPARATIVE STUDY
Anindita Mondal1, Arnab Chatterjee2, Ujjal Pattanayak3, Sanjoy K. R. Sadhukhan4
1Associate Professor, Department of Ophthalmology, Calcutta Medical College, Kolkata, West Bengal.
2Consultant, Department of Ophthalmology, West Bengal Health Service, Cooch, Behar.
3Associate Professor, Department of Community Medicine, KPC Medical College, Jadavpur, Kolkata.
4Professor, Department of Ophthalmology, All India Institute of Public Health and Hygiene, Kolkata.
ABSTRACT INTRODUCTION: PURPOSE
To evaluate and compare the ocular morbidity status in students of Madrasahs and Govt. Schools of Kolkata.
SUBJECTS AND METHODS
An institution-based, cross-sectional observational study with comparison between two groups, sample size derived from a Delhi based similar study. Study population was formed by all students of class V-VIII of Madrasahs and Govt. Schools of Kolkata. Sample design was by simple random sampling using Program for Epidemiologist Version 4. Randomly selected students were examined according to specified format to evaluate the socio-economic status; a questionnaire was given to each student to be filled by their parents. Data was evaluated on MS-Excel 2007, PEPI Version 4, SPSS Version 17.
RESULTS
37.7% children with ocular morbidities were from Madrasahs, and 62.3% children with ocular morbidities were from Govt. Schools of Kolkata. BMI has no association with ocular morbidities. Refractive error was commonest ocular morbidity observed, 9.33% in Madrasah students and 18.15% in Govt. School students. Myopia was commonest refractive error observed. Low socioeconomic status meant significantly higher ocular morbidities, but reverse was not true.
CONCLUSIONS
Madrasah student has lesser ocular morbidity, refractive error was the commonest ocular morbidity, Myopia being the commonest. Higher socio-economic status does not mean lesser ocular morbidity.
KEYWORDS
Madrasah, Govt. Schools, Ocular Morbidity, Refractive Error, Socio-Economic Status.
HOW TO CITE THIS ARTICLE: Mondal A, Chatterjee A, Pattanayak U, et al.Ocular morbidity patterns and its association with socio-economic and selective demographic variables observed in students of Government schools and Madrasahs of Kolkata: a comparative study.J. Evid. Based Med. Healthc. 2016; 3(77), 4165-4170. DOI: 10.18410/jebmh/2016/889
INTRODUCTION: 30% of India’s blind lose their sight
before the age of 20 years,1 and 80% of the blindness is avoidable so the importance of early detection of ocular morbidity in young children is obvious. A study on ocular morbidity in school going and school age children is important, because while some eye conditions are just causes of visual impairment others invariably lead to blindness. Again conditions like refractive error, amblyopia and cataract are treatable, while others like measles and vitamin A deficiency are preventable.2 Refractive errors are the leading cause of visual impairment in school-going and school age children, reported in India and other developing
countries.3-8 Multiple studies have found a major burden of visual impairment in school age children of India due to uncorrected refractive error (2.63-7.4%).7-10 Relevant data on Kolkata, the capital of West Bengal is largely insufficient. Again, Madrasah children, belongs to the weaker and underprivileged section of our society, so it has been our endeavour to bring out an impression about the magnitude and pattern of ocular morbidity among Madrasah children of Kolkata and to find out different socio-demographic associates of ocular morbidity. It has also been our effort to portray a comparative picture of ocular morbidity status in children going to Government schools.
MATERIALS AND METHODS: This study has been conducted during School eye screening programs from Regional Institute of Ophthalmology (Kolkata).
Prior to this study Ethical Committee Clearance was taken from Medical College and Hospital (Kolkata), prior approval was taken from Education Dept. of West Bengal and from respective schools and Madrasah authorities. Financial or Other, Competing Interest: None.
Submission 01-09-2016, Peer Review 10-09-2016, Acceptance 22-09-2016, Published 24-09-2016. Corresponding Author:
Dr. Anindita Mondal,
Associate Professor, Calcutta Medical College, Kolkata, West Bengal.
J. Evid. Based Med. Healthc., pISSN- 2349-2562, eISSN- 2349-2570/ Vol. 3/Issue 77/Sept. 26, 2016 Page 4166
REFERENCE STUDY: Due to paucity of time, a pilot study could not be arranged. In spite of best of our effort, no study on Madrasah children was readily available to us. One study done by Kumar R et al11 on school children of Delhi, (a similar metro like Kolkata) is very near to our endeavour, and hence this study became our reference study. The required sample size of our study has been derived from the foresaid work.
Study Design: An institution-based, cross-sectional, observational study with comparison between two groups.
Study Setting: Government sponsored Madrasah and Govt. Schools of Kolkata (total 20 Madrasahs and 28 Schools).
Study Period: January 2013 to December 2014.
Study Subjects: Students of class V – VIII of Madrasah and Govt. Schools of Kolkata. Exclusion Criteria: (1) Any student who is absent during the day of examination. (2) Any student who falls sick or gets severely injured on the day of examination.
Study Population: All students of class V – VIII of Government Schools and Madrasahs of Kolkata (Total 14435 students, 10518 students of Govt. Schools and 3917 of Madrasah 2012 data as obtained from Education Dept. of Govt. of West Bengal).
Sample Size: Sample size (n) calculated by using the formula, 4PQ/L212 (Where P = prevalence of ocular morbidity, Q = 100 – P & L = allowable error. Confidence interval 95%).
Considering, P = 22.7%,11 and an allowable error of 10% of P, sample size became 1362. Keeping a 10% allowance for non–responders, the final sample size was (1362+136) = 1498 for each group.
Sample Design: Simple Random Sampling.13 All the students of Government Schools and Madrasah (class V – VIII) were enlisted serially comprising the study universe.
From this list 1498 students was selected by simple random sampling using statistical package PEPI (Program for Epidemiology Version 4.0).
During the study some students volunteered to take part in the study, they were included as well, leading to final sample size of 1649, for Madrasah students and 1504 for Govt. School students.
Data Collection and Examination: Post due consent from Madrasah/Govt. School authorities, students of class
V-VIII, were met in a friendly manner. Their history was taken and then they were serially examined according to results of simple random sampling as per foresaid questionnaire format.
Visual acuity for far vision was tested with Snellen’s chart, each eye was tested separately. All the students with less than 6/6 vision were examined by the refractionist. Students with less than 6/6 vision was noted down and through School/Madrasah authorities their parents were asked to bring their children to the referral centre at RIO (Kolkata). This was followed by objective refraction performed with retinoscope, which was followed by subjective refraction till the best corrected visual acuity was achieved. Cycloplegic refraction was done. Post cycloplegic test was done by referring the student at a specified date at RIO (Kolkata); if the student failed the specified date, then school authorities were contacted and alternative dates were given. Children already wearing spectacles were also examined and change in refractive error was noted. Cover/uncover test was done to detect tropia/phoria.
Ishihara’s Chart was used to detect anomalies of colour vision. In referred cases, anterior segment examination was done by slit lamp biomicroscopy and posterior segment by indirect ophthalmoscopy at RIO (Kolkata). Anthropometric measurements were taken by weighing machine and measuring tape accurate to nearest 100 grams and nearest 0.5 cm respectively.
Candidates were provided with a questionnaire to be filled in by their parents about their educational status, profession and approximate monthly income. Home visits were made whenever necessary to minimise errors.
Any student who after participating in the initial screening part and diagnosed of having ocular morbidity in either eye did not make himself/herself available for further evaluation, was termed as NONCOMPLIANT in the present study.
Data Management: Data thus collected were entered into MS-Excel 2007. Data were analysed by tabulation, proportion/percentage, mean, standard deviation, etc. Suitable statistical tests for significance were applied. Necessary help from statistical software was obtained, e.g., Program for Epidemiology (PEPI) Version 4, SPSS Version 17 (Statistical product and Service solution).
J. Evid. Based Med. Healthc., pISSN- 2349-2562, eISSN- 2349-2570/ Vol. 3/Issue 77/Sept. 26, 2016 Page 4167
Characteristics
Madrasah Govt. School
Significance P value (N=1649)
No. (%)
(N=1504) No. (%)
1. 1. Class
V 469(28.4) 326(21.7) <.01
VI 498(30.2) 394(26.2) <.01
VII 450(27.3) 387(25.7) 0.329
VIII 232(14.1) 397(26.4) <.01
2. Age (Yrs.)
Up to 10 270(16.4) 341(22.7) <.01
11 – 12 848(51.4) 706(46.9) <.05
> 12 531(32.2) 457(30.4) 0.267
Mean±S.D. Range
12.08±1.76 (7-20)
11.61±1.327 (8-14)
3. Sex Boys 589(35.7) 1153(76.7) <.01
Girls 1060(64.3) 351(23.3) <.01
4. Religion Muslim 1649 14 <.01
Non–Muslim 0 1490
5. Socio–Economic Class (Kuppuswamy’s Scale)
I & II 21(1.3) 516(34.3) <.01
III 127(7.7) 772(51.3) <.01
IV & V 1501(91.0) 216(14.4) <.01
6. Nutritional Status (Based on BMI)
Underweight 510(30.9) 162(10.8) <.01
Normal 1112(67.5) 936(62.2) <.01
Overweight 27(1.6) 406(27.0) <.01
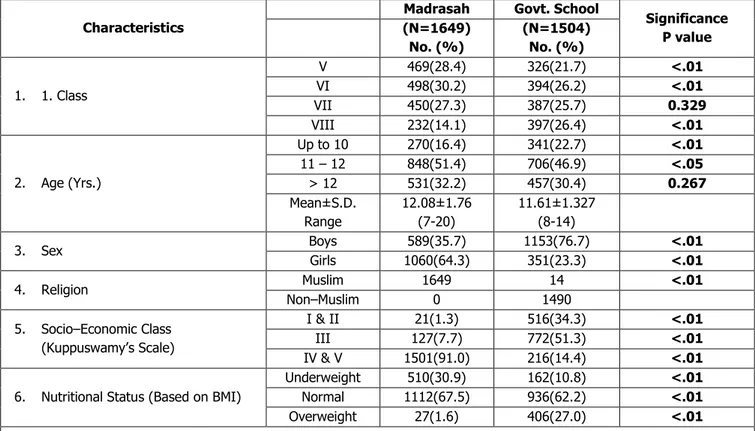
Table 1: Distribution of the Students According to their Demographic and Socio-Economic Characteristics
Table 1, elucidates, the background characteristics of the two groups in comparison.
There were significantly more students in class V and VI in Madrasah than Govt. Schools (P <.01), but in class VIII students in Madrasah were significantly less than their Govt. School counterparts, (P <.01). Both groups were divided into 3 age categories; in upto 10-year category Govt. School students were significantly more (P <.01); a reverse trend was noted in the 10-12 years category where Madrasah students were found to be significantly more (P <.05) in >12 year category. No statistically significant difference in either groups noted.
Boys were significantly higher in the Govt. School group and girls were significantly higher in Madrasahs. Out of 3153 total students screened, Muslim students were significantly more than non-Muslim students.
Govt. Schools had significantly higher number of students in upper socio-economic class (P <.01), Kuppuswamy’s socio-economic scale - 2012.
Madrasah children had significantly higher number of students in the underweight and normal BMI category. Govt. School students had significantly higher number of students in the overweight category.
Morbidity No. of Cases (%)
Refractive error 154 Cases (9.33)
Amblyopia 7 Cases (0.42)
Pterygium 2 Cases (0.12)
Squint 17 Cases (1.03)
Others* 6 Cases (0.36)
Incomplete evaluation 34 Cases (2.06)
Table 2A: Pattern of Ocular Morbidity in Madrasah (Multiple Response)
Others* (1 each of stye, synaeresis of vitreous, allergic conjunctivitis, colour blind, corneal opacity, chalazion).
Table 2A and 2B shows the spectrum of morbidities observed in Madrasah and Govt. Schools. Neither of these figures are mutually exclusive owing to presence of comorbidities. Myopia was the commonest refractive error in either groups.
Morbidity No. of Case (%)
Refractive error 273 Cases (18.15)
Amblyopia 12 Cases (0.79)
Squint 5 Cases (0.33)
Colour Blind 13 Cases (0.86) Corneal Opacity 2 Cases (0.13) Allergic Conjunctivitis 4 Cases (0.26) Incomplete Evaluation 44 Cases (2.92)
Table 2B:Pattern of Ocular Morbidity in Govt.
J. Evid. Based Med. Healthc., pISSN- 2349-2562, eISSN- 2349-2570/ Vol. 3/Issue 77/Sept. 26, 2016 Page 4168
Variables Total
Student
Students with
Morbidity (%) Significance (z/p)
1. Institution Madrasah 1649 193(11.7) Z=7.18 P <.01
Govt. School 1504 319(21.2)
2. Religion Muslim 1663 197(11.8) Z=7.03 P <.01
Non–Muslim 1490 315(21.1)
3. Class V (Madrasah) 469 56(11.9) Z=4.63 P <.01
(Govt. School) 326 81(24.8)
VI (Madrasah) 498 58(11.6) Z=3.97 P <.01
(Govt. School) 394 85(21.16)
VII (Madrasah) 450 38(8.4) Z=4.97 P <.01
(Govt. School) 387 78(20.2)
VIII (Madrasah) 232 41(17.7) Z=0.27 P = 0.789
(Govt. School) 397 75(18.9)
4. Sex Male (Madrasah) 589 59(10.01) Z=6.24 P <.01
(Govt. School) 1153 258(22.37)
Female (Madrasah) 1060 134(12.64) Z=2.14 P <.01
(Govt. School) 351 61(17.37)
5. Age Upto 10 yrs. (Madrasah) 270 23(8.51) Z=5.70 P <.01
(Govt. School) 341 95(27.8)
11 – 12 yrs. (Madrasah) 848 76(9.0) Z=6.63 P <.01
(Govt. School) 706 148(21.0)
> 12 yrs. (Madrasah) 531 94(17.7) Z=0.37 P = 0.710
(Govt. School) 457 76(16.6)
6. BMI Under Wt (Madrasah) 510 60(11.8) Z=0.00 P =1.000
(Govt. School) 162 19(11.7)
Normal Wt (Madrasah) 1112 129(11.6) Z=0.00 P=0.999
(Govt. School) 936 204(21.8)
Over Wt (Madrasah) 27 04(14.8) Z=0.82 P =0.415
(Govt. School) 406 96(23.6)
7. Socio –
Economic Status
Class I & II (Madrasah) (Govt. School)
21 03(14.28)
Z=1.67 P =.095
516 176(34.1)
Class III (Madrasah) 127 10(7.8) Z=2.52 P <.05
(Govt. School) 772 124(16.06)
Class IV & V (Madrasah) 1501 180(11.99) Z=1.22 P =0.223
(Govt. School) 216 19(8.79)
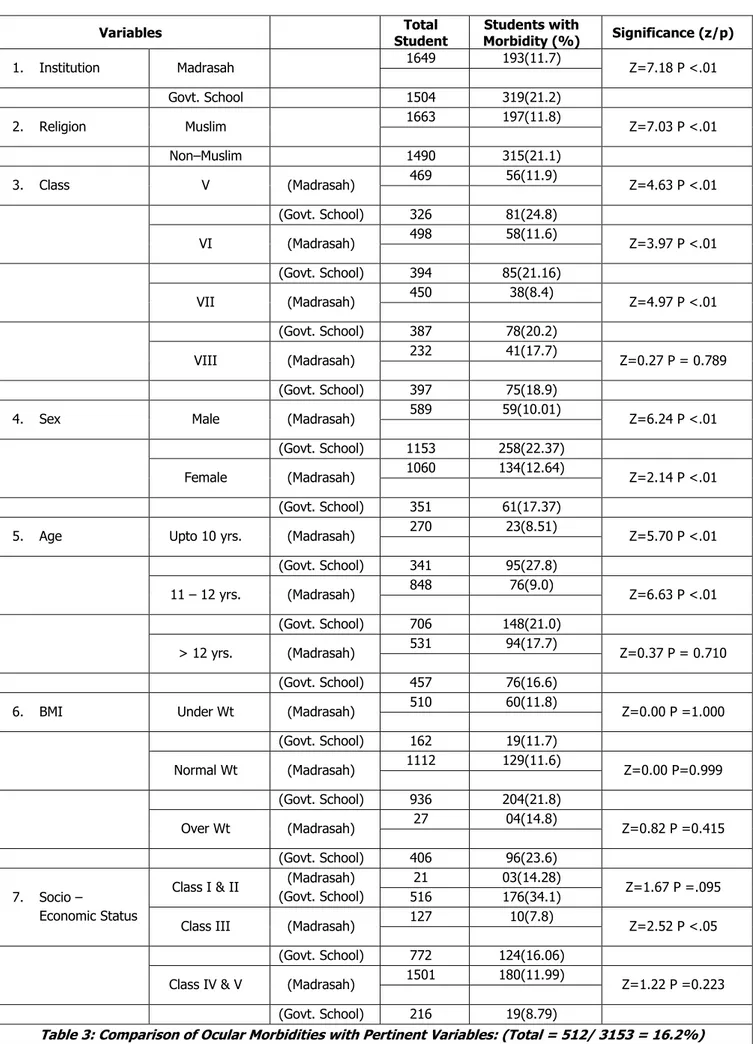
Table 3: Comparison of Ocular Morbidities with Pertinent Variables: (Total = 512/ 3153 = 16.2%)
J. Evid. Based Med. Healthc., pISSN- 2349-2562, eISSN- 2349-2570/ Vol. 3/Issue 77/Sept. 26, 2016 Page 4169 Male and female students of Govt. Schools have significantly higher ocular morbidity (P <.01) than their Madrasah counterparts. There was no significant difference in prevalence of ocular morbidity in class VIII students but class V, VI, VII shows significantly higher ocular morbidity in Govt. Schools. Only the middle Socioeconomic class (class 3) had significantly higher ocular morbidity in students of Govt. School than peer groups in Madrasah.
Variable Madrasah Govt. School
Total No. (%) Total No. (%)
1. Age:
Up to 10 270 23 341 95
11-12 848 76 706 148
>12 531 94 457 76
X2 df2 = 27.3, p <.01 X2 df2 = 14.8, p <.01
2. Sex: 589 59 1153 258
1060 134 351 61
X2 df1 = 2.5, p = 0.112 X2df1 = 4.02, p <.05
3. Class: V 469 56 326 81
VI 498 58 394 85
VII 450 38 387 78
VIII 232 41 397 75
X2 df3 = 12.6, p <.05 X2 df3 = 4.1, p = 0.246
4. Socio-Economic Class:
I & II 21 03 516 206
III 127 12 772 154
IV & V 1501 194 216 36
X2 df2 = 1.328, p = 0.515 X2 df2 = 42.398, p <.01
5. Nutritional Status (BMI):
Underweight 510 60 162 19
Normal 1112 129 936 204
Overweight 27 04 406 96
X2df2 = 0.266, p = 0.875 X2df2 = 75.756, p <.01
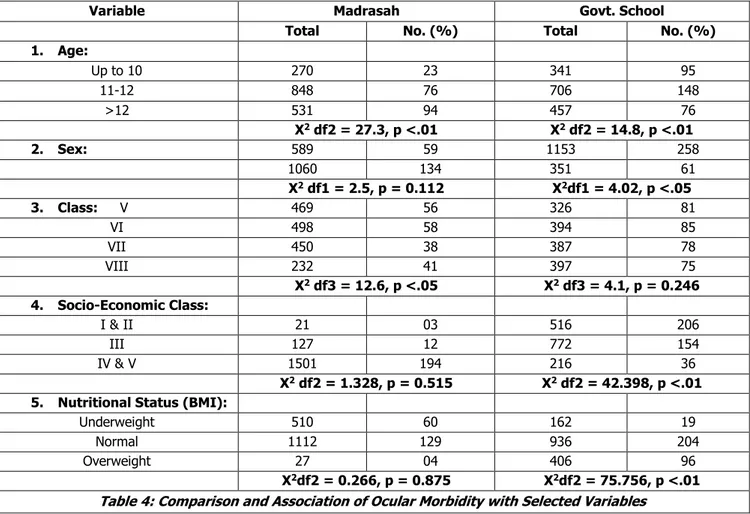
Table 4: Comparison and Association of Ocular Morbidity with Selected Variables
Table 4 shows a definite association of ocular morbidity only with increasing age in both the comparable groups.
DISCUSSION: The basis for this comparative study was, (1) Both form of education system are government run organisation, (2) As the admission process into the Government schools (non-Madrasahs) were based on lottery process, so there was an equal probability of representation from all the socio-economic tiers. So the chance of polarisation of higher socio-economic group students in case of Government schools was at least theoretically minimised. On field visit to the Schools and Madrasahs, it was revealed that background variables of the two comparable groups are not uniform, but it is also true when we are randomly examining so many students to get a uniformly identical background variable is difficult.
Due to paucity of data on ocular morbidity in context of Kolkata, other works on closely related metros were searched into; a Delhi-based study carried out by Kumar R et al11 is close to the present study, although their findings did not exactly match due to varied reasons. Kumar R et al11 found a total ocular morbidity of 22.7% in a sample size of 775, total ocular morbidity in present study is 16.2%, though a similar study conducted by Gupta M et al14 on school children of Shimla was 31.6%. Kamath BTP et al15 in the year 2012 on their study on school children of rural
Karnataka found a prevalence of 44.77%; in a similar study done in Uttarakhand Kishore S et al16 found a prevalence of ocular morbidity to be 20%, so it can be concluded that the prevalence of ocular morbidity varies with geographical territory and its demography.
Kumar R et al11 detected a prevalence of almost 40% ocular morbidity in the Muslim students of Delhi; in the present study it is 11.8%; this could be because of different study zones or it may be because of smaller sample of Muslim population in the reference study compared to the present study.
J. Evid. Based Med. Healthc., pISSN- 2349-2562, eISSN- 2349-2570/ Vol. 3/Issue 77/Sept. 26, 2016 Page 4170 results concluded by Das A et al18 and the present study,
Kolkata School Children has a higher prevalence of refractive error. Again, Alam H et al10 in their study on Urdu speaking children of Karachi found a prevalence of refractive error of 8.9%, which is very similar to the present study which is 9.33%.
In the present study, Myopia was the most common refractive error observed. This finding has been echoed by Das A et al18 in their study on students of Kolkata. Same results have been observed by K Bagchi et al.17
Amongst other ocular morbidities, squint, amblyopia and colour blindness were prominent. Overall prevalence of squint was 0.69% in students of Madrasah, the prevalence was 1.03% and in Govt. School children it is 0.33%. This is similar to the Hyderabad based study results of Kalkivayi et al,4 where prevalence of squint was 0.7%. A significant difference in the prevalence of squint in Madrasah and Govt. School students were observed (P <.01). No scientific study was readily available to compare this observation.
In the present study 18 cases of amblyopia were detected, an overall prevalence of 0.57%, prevalence in Madrasah students were 0.66% and 0.39% prevalence was observed in Govt. Schools. This is close to the observation made by K Bagchi et al,17 which was 0.10%. Although, study from states other than West Bengal reports a higher prevalence like Dandona R et al6 reported a prevalence of 12%, in school-aged children of Andhra Pradesh, Murthy G.V.S. et al5 reported a prevalence of 4.4% in urban school children of Delhi. In the present study, a significant difference has been observed in the prevalence of amblyopia in Madrasah and Govt. School children (P <.01). But again no scientific study relating to this finding was readily available.
Colour blindness in school children have been of varied prevalence, Gupta M et al14 reported a prevalence rate of 2.3% in school children of Shimla. Desai S et al1 in their study on school children of Jodhpur found a prevalence of 2.8%. Kumar R et al11 reported 1% prevalence in school children of Delhi. The present study however recorded 0.44% cases in all the 3153 students screened, only one case was recorded in Madrasah students and Govt. Schools recorded 13 cases (0.86%).
The general trend observed from the results shows that Madrasah students/Muslim students had significantly lesser amount of ocular morbidity. The exact reason for this could not be pin pointed. We also come to the conclusion that socio-economic status have no definite association with ocular morbidity (Table 6).
CONCLUSIONS: The present study attempted to throw some light on the ocular morbidity status of Madrasah students and present a comparative picture along with their Govt. School counterparts; non-Muslims had significantly higher ocular morbidity than Muslims. Refractive error was the main ocular morbidity observed in both the comparable groups. Govt. School students had significantly higher refractive error. Myopia was the commonest refractive error in both the groups. Higher socioeconomic status does not mean lower prevalence of ocular morbidity.
REFERENCES
1. Desai S, Desai R, Desai NC, et al. School eye health appraisal. Ind J Ophthal 1989;37(4):173-175. 2. Danish Assistance to the National Programme for
Control of Blindness. New Delhi, India: Vision screening in school children. Training module. 1. 3. Naidoo KS, Raghunandan A, Mashige KP, et al.
Refractive error and visual impairment in African children in South Africa. Invest Ophthalmol Vis Sci 2003;44(9):3764-3770.
4. Kalikivayi V, Nadurilath TJ, Bansal AK, et al. Visual impairment in school children in southern India. Indian J Ophthalmol 1997;45(2):129-134.
5. Murthy GVS, Gupta SK, Ellwein LB, et al. Refractive error in children in an urban population in New Delhi. Invest Ophthalmol Vis Sci 2002;43(3):623-631. 6. Dandon R, Danadon L, Srinivas M, et al. Refractive
error in children in a rural population in India. Invest Ophthalmol Vis Sci 2002;43(3):615-622.
7. Padhye AS, Khandekar R, Dharmadhikari S, et al. Prevalence of uncorrected refractive error and other eye problems among urban and rural school children. Middle East Afr J Ophthalmol 2009;16(2):69-74. 8. Chaturvedi S, Aggarwal OP. Pattern and distribution
of ocular morbidity in primary school children of rural Delhi. Asia Pac J Public Health 1999;11(1):30-33. 9. Nepal BP, Koirala S, Adhikari S, et al. Ocular morbidity
in school children in Kathmandu. Br J Ophthalmol 2003;87(5):531-534.
10. Alam H, Siddiqui MI, Jafri SI, et al. Prevalence of refractive error in school children of Karachi. J Pak Med Assoc 2008;58(6):322-325.
11. Kumar R, Pratibha D, Malti M, et al. Ocular morbidity amongst primary school children in Delhi. Health and Population- Perspective and Issues 2007;30(3):222-229.
12. Biswas R, Dasgupta S, Lahiri SK, et al. A Handbook on Biostatistics. Kolkata: IAPSM 2008:94-95.
13. Biswas R, Dasgupta S, Lahiri SK, et al. A Handbook on Biostatistics. Kolkata: IAPSM 2008:p. 37.
14. Gupta M, Gupta BP, Chauhan A, et al. Ocular morbidity prevalence among school children in Shimla, Himachal, North India. Indian J Ophthalmol 2009;57(2):133-138.
15. Kamath BTP, Prasad BSG, Deepthi R, et al. Prevalence of ocular morbidity among school going children (6-15 years) in rural area of Karnataka, South India. Int J Biomed Res 2012;3(4):209-212.
16. Kishore S, Aggrawal P, Muzzammil K, et al. Ophthalmic morbidity in school children in hilly areas of Uttarakhand. Indian Journal of Community Health 2014;26(1):56-60.
17. Bagchi K, Sarkar SN, Chattopadhyay T, et al. Vision screening program in school children- evaluation of the outcome in a selected urban locality. J Indian Med Assoc 2008;106(5):283-6,288.