FINANCIAL BALANCE AND LOANS OF THE SHAREHOLDERS TO THE
COMPANY
Burja Vasile
University "1 Decembrie 1918" Alba Iulia
Rus Luminiţa
University "1 Decembrie 1918" Alba Iulia
Financial balance in the activity of companies is a necessary condition for improving performance and competitiveness. Interpreting indicators expressing financial stability must be nuanced depending on concrete conditions. This paper presents a case study of influence of
companies’ loans from shareholders on company’s financial balance. The results of analysis
show that the mode of treatment in the accounts of these borrowings affects the financial balance of indicators. The conclusions of the analysis have theoretical and practical value, being useful to the managers, members, business partners and all shareholders, in taking the economic decisions.
Keywords: financial balance, loans from shareholders, working capital, necessary of working capital, net treasury
JEL Codes: M41, L29
1. Introduction
The ultimate objective of companies is to maximize the profit and the patrimonial value, which ensure appropriate remuneration of shareholders and strengthen their competitiveness on the market. This objective can be achieved only under conditions of financial balance which ensure appropriate funding sources, a sufficient level of liquidity to meet payment obligations and a continue solvency, which maintain the trust of business partners. Financial balance is appropriate if the providers of capital, the shareholders and the financial creditors are remunerated
proportional with the degree of risk taken (Charreaux).
Financial balance is a component of the economic balance in general and it is manifested by providing the necessary resources for financing the activity. The analysis of financial balance is founded on the principle that the long-term investment of companies should be financed from the resources that have a permanent character (Corhay and Mbangala, 2007). From this perspective the financial balance must be seen in dynamic under three aspects (Burja, 2009): long-term balance, which is the correlation between the permanent capital and fixed assets (working capital), current balance, by comparing current assets with short-term obligations (necessary of working capital), the short term balance, based on the correlation between the working capital and the necessary of working capital (treasury).
In the activity of companies often occur situations where they need immediate liquidity and economic practice shows that they are covered in most cases by the bank loans. In the case of limited liability companies (LLC), often the companies borrow from the own funds of shareholders. The advantage of this type of loan is linked to the reduction of time of getting the loan, to simplify operations and sometimes lower costs for company.
The present analyses, based on a case study show the influence on the financial balance of the loans from shareholders , taking into account the accounting treatment of loans. We do not know that the Romanian economic literature to be treated that aspect. That is why we consider the study as being useful to managers, members, shareholders, and all business partners to form the economic decisions.
2. Methodology
The purpose of this financial analysis is to examine critically the accounting and financial information ofered by the companies to assess their performance and their financial position (Laurence Le Gallo). The financial position of firms is assessed based on the financial structure and financial balance. In a same time the financial balance is approached from a static perspective based on the: net situation, working capital, necessary of working capital, net treasury. The information obtained in this way is complemented by the analysis of rates expressing financial balance. In a dynamic perspective, financial balance is analyzed on the basis of financial flows (Cohen, 1994). The present analyses deals with financial balance in a static manner based on these four indicators listed.
Net Situation reflect the wealth of the shareholders and must be sufficient to ensure the operation and financial independence of the company. This is important for the owners, shareholders and the creditors of the company (Petrescu 2008), showing net assets remaining after deducting all debt (Trebuchet, 1995). Shall be calculated starting from the fundamental equation of the financial statement sheet:
The Net Situation = Total assets-Debts (1)
The positive value of the indicator shown an efficient economic management in order to allow a proper financing of net assets. If a company has a negative value of this indicator there is a risk of bankruptcy because the real assets are exceeded by the debts contracted by, which generates the impossibility of paying debts.
Working Capital represents an excess of permanent capital over the value of assets, which may be used to finance the current activity (Peyrard, 1986). Viewed through the prism of the financial management, the working capital is a safety margin or security margin for the financing of current assets, the portion of the financial autonomy of the companies (
Popa
and Mester, 2006). This indicator shows the strengths and weaknesses of the investment policy of the companies because it can identify the risk of unredeemable short term liabilities and, indirectly, the risk of bankruptcy (Berheci 2010). Shall be calculated in two ways:Working Capital = Permanent capital – Fixed assets (2) Working capital = Current assets - Short term liabilities (3)
Existence of a positive working capital fund is an expression of the long-term financial balance, but the assessment of the situation must be done carefully because a huge working capital generates immediate possibilities for increasing production, but are neglected the investments which in the future may affect the competitiveness of the company. A negative working capital expresses a state of financial imbalance, which obliges the company to turn to short-term loans which can be expensive in the ratio of interest and can put the enterprise in difficulty due to the requirements for reimbursement in a very short time.
Having regard to the balance that must exist between the temporary needs and the sources for financing those needs there can be determined an indicator called the necessary of working capital. It shows money which must be run in the company in order to operate (Petrescu, 2008) and is calculatedas follows:
The necessary of working capital =(Current assets – Disposable Funds)
-(Short term Liabilities – Short Term Loans) = (4) = (Stocks + Receivables + Prepaid Expenses) –
If the necessary of working capital has positive value there is a surplus of temporary needs (current assets) to the temporary sources that can be deployed. This situation can be considered normal if it is the result of investments in stocks due to enhance of production, the increase in duration of manufacturing cycle or sales growth and also of commercial debt. When there is a gap between current assets liquidity and the liabilities’ due date, then the situation is unfavorable. The existence of a negative necessary of working capital reflects temporary needs, with lesser value then temporary funding sources. The situation may be bad, if it is a result of accidental interruptions in supply and renewal of stocks or in production or the receipts have been speeded up and the payment of debts have been relaxed.
The net treasury reflects faithfully the financial balance of companies by comparing the working capital with the necessary of working capital. This indicator shows the current evolution of receipts and payments and can be calculated as follows:
Net Treasury = Working Capital – The Necessary of Working Capital (5) Net Treasury = Disposable Funds – Treasury Credits (6)
If the treasury is positive the situation is favorable to business, with some short-term financial autonomy. A negative treasury (cash-flow) appears if there is a need for excessive working capital or there is a structural crisis if the working capital is insufficient.
Fluctuations recorded by the net treasury at the end of two financial years may be determined by the net flow of money based on the indicator "cash-flow" (CF) of the interval of time mentioned (Burja, 2009).
The money that the companies borrowed from the business associates (shareholders) affects the value of the indicators that characterize the financial balance. They can be short-term or long-term liabilities, and even if the loan agreement specifies a long-term of repayment of the loan, if the company still has a financial difficulties then the loan is not repaid, or the shareholders granted a new loan immediately. As such short-term loans became long-term loans.
This document analyzed the indicators of financial balance in two hypotheses: the first treats the loans granted by the associates to the firms as short-term debt; the second hypothesis sees these loans as long-term debt.
3. Results and discussion
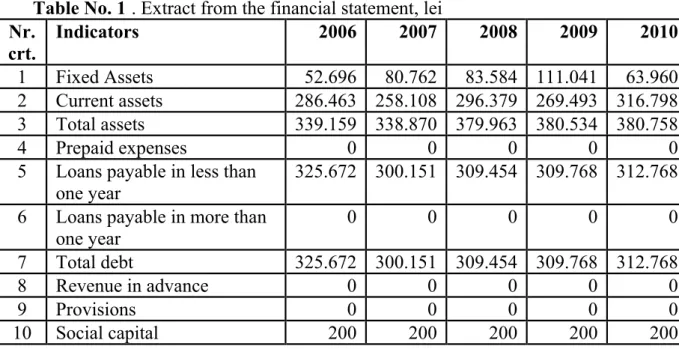
The sources of data for the analysis of financial balance are offered mainly in the financial statement. This document has been used data from a company that is engaged in the carriage of goods. Analysis was made over a period of five years on the basis of the data in the table 1.
Table No. 1 . Extract from the financial statement, lei Nr.
crt.
Indicators 2006 2007 2008 2009 2010
1 Fixed Assets 52.696 80.762 83.584 111.041 63.960
2 Current assets 286.463 258.108 296.379 269.493 316.798
3 Total assets 339.159 338.870 379.963 380.534 380.758
4 Prepaid expenses 0 0 0 0 0
5 Loans payable in less than one year
325.672 300.151 309.454 309.768 312.768
6 Loans payable in more than one year
0 0 0 0 0
7 Total debt 325.672 300.151 309.454 309.768 312.768
8 Revenue in advance 0 0 0 0 0
9 Provisions 0 0 0 0 0
Nr. crt.
Indicators 2006 2007 2008 2009 2010
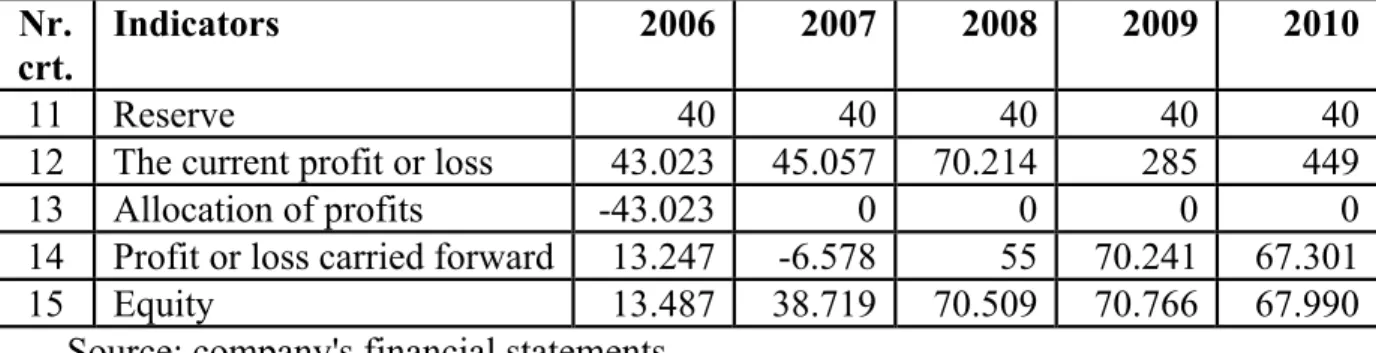
11 Reserve 40 40 40 40 40
12 The current profit or loss 43.023 45.057 70.214 285 449
13 Allocation of profits -43.023 0 0 0 0
14 Profit or loss carried forward 13.247 -6.578 55 70.241 67.301
15 Equity 13.487 38.719 70.509 70.766 67.990
Source: company's financial statements
Using the formulas for the calculation of the indicators characterizing the financial balance of the company it had been obtained the results presented in table no. 2.
Table No. 2. Indicators of financial balance, lei
No. Indicators 2006 2007 2008 2009 2010
1 Net situation 13.487 38.719 70.509 70.766 67.990
2 Working capital - 39.209 - 42.043 -13.075 -40.275 4.030
3 Necessary of working capital -59.068 -64.931 -90.601 -48.177 -50.855
4 Net treasury 19.859 22.888 77.526 7.902 54.885
Source: Calculated data
The analysis of financial balance based on the indicators in table 2 and the data of the financial statement reflects the following aspects.
At the company analyzed there is
a trend of growth of the net situation during the first four
years, very strong in 2007 and 2008 and a slight decrease in 2010. Flaunting the fact that
the company has not registered in those five years nor any provisions nor revenue in
advance, the net situation was equal to net equity throughout the whole analysis period.
The evolution of net situation was due mainly to the profit realized because since 2007
the company has not distributed its profits and the social capital and the reserves are
maintained at the minimum limit prescribed by law. The net situation of company
reflects the overview of the evolution of the Romanian economy during that period.
The financial working capital of company analyzed during the first four years has
negative value, and in fifth year recorded a positive value. These results reflect a state of
financial imbalance, because current assets
that can be converted to cash, are not sufficient
to cover the obligations of the company in the short term.
It is necessary in this case a detailed analysisof the current assets and the short-term liabilities which could bring a
further understanding of the situation of society. Necessary additional data analysis can
be found in table 3.
Table No. 3. Receivables and Payables, lei
Nr.Crt. Indicators 2006 2007 2008 2009 2010
1 Receivables, showing separately: 265.307 234.228 217.743 260.599 259.787
2 Clients 213.088 186.126 160.945 192.454 205.887
3 The percentage of total clients in
receivables,% 80,32 79,46 73,92 73,85 79,25
Nr.Crt. Indicators 2006 2007 2008 2009 2010 separately:
5 Vendors 54.142 55.393 37.636 70.785 60.032
6 Associates - current accounts 221.490 229.894 229.709 204.030 218.109 7 Percentage of vendors in short term
liabilities,% 16,62 18,46 12,16 22,85 19,19
8 The percentage of loans from shareholders
in the short term liabilities%
68,01 76,59 74,23 65,87 69,74
Source: calculated data
If you analyze the working capital of permanent needs which must be covered from the permanent resources, the fact that working capital is negative, reflects the coverage of these needs from temporary resources, what obliges the company to turn to loans.
The necessary of working capital has recorded negative values throughout the five years analyzed what signifies a temporary surplus of sources. This situation may be favorable if there were a speed up of revenue and a relaxation of payment of debts, with an employment of debt with longer maturities. The situation is unfavorable if there are interruptions in the supply of inventory or reduction of receivables as a result of the reduction of activity and not as a result of the recovery of receivables.
During the period analyzed, the net treasury has been positive in all the years, a situation favorable to the company ensuring that short-term financial autonomy. What remains to be managed is the use of surplus of cash as efficiently as possible, because there is the possibility of making placements on the financial and monetary markets. However, on the long-term the maintenance of a positive treasury may be a sign of ineffective use of stable resources with any negative effects on the repayment of loans and the remuneration of the capital. The company has strong treasury variations, which can be determined by the net monetary flow of each fiscal year. We observe in table 3 data, that the firm analyzed turned to loans from associates throughout the whole period analyzed. Their value is approximately constant, what show in fact that short-term loans were converted into long-term loans. Consideration of loans from associates as long-term loans alters the indicators of financial balance, which as a result of the new calculations are presented in table 4.
Table 4. The indicators of financial balance recalculated Nr.
Crt.
Indicators 2006 2007 2008 2009 2010
1 Net situation 13.487 38.719 70.509 70.766 67.990
2
Working capital
182.281 187.851 216.634 163.755 222.139 3 Necessary of working capital 162.422 164.963 139.108 155.853 167.2544 Net treasury 19.859 22.888 77.526 7.902 54.885
Source: calculated data
We observe in table 4 that the working capital and the necessary of working capital were positive throughout the whole period of analysis. It is necessary reinterpretation of financial balance in this situation.
The necessary of working capital being positive, the situation may be interpreted as normal, if it is the result of the growth of stocks in order to align with the needs of production; otherwise it is a situation unfavorable in terms of financial balance and is caused by the gap between the liquidity of assets and the retention of debts. Be reviewed contracts with customers and vendors for the renegotiation of the terms of payment.
The net situation and net treasury situation had not been influenced by the treatment of shareholders loans to the company.
4. Conclusions
The present analysis showed that financial balance is influenced by the way that the shareholders loans to the company are treated by including them in long-term debt or short-term. At the company analyzed the situation of the financial balance in the assumption of considering the loans from associates as long-term loans showed the existence of financial imbalance, illustrated by a negative working capital during the first four years of the analysis. Reprocessing of loans and their inclusion in long-term debt, changes the perspective on financial balance showing that on the long-term company has a stable balance.
These aspects require preparation of loan agreements with associates as loans work in reality. The contracts must to highlight the progress of the loan on the long term and not to be extended or remodeled the short-term contracts.
Of course, there are always solutions to improve the financial balance and in this way the financial position and the performance of the company. However, the proposed solutions must be based on a proper perspective on the financial balance offered by the suitable treatment of the raw data.
References:
1. The Berheci Maria, The capitalizing of financial reporting. Accounting summary: theory, analysis, case studies, Bucharest, Publishing CECCAR, 2010
2. Burja, Camelia. Economic and Financial Analysis. Methodological and practical applications, Publishing House Book of Science, Cluj-Napoca, Romania, 2009
3. Charreaux, Gérard. "L ' analyse financière". http://gerard.charreaux.pagesperso-orange.fr/perso/articles/ANAFI87.pdf Accesed April 3rd, 2012.
4. Cohen, Elie.Analyse financièree , 3 Edition, ed., Economica, Paris, 1994.
5. Corhay, Albert and Mbangala, Mapapa. Fondements de gestion financière-Manuel et Applications. Editions de l'Universitéde Liège, 2007.
6. Le Gallo, Laurence. Analyse financière. http://www.controleur-de-gestion.fr/cariboost_files/cours_20bases_20finance.pdf. Accesed April 3rd, 2012.
7. Peyrard, Josette. Analyse financiere. Gestion Vuibert, Paris, 1996.
8. Popa (Lezeu) Dorina, Mester Cornelia, Economic Financial Analysis: theoretical aspects and practical applications, Oradea, Timişoara, Oradea University, 2006.
9. Petrescu Silvia, Analysis and diagnosis in the financial accounting. Theoretical and applicative Guide, 2nd Edition, revised and reissued, Publishing CECCAR, Bucharest, 2008.
10. Trébuchet, Jean Louis. Outils de gestion commerciale. Collection Etapes, Nathan, Paris, 1995.