ACPD
8, 2337–2357, 2008HCHO measurements during CHABLIS in
coastal Antarctica
R. A. Salmon et al.
Title Page
Abstract Introduction
Conclusions References
Tables Figures
◭ ◮
◭ ◮
Back Close
Full Screen / Esc
Printer-friendly Version
Interactive Discussion Atmos. Chem. Phys. Discuss., 8, 2337–2357, 2008
www.atmos-chem-phys-discuss.net/8/2337/2008/ © Author(s) 2008. This work is distributed under the Creative Commons Attribution 3.0 License.
Atmospheric Chemistry and Physics Discussions
Measurement and interpretation of gas
phase formaldehyde concentrations
obtained during the CHABLIS campaign
in coastal Antarctica
R. A. Salmon1, S. J.-B. Bauguitte1, W. Bloss2, M. A. Hutterli1, A. E. Jones1, K. Read3, and E. W. Wolff1
1
British Antarctic Survey, High Cross, Madingley Road, Cambridge, CB3 0ET, UK
2
School of Geography, Earth & Environmental Sciences, University of Birmingham Edgbaston, Birmingham, B15 2TT, UK
3
Department of Chemistry, University of York, Heslington, York YO19 4RR, UK
Received: 10 December 2007 – Accepted: 20 December 2007 – Published: 8 February 2008 Correspondence to: R. A. Salmon ([email protected])
ACPD
8, 2337–2357, 2008HCHO measurements during CHABLIS in
coastal Antarctica
R. A. Salmon et al.
Title Page
Abstract Introduction
Conclusions References
Tables Figures
◭ ◮
◭ ◮
Back Close
Full Screen / Esc
Printer-friendly Version
Interactive Discussion
Abstract
Gas phase formaldehyde concentrations were measured during the 2004-5 CHABLIS campaign at Halley research station, Antarctica. Data coverage span from March 2004 through to January 2005 thus capturing the majority of the year. Factors controlling HCHO concentration include local chemical sources and sinks, and exchange with the
5
snow surface. The measured seasonality is in line with previous observations from Neumayer station, with maximum in summer and minimum during the winter months, but with lower absolute concentrations throughout the year. Steady state calculations show oxidation of methane to be the overwhelming source of formaldehyde during the summer, with destruction dominated by photolysis and reaction with Br atoms.
10
1 Introduction
Formaldehyde (HCHO) is an intermediate species formed during the photochemical oxidation of atmospheric hydrocarbons by hydroxyl radicals. Its formation and destruc-tion is closely linked to odd-hydrogen (HOx=HO2+OH) chemistry and, by definition, to
the oxidising capacity of the troposphere.
15
Formaldehyde is an impurity held within precipitated snow and ice, and with its link to boundary layer oxidation processes, it was for many years hoped that an analysis of formaldehyde in ice cores would yield information on how the oxidation capacity of the atmosphere, and specifically OH concentrations, has changed through time (Staff el-bach et al., 1991). However, studies of HCHO in polar regions have shown that there
20
are significant post-depositional processes that need to be considered. Formaldehyde is both lost from the snowpack through physical processes (e.g. Hutterli et al., 1999; Couch et al., 2000; Burkhart et al., 2002; Hutterli et al., 2002; Hutterli et al., 2003) and also generated within and then released from the snowpack through photochemi-cal processes (e.g. Sumner and Shepson, 1999; Sumner et al., 2002; Grannas et al.,
25
ACPD
8, 2337–2357, 2008HCHO measurements during CHABLIS in
coastal Antarctica
R. A. Salmon et al.
Title Page
Abstract Introduction
Conclusions References
Tables Figures
◭ ◮
◭ ◮
Back Close
Full Screen / Esc
Printer-friendly Version
Interactive Discussion the straight forward ice core proxy for changing oxidative capacity that was originally
thought, and secondly, the snowpack in polar regions is a major source of formalde-hyde to the troposphere.
There have been several studies of formaldehyde concentrations in the Arctic ini-tially directed at understanding its role in background tropospheric chemistry (e.g. De
5
Serves, 1994; Shepson et al., 1996), and latterly to assess its contribution, via the snowpack, as a source of HOx (e.g. Sumner and Shepson, 1999; Sumner et al., 2002; Hutterli et al., 2001; Chen et al., 2007; Sjostedt et al., 2007, Jacobi et al., 2002, Yang et al., 2002). Photolysis of HCHO is not the only high latitude OH source; snowpack emissions of H2O2(Hutterli et al., 2001; Chen et al., 2004; Hutterli et al., 2004; Chen et
10
al., 2007) and HONO (Zhou et al., 2001; Yang et al., 2002; Beine et al., 2006) are also expected to enhance OH levels, and photolysis of O3is the primary gas-phase source.
The relative contribution from HCHO has been found to vary at different sites and also from season to season. For example, during early spring at Summit, Greenland, emissions of HCHO and H2O2from the snow were the dominant source of OH to the
15
boundary layer (Sjostedt et al., 2005); during the summer, photolysis of O3 became
more important and, together with snow-emitted H2O2, provided the most important route for HOx formation (Chen et al., 2007).
Snowpack emissions of HCHO have also been assessed at various locations across Antarctica including South Pole (Hutterli et al., 2002; Chen et al., 2004; Hutterli et al.,
20
2004), Dome Concordia (Hutterli et al., 2002), as well as on the ITASE traverse across the West Antarctic Ice Sheet between 76◦S and 90◦S (Frey et al., 2005). As in the Arctic, the role played by HCHO is significant; for example at South Pole, data from the 2000 summer measurement programme showed that emissions of H2O2 and HCHO
were the dominant HOx source (Chen et al., 2004).These studies were restricted to the
25
ACPD
8, 2337–2357, 2008HCHO measurements during CHABLIS in
coastal Antarctica
R. A. Salmon et al.
Title Page
Abstract Introduction
Conclusions References
Tables Figures
◭ ◮
◭ ◮
Back Close
Full Screen / Esc
Printer-friendly Version
Interactive Discussion magnitude and seasonality of this important radical precursor. The results showed a
summer maximum in HCHO (albeit with significant short-term variability) and a winter-time minimum; the range in mixing ratios was roughly 0.1 parts per billion by volume (ppbv) to 0.5 ppbv over the course of the year. The field measurements were followed up by a modelling assessment to deduce the source and sink contributions to ambient
5
HCHO (Riedel et al., 2005), but there were some difficulties reconciling the observa-tions with model calculaobserva-tions.
The measurements presented here were carried out as part of the Chemistry of the Antarctic Troposphere and the Interface with Snow (CHABLIS) campaign that ran at the British Antarctic Survey station, Halley (75◦ 35′S, 26◦ 39′W), in the Weddell Sea
10
sector of coastal Antarctica from January 2004 to February 2005 (Jones et al., 20081). The campaign aimed to measure a wide range of trace gases and for an extended period of time, to assess changes in chemical composition on seasonal timescales. Of relevance here is that the observation suite included measurements of non-methane hydrocarbons (NMHCs), surface O3, NO, NO2, and OH/HO2 (the latter during
sum-15
mertime only). A full description of the site location and campaign details are provided elsewhere (Jones et al., 20081).
2 Experimental
The formaldehyde measurements were made in-situ at the Clean Air Sector Labora-tory (CASLab), the Halley atmospheric chemistry laboraLabora-tory. The CASLab is located
20
1 km away from station generators in a sector that receives minimal contamination from the main base. Contamination episodes were monitored using both a Conden-sation Particle Counter (CPC) and an Aethalometer (which measures black carbon).
1
ACPD
8, 2337–2357, 2008HCHO measurements during CHABLIS in
coastal Antarctica
R. A. Salmon et al.
Title Page
Abstract Introduction
Conclusions References
Tables Figures
◭ ◮
◭ ◮
Back Close
Full Screen / Esc
Printer-friendly Version
Interactive Discussion Formaldehyde data points were removed whenever a local contamination source was
evident.
The formaldehyde measurements were made using an Aerolaser 4021 Analyser which has a stated detection limit of<50 parts per trillion by volume (pptv). It is there-fore ideally suited for Antarctic work where boundary layer mixing ratios of HCHO are
5
likely to be low. Ambient air was sampled continuously via a 1.8 m long,1/4” o.d. PFA
Teflon inlet line which was attached to the main trace-gas manifold in the CASLab (for details see Jones et al., 20071). Data were recorded every 30 seconds. The instrumen-tal detection limit was estimated as twice the 2-sigma standard error of 10 min means. It varied from 0.01 to 0.06 ppbv throughout the year due to changes in operational
pa-10
rameters and auto-tuning adjustments by the instrument. The accuracy, determined by calibration factors discussed below, was 15%.
The continuous measurement technique used has been described in detail else-where (Dong and Dasgupta, 1987; Dasgupta et al., 1988; Riedel et al., 1999). Gaseous formaldehyde is scrubbed into the liquid phase via a stripping coil containing dilute
sul-15
phuric acid. This is followed by reaction with Hantzsch reagent, a dilute solution made with acetyl acetone, acetic acid, and ammonium acetate. Aqueous-phase formalde-hyde reacts with this reagent via the “Hantzsch Reaction” to produce 3,5-diacetyl-1,4-dihydrolutidine (DDL). Once excited by an appropriate wavelength, DLL fluoresces thus allowing quantitative assay by monitoring the emitted light. In our system, excitation
20
was achieved using the 400 nm line from an Hg lamp, and emission was monitored at 510 nm.
During the campaign, gaseous HCHO was stripped from a 1 L/min (STP) air flow by dilute sulphuric acid flowing at 0.2–0.3 ml/min. The air flow was calibrated and controlled with a mass flow controller, and liquid flow was measured routinely. The
25
ACPD
8, 2337–2357, 2008HCHO measurements during CHABLIS in
coastal Antarctica
R. A. Salmon et al.
Title Page
Abstract Introduction
Conclusions References
Tables Figures
◭ ◮
◭ ◮
Back Close
Full Screen / Esc
Printer-friendly Version
Interactive Discussion In order to correctly derive HCHO mixing ratios, it is critical to accurately know the
emission rate from the internal wafer. In order to do this, work was carried out in the UK after the Antarctic measurement campaign to determine the emission rate. This was done using two different methods: (a) gas phase calibration, (b) liquid phase calibration
+collection efficiency experiments.
5
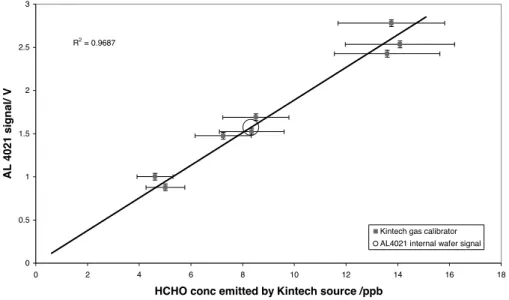
Method a): The gas phase calibration method used a Kintech Model 491-M HCHO
gas calibrator to supply a known concentration of HCHO in air. A range of concentra-tions from the Kintech source were passed into the AL4021, via the same inlet tube as was used in the field, and the signals compared with that from the AL4021 internal gas source, as shown in Fig. 1. This method accounts for gas phase losses in the system,
10
and determined an emission rate from the internal wafer of 10.43 ng/min±15% (Fig. 1).
Method b): The liquid technique involved comparing the internal wafer calibration
pulse with a calibration curve determined from liquid standards and yielded an emis-sion rate from the internal wafer of 8.507 ng/min ±12%. However, this method does not account for losses in collection or gas scrubbing (i.e. the collection efficiency)
15
so this value is known to be an underestimate. In order to provide a correction fac-tor, collection efficiency experiments were conducted. Calibration gas from the inter-nal wafer was passed through four bubblers in series, each containing MilliQ water (18 M Ohm/cm) and then directed into the AL4021 to monitor any residual signal. After about 50 minutes, the contents of each bubbler were analyzed for dissolved HCHO
20
using the AL4021 Analyser in liquid measurement mode. The collection efficiency was determined by comparing the total HCHO collected in the bubblers over a specific time period with that measured by the instrument with no bubblers. The collection efficiency derived experimentally in this fashion was 0.85±0.04. We note that this value com-pares well with the collection efficiency calculated by comparing the emission rate
de-25
rived from the bubbler method with that from the Kintech method (collection efficiency
there-ACPD
8, 2337–2357, 2008HCHO measurements during CHABLIS in
coastal Antarctica
R. A. Salmon et al.
Title Page
Abstract Introduction
Conclusions References
Tables Figures
◭ ◮
◭ ◮
Back Close
Full Screen / Esc
Printer-friendly Version
Interactive Discussion fore equals 10.0±1.67 ng/min. It was decided to use this value, from method (b), for
determination of gas phase concentrations due to the improved precision as compared to method (a).
In order to correctly derive measurements from the HCHO analyzer it is essen-tial to characterize and understand the instrument operation parameters. The results
5
from this study gives considerable reassurance that the calibrations used to derive the HCHO data presented here are robust.
3 Results and discussion
Results from the year-round measurement are shown in Fig. 2. During the austral win-ter, when there was no direct sunlight and little local chemistry occurring, the HCHO
10
concentrations remained close to, or below, the instrumental detection limit. Con-centrations increased during spring and reached a maximum in the austral summer when there was continual sunlight and very active local photochemistry (e.g. Bloss et al., 2007). Summer concentrations (November–February), remained between 50– 200 pptv. The seasonality of the Halley data is therefore the same as the earlier
mea-15
surements made at Neumayer, but the magnitudes recorded are significantly different. Indeed the Neumayer measurements are approximately three to four times higher than the Halley data set.
There are no obvious differences between the two study sites; Halley and Neumayer are both coastal stations in the Weddell Sea Sector of Antarctica. They are
there-20
fore both exposed to a mix of continental and maritime air and have similar seasonal range of temperatures (K ¨onig-Langlo et al., 1998). A potential source for the diff er-ences lies in the analytical approaches adopted. While the instruments used to obtain the data were almost identical (the Neumayer study used an Aerolaser AL4001, an earlier version of the Aerolaser AL4021 employed at Halley), the calibration methods
25
ACPD
8, 2337–2357, 2008HCHO measurements during CHABLIS in
coastal Antarctica
R. A. Salmon et al.
Title Page
Abstract Introduction
Conclusions References
Tables Figures
◭ ◮
◭ ◮
Back Close
Full Screen / Esc
Printer-friendly Version
Interactive Discussion air to ensure a consistent monitoring of the baseline. The instrument at Neumayer,
however, was calibrated during the campaign by using a liquid standard to which the gas calibrant was compared. Although this method was also employed during the CHABLIS campaign at Halley, post-analysis of the data suggested that the variability of the internal calibrations of the liquid standard was greater than the variation of the
5
gas signal itself. This was partially due to instrumental auto-calibration parameters that changed sensitivity following calibrations. In addition (and as outlined above), this method did not account for internal losses of gas phase HCHO prior to the Hantzsch reaction used for quantification. The Halley data were therefore calibrated assuming a constant gas permeation rate throughout the campaign. The permeation rate used was
10
shown to be within the error both prior to, and following, the campaign. Furthermore, the Neumayer data were derived assuming a collection efficiency of 99.9% based on the manufacturers specifications. The analysis presented here shows that the Halley instrument had a lower collection efficiency, and that data derived from liquid calibra-tions required an additional correction factor to be applied. Unaccounted losses during
15
sampling and scrubbing would however not explain the higher measurements from the Neumayer data set. The difference between these data sets is unresolved and cannot be explained by instrumental differences alone.
In a follow-up modelling study, Riedel et al. (2005) explored the sources of HCHO that could contribute to their observed values. In addition to standard gas phase chemistry,
20
they considered the contribution from isoprene, ethene, propene, dimethyl sulphide (DMS), as well as the role from halogens (with Cl+CH4 as a source, and sinks from
Br+HCHO and BrO+HCHO). They also looked to emission fluxes from the snowpack as a means of reconciling their measurements. The model studies were carried out for the month of November, the monthly maximum in their annual observations. Their
25
ACPD
8, 2337–2357, 2008HCHO measurements during CHABLIS in
coastal Antarctica
R. A. Salmon et al.
Title Page
Abstract Introduction
Conclusions References
Tables Figures
◭ ◮
◭ ◮
Back Close
Full Screen / Esc
Printer-friendly Version
Interactive Discussion ethene at 45 or 25 pptv. They concluded that, even using the higher NMHC loading,
gas phase production could account for a maximum of 37% of the observed HCHO; the flux from the snowpack required to fill the gap, assuming a boundary layer height of 41.5 m, was 1.9×10¹³ molecs m−2 s−1. For the lower NMHC scenario, the snowpack source required to account for observed HCHO increased to 2.5×10¹³molecs m−2s−1.
5
Methane oxidation contributed between 9 and 14.8% to the observed HCHO.
A significant advantage of the CHABLIS campaign is that it included simultaneous measurements of a wide range of trace gases. These can be used in numerical as-sessments to constrain the calculations to observed values. Here we present steady state calculations that use concurrent measurements as input, and explore the sources
10
and sinks of HCHO at Halley.
4 Steady state source and sink calculations
The HCHO levels observed in the Antarctic boundary layer at Halley result from a com-bination of in situ photochemical production and loss, effects of the snowpack (which can be a source or a sink for carbonyl species), and production / loss due to mixing of
15
overlying air from the free troposphere. The suite of observations obtained during the CHABLIS project allow the in situ contributions to HCHO to be constrained, which to-gether with the HCHO observations permit the net external flux (snowpack plus mixing) to be obtained.
The measurements required for these calculations, notably observations of HOx,
20
were available during the (austral) summer 2005 measurement period, corresponding to 3 January–10 February 2005; the following calculations refer to this period of the campaign.
Formaldehyde production results primarily from the OH-initiated degradation of hy-drocarbons. NMHC were measured during CHABLIS via GC-FID (Read et al., 2007),
25
ACPD
8, 2337–2357, 2008HCHO measurements during CHABLIS in
coastal Antarctica
R. A. Salmon et al.
Title Page
Abstract Introduction
Conclusions References
Tables Figures
◭ ◮
◭ ◮
Back Close
Full Screen / Esc
Printer-friendly Version
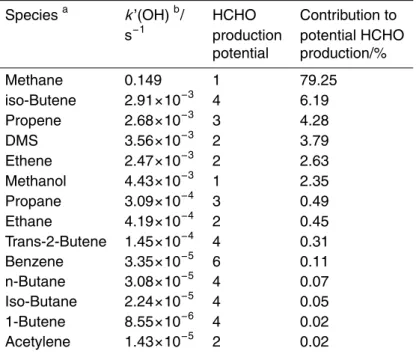
Interactive Discussion 2007). An indication of the relative potential for HCHO production from each parent
hydrocarbon species measured can be obtained by comparing the product of their re-action rates with OH, with the maximum number of possible HCHO molecules which may ultimately result, conserving carbon – i.e. 1 for methane, 3 for propene etc. Table 1 shows the result of this calculation for the summer measurement period.
5
The potential HCHO production is clearly dominated by oxidation of methane (nearly 80% of the total). It should be noted that this approach will overestimate the HCHO production for larger hydrocarbons, as the degradation products from such species may be removed from the atmospheric system by deposition, mixing etc. in the course of their chemical processing, thus the relative contribution of CH4to the in situ chemical
10
production of HCHO at Halley is likely to be greater than this calculation indicates. In the remote boundary layer, the CH4+OH reaction leads to production of CH3O2,
which conventionally is considered to react with organic and hydroperoxyl radicals to form peroxides and alcohols, or with NO, to form (overwhelmingly) CH3O, which will react rapidly with molecular oxygen producing HCHO and HO2. In situ removal of
15
HCHO then follows through photolysis and reaction with OH:
OH+CH4→→CH3O2+H2O (R1)
CH3O2+HO2→CH3OOH+O2 (R2)
CH3O2+CH3O2→CH3OH+HCHO+O2(0.74) (R3)
2CH3O+O2(0.26) (R4)
20
CH3O2+NO→→HCHO+NO2+O2 (R5)
HCHO+hv →H+HCO/H2+CO (R6)
OH+HCHO→H2O+HCO (R7)
The rate constant for the CH3O2self-reaction, (R3), is 84 times slower than that of the
CH3O2+HO2reaction at 267 K (the mean summertime temperature); as HO2radicals
ACPD
8, 2337–2357, 2008HCHO measurements during CHABLIS in
coastal Antarctica
R. A. Salmon et al.
Title Page
Abstract Introduction
Conclusions References
Tables Figures
◭ ◮
◭ ◮
Back Close
Full Screen / Esc
Printer-friendly Version
Interactive Discussion are likely to be present at similar levels to HO2, the CH3O2self-reaction makes a minor
contribution to CH3O2 removal/HCHO production, and if this term is neglected the
steady state formaldehyde concentration, considering only the CH4 source, may be
approximated as:
[HCHO]ss =k1[OH][CH4](k4[NO]/k2[HO2]+k4[NO])
j5+k6[OH] (1)
5
Applying the mean observed levels for OH (3.9×105cm−3; Bloss et al., 2007), NO (7.3 pptv; Jones et al., 2007), HO2(0.76 ppt; Bloss et al., 2007) and measured HCHO
photolysis rate (H. K. Roscoe, personal communication) for the CHABLIS summer measurement period, a mean formaldehyde mixing rato of 99.7 ppt is obtained, close to the observed (summertime) mean of 127 ppt. The mean (e−1
) lifetime of HCHO is
10
13.5 h, dominated by photolysis.
Considering the approximations adopted, and the moderate lifetime of HCHO in this environment, the agreement between the observed and calculated HCHO levels pro-vides little evidence for any net flux of HCHO into or out of the boundary layer from elsewhere. The photochemical environment at Halley however deviates from many
15
remote environments, in that the halogen oxides, IO and BrO, may be present at ap-preciable concentrations. Observations during CHABLIS using a boundary layer DOAS (Saiz-Lopez et al., 2007), revealed typical mixing ratios for both species over the sum-mer period of 2 ppt on average (typical peaks of 5 ppt). The halogens affect the HCHO calculation above in two ways:
20
4.1 Reaction of XO with CH3O2
XO+CH3O2→Products (R8)
Rate constants of 9.14×10⁻¹² molec−1cm3s−1 (267 K) and 5.7×10⁻¹² (298 K) have been reported by Enami et al. (2007) and Aranda et al. (1997) respectively, but the products of the reaction are not fully constrained: Evidence from the kinetic studies
ACPD
8, 2337–2357, 2008HCHO measurements during CHABLIS in
coastal Antarctica
R. A. Salmon et al.
Title Page
Abstract Introduction
Conclusions References
Tables Figures
◭ ◮
◭ ◮
Back Close
Full Screen / Esc
Printer-friendly Version
Interactive Discussion indicates that the likely products are CH2O2+HOBr, or CH3OBr+O2, rather than (for
example) CH3O+BrO2, which would yield HCHO+Br+O2. In this paper we assume
that the reaction does not produce HCHO. Measured rate constants for the IO+CH3O2
reaction are in disagreement, with values (molec−1cm3s−1) of 6
×10−11 (Bale et al., 2005; 298 K), 2×10⁻¹² (Dillon et al., 2006; 298 K) and 6.9×10⁻¹¹ (Enami et al., 2006;
5
267 K). Moreover, the products of the reaction are unknown. For the purposes of this analysis we have used a rate constant of 2×10⁻¹² molec−1cm3s−1, and again assume that the reaction does not produce HCHO.
At the observed mean summer levels of 2 ppt, following the above assumptions, the halogen oxides account for 25% of the CH3O2removal rate (considering reaction with
10
NO, HO2, IO and BrO), resulting in reduced steady-state CH3O2 levels, and hence
reduced HCHO production.
4.2 Reaction of Br and BrO with HCHO
Br+HCHO→HBr+HCO (R9)
The Br+HCHO reaction has a rate constant of 8.8×10⁻¹³ molec−1cm3s−1
(IUPAC-15
Atkinson et al., 2007, 267 K). The observed levels of BrO during CHABLIS (DOAS), correspond to Br atom concentrations of approximately 0.8 ppt on average (from steady state between BrO photolysis and the Br+O3 reaction). The corresponding HCHO
re-moval rate is equivalent to 90% of that from photolysis and reaction with OH, and reduces the calculated HCHO lifetime to 7.2 h. BrO may also react with HCHO, with
20
rate constants of 1.5×10⁻¹⁴molec−1cm3s−1(calculation) and 4×10⁻¹⁵molec−1cm3s−1 (upper limit) reported by Hansen et al. (1999) and Orlando (2000) respectively. Even at the faster rate, the reaction only makes a 2% contribution to HCHO removal, and is neglected here.
Reactions (R7) (7afor IO, 7bfor BrO) and (R8) may be incorporated into the steady
ACPD
8, 2337–2357, 2008HCHO measurements during CHABLIS in
coastal Antarctica
R. A. Salmon et al.
Title Page
Abstract Introduction
Conclusions References
Tables Figures
◭ ◮
◭ ◮
Back Close
Full Screen / Esc
Printer-friendly Version
Interactive Discussion state expression for HCHO :
[HCHO]ss=k1[OH][CH4]k4[NO]/(k2[HO2]+k4[NO]+k7a[IO]+k7b[BrO])(E2) j5+k6[OH]+k8[Br]
(2)
Including both of the XO+CH3O2 and the Br+HCHO reactions into the steady-state calculation results in an HCHO mixing ratio of 40 ppt, which may be compared with the observed level of 127 ppt during the summertime period. Exploring the uncertainties
5
in the XO+CH3O2kinetics, if the IO+CH3O2reaction were to proceed with the higher rate constant, and not lead to HCHO production, the steady-state HCHO level would be 17 ppt. If both the IO and BrO reactions with CH3O2led to direct production of HCHO,
at the faster rate in the IO case, the steady state HCHO levels would be 55 ppt.
The presence of the iodine and particularly bromine compounds in the Antarctic
10
boundary layer at Halley thus significantly reduces the in situ steady-state HCHO level expected from methane oxidation, from 99 to 17–55 ppt, depending upon the details of the halogen oxide – peroxy radical chemistry. These values are significantly lower than the observed level (127 ppt), indicating a net positive flux of HCHO to the Antarc-tic boundary layer, resulting from the combined influence of the snowpack, and the
15
overlying atmosphere.
Taking the in situ chemistry steady-state HCHO mixing ratio of 40 ppt derived above, the additional HCHO production rate required to match the observed 127 ppt is 8.8×10⁴ molec cm−3 s−1, i.e. in flux terms, assuming a 100 m boundary layer height, this is equivalent to an HCHO emission flux of 8.8×10¹² molec m−2 s−1 if the net flux in or
20
out of the boundary layer from the overlying atmosphere is assumed to be zero. Fluxes of HCHO out of the snowpack of the order 1012 molec m−2
s−1
have been reported for South Pole during December (Hutterli et al., 2004), which suggests that the calculated Halley fluxes are reasonable. In addition, the Halley fluxes will be sensitive to the assumed boundary layer height, and, as noted above, implicitly assume zero exchange
25
ACPD
8, 2337–2357, 2008HCHO measurements during CHABLIS in
coastal Antarctica
R. A. Salmon et al.
Title Page
Abstract Introduction
Conclusions References
Tables Figures
◭ ◮
◭ ◮
Back Close
Full Screen / Esc
Printer-friendly Version
Interactive Discussion
5 Summary and conclusion
Year-round measurements of HCHO in coastal Antarctica were obtained at Halley re-search station as part of the CHABLIS campaign. The data show a wintertime minimum of near, or below, the instrumental detection limit, rising to between 50 and 200 pptv during the austral summer. This seasonality is in line with the only other year-round
5
HCHO dataset from coastal Antarctica, conducted at Neumayer station, but the values measured at Halley are roughly a factor 3 to 4 lower. The steady state calculations for HCHO presented here provide a coherent picture of the dominant controls on HCHO mixing ratios. Methane dominates the HCHO production, and other hydrocarbons, including DMS, alkenes and isoprene (which were not observed above the detection
10
limit by the GC-FID during CHABLIS) are negligible contributors, a few percent at most. HCHO removal is dominated by photolysis and reaction with Br atoms. The halogen oxide XO reactions with CH3O2may also be significant in determining the HCHO mix-ing ratio, but the data to constrain these is very uncertain. A consequence of the halogen chemistry is a reduced HCHO lifetime that will reduce the impact of the
snow-15
pack source of HCHO to the overlying atmosphere (in snow covered regions where the halogens are present).
Acknowledgements. The authors would like to thank the Natural Environment Research Coun-cil Antarctic Funding Initiative for providing funding for this research under grant number NER/G/S/2001/00010, and the BAS core project CACHE-CEFAC.
20
References
Aranda, A., Le Bras, G., La Verdet, G., and Poulet, G.: The BrO+CH3O2 reaction : Kinetics and role in the atmospheric ozone budget, Geophys. Res. Lett. 24, 2745–2748, 1997. Atkinson, R., Baulch, D. L., Cox, R. A., Crowley, J. N., Hampson, R. F., Hynes, R. G., Jenkin,
M. E., Rossi, M. J., and Troe, J.: Evaluated kinetic and photochemical data for atmospheric
25
ACPD
8, 2337–2357, 2008HCHO measurements during CHABLIS in
coastal Antarctica
R. A. Salmon et al.
Title Page
Abstract Introduction
Conclusions References
Tables Figures
◭ ◮
◭ ◮
Back Close
Full Screen / Esc
Printer-friendly Version
Interactive Discussion
2006,
http://www.atmos-chem-phys.net/6/3625/2006/.
Atkinson, R., Baulch, D. L., Cox, R. A., Crowley, J. N., Hampson, R. F., Hynes, R. G., Jenkin, M. E., Rossi, M. J., and J. Troe, Evaluated kinetic and photochemical data for atmospheric chemistry: Volume III – gas phase reactions if inorganic halogens, Atmos. Chem. Phys. 7,
5
981–1191, 2007.
Bale, C. S. E., Canosa-Mas, C. E., Shallcross, D. E., and Wayne, R. P.: A discharge-flow study of the kinetics of the reactions of IO with CH3O2and CF3O2, Phys. Chem. Chem. Phys., 7, 2164–2172, 2005.
Beine, H. J., Amoroso, A., Domin ´e, F., King, M. D., Nardino, M., Ianniello, A., and France, J.
10
L.: Surprisingly small HONO emissions from snow surfaces at Browning Pass, Antarctica, Atmos. Chem. Phys., 6, 2569–2580, 2006,
http://www.atmos-chem-phys.net/6/2569/2006/.
Bloss, W. J., Lee, J. D., Heard, D. E., Salmon, R. A., Bauguitte, S. J.-B., Roscoe, H. K., and Jones, A. E.: Observations of OH and HO2 radicals in coastal Antarctica, Atmos. Chem.
15
Phys. 7, 4171–4185, 2007.
Burkhart, J. F., Hutterli, M. A., and Bales, R. C.: Partitioning of formaldehyde between air and ice at−35◦C to−5◦C, Atmos. Environ., 36, 2157–2163, 2002.
Chen, G., Davis, D., Crawford, J., Hutterli, L. M., Huey, L. G., Slusher, D., Mauldin, L., Eisele, F., Tanner, D., Dibb, J., Buhr, M., McConnell, J., Lefer, B., Shetter, R., Blake, D., Song, C.
20
H., Lombardi, K., and Arnoldy, J.: A reassessment of HOx South Pole chemistry based on observations recorded during ISCAT 2000, Atmos. Environ., 38, 5451–5461, 2004.
Chen, G., Huey, L. G., Crawford, J. H., Olson, J. R., Hutterli, M. A., Sjostedt, S., Tanner, D., Dibb, J., Lefer, B., Blake, N., Davis, D., and Stohl, A.: An assessment of the polar HOx pho-tochemical budget based on 2003 Summit Greenland field observations, Atmos. Environ.,
25
41, 7806–7820, 2007.
Couch, T. L., Sumner, A. L., Dassau, T. M., Shepson, P. B., and Honrath, R. E.: An Investiga-tion of the InteracInvestiga-tion of Carbonyl Compounds with the Snowpack, Geophys. Res. Lett., 27, 2241–2244, 2000.
Dassau, T. M., Sumner, A. L., Koeniger, S. L., Shepson, P. B., Yang, J., Honrath, R. E., Cullen,
30
ACPD
8, 2337–2357, 2008HCHO measurements during CHABLIS in
coastal Antarctica
R. A. Salmon et al.
Title Page
Abstract Introduction
Conclusions References
Tables Figures
◭ ◮
◭ ◮
Back Close
Full Screen / Esc
Printer-friendly Version
Interactive Discussion
De Serves, C.: Gas phase formaldehyde and peroxide measurements in the Arctic atmosphere, J. Geophys. Res., 99, 25 391–25 398, 1994.
Dillon, T. J., Tucceri, M. E., and Crowley, J. N.: Laser induced fluorescence studies of iodine oxide chemistry, Phys. Chem. Chem. Phys., 8, 5185–5198, 2006.
Dlugokencky, E. J., Lang, P. M., and Masarie, K. A.: Atmospheric Methane Dry Air Mole
Frac-5
tions from the NOAA ESRL Carbon Cycle Cooperative Global Air Sampling Network, 1983– 2006, Version: 2007-09-19, path:ftp://ftp.cmdl.noaa.gov/ccg/ch4/flask/event/, 2007.
Dong, S. and Dasgupta, P. K.: Fast Fluorometric Flow Injection Analysis of Formaldehyde in Atmospheric Water, Environ. Sci. Technol., 21, 581–588, 1987.
Dasgupta, P. K., Dong, S., Hwang, H., Yang, H.-C., Genfa, Z.: Continuous Liquid-Phase
Flu-10
orometry Coupled to a Diffusion Scrubber for the Determination of Atmospheric Formalde-hyde, Hydrogen Peroxide and Sulfur Dioxide, Atmos. Environ., 22, 949–963, 1988.
Enami, S., Yamanaka, T., Hashimoto, S., Kawasaki, M., Nakano, Y., and Ishiwata, T.: Kinetic Study of IO Radical with RO2 (R= CH3, C2H5, and CF3) Using Cavity Rind-Down Spec-troscopy, J. Phys. Chem. A, 110, 9861–9866, 2006.
15
Enami, S., Yamanaka, T., Nakayama, T., Hashimoto, S., Kawasaki, M., Shallcross, D. E., Nakano, Y., and Ishiwata, T.: A Gas-Phase Kinetic Study of the Reaction between Bromine Monoxide and Methylperoxy Radicals at Atmospheric Temperatures, J. Phys. Chem. A, 111, 3342–3348, 2007.
Grannas, A. M., Shepson, P. B., Guimbaud, C., Sumner, Albert, M., Simpson, W., t Domine,
20
F, Boudriese, H., Bottenheim J., ,Beine, HJ, Honrath, R., Zhou, X, A study of photochemical and physical processes affecting carbonyl compounds in the Arctic atmospheric boundary layer, Atmos. Environ., 36, 2733–2742, 2002.
Grannas, A. M., Shepson, P. B., and Filley, T. R.: Photochemistry and nature of or-ganic matter in Arctic and Antarctic snow, Global Biogeochem. Cy., 18, GB1006,
25
doi:10.1029/2003GB002133, 2004.
Hansen, J. C., Li, Y., Francisco, J. S., and Li, Z. : On the Mechanism of the BrO + CH2O Reaction, J. Phys. Chem. A, 103, 8543–8546, 1999.
Hutterli, M. A., Bales, R. C., McConnell, J. R., and Stewart, R. W.: HCHO in Antarctic Snow: Preservation in Ice Cores and Air-Snow Exchange, Geophys. Res. Lett., 29, 1235,
30
doi:10.1029/2001GL014256, 2002.
ACPD
8, 2337–2357, 2008HCHO measurements during CHABLIS in
coastal Antarctica
R. A. Salmon et al.
Title Page
Abstract Introduction
Conclusions References
Tables Figures
◭ ◮
◭ ◮
Back Close
Full Screen / Esc
Printer-friendly Version
Interactive Discussion
Hutterli, M. A., McConnell, J. R., Chen, G., Bales, R. C., Davis, D. D., and Lenschow, D. H.: Formaldehyde and hydrogen peroxide in air, snow and interstitial air at South Pole, Atmos. Environ., 38, 5439–5450, 2004.
Hutterli, M. A., McConnell, J. R., Stewart, R. W., and Bales, R. C.: Sensitivity of hydro-gen peroxide and formaldehyde preservation in snow and firn to changing ambient
condi-5
tions: Implications for the interpretation of ice-core records., J. Geophys. Res., 108, 4023, doi:10.1029/2002JD002528, 2003.
Hutterli, M. A., McConnell, J. R., Stewart, R. W., Jacobi, H.-W., and Bales, R. C.: Impact of temperature-driven cycling of hydrogen peroxide (H2O2) between air and snow on the planetary boundary layer, J. Geophys. Res., 106, 15 395–15 404, 2001.
10
Jacob, D. J., Field, B. D., Li, Q., Blake, D. R., de Gouw, J., Warneke, C., Hansel, A., Wisthaler, A., Singh, H. B., and Guenther, A.: Global budget of methanol: Constraints from atmospheric observations, J. Geophys. Res., 110, D08383, doi:10.1029/2004JD005172, 2005.
Jacobi, H.-W., Frey, M. M., Hutterli, M. A., Bales, R. C., Schrems, O., Cullen, N. J., Steffen, K., and Koehler, C.: Long-term measurements of hydrogen peroxide and formaldehyde
ex-15
change between the atmosphere and surface snow at Summit, Greenland, Atmos. Environ., 36, 2619–2628, 2002.
Jones, A. E., Wolff, E. W., Ames, D., Bauguitte, S. J.-B, Clemitshaw, K., Fleming, Z., Mills, G., Saiz-Lopez, A., Salmon, R. A., Sturges, W., and Worton, D.: The multi-seasonal NOy budget in coastal Antarctic and its link with surface snow and ice core nitrate: results from
20
the CHABLIS campaign, Atmos. Chem. Phys. Discuss., 7, 4127–4163, 2007,
http://www.atmos-chem-phys-discuss.net/7/4127/2007/.
K ¨onig-Langlo, G., King, J., and Pettre, P.: Intercomparison of the climatology from the three coastal Antarctic stations Dumont d’Urville, Neumayer, and Halley with respect to aerosol and snowfall chemistry, J. Geophys. Res., 103, 10 935–10 946, 1998.
25
Orlando, J. J., Ramacher, B., and Tyndall, G. S.: Upper limits for the Rate Coefficients for Reactions of BrO with Formaldehyde and HBr, Geophys. Res. Lett., 27, 2633–2636, 2000. Read, K. A., Lewis, A. C., Salmon, R. A., Jones, A. E., and Bauguitte, S.: OH and halogen
atom influence on the variability of non-methane hydrocarbons in the Antarctic Boundary Layer, Tellus B, 59, 22–38, 2007.
30
Riedel, K., Weller, R., and Schrems, O.: Variability of formaldehyde in the Antarctic troposphere, Phys. Chem. Chem. Phys., 1, 5523–5527, 1999.
ACPD
8, 2337–2357, 2008HCHO measurements during CHABLIS in
coastal Antarctica
R. A. Salmon et al.
Title Page
Abstract Introduction
Conclusions References
Tables Figures
◭ ◮
◭ ◮
Back Close
Full Screen / Esc
Printer-friendly Version
Interactive Discussion
measurements and methane oxidation model predictions in the Antarctic troposphere: An assessment of other possible formaldehyde sources, J. Geophys. Res., 110, 15308, doi:10.1029/2005JD005859, 2005.
Saiz-Lopez, A., Mahajan, A. S., Salmon, R. A., Bauguitte, S. J.-B., Jones, A. E., Roscoe, H. K., and Plane, J. M. C.: Boundary layer halogens in coastal Antarctica, Science, 317, 348–351,
5
2007.
Shepson, P. B., Sirju, A.-P., Hopper, J. R., Barrie, L. A., Young, V., Niki, H., Dryfhout, H.: Sources and sinks of carbonyl cmopountds in the Arctic Ocean boundary layer: Polar ice floe experiment, J. Geophys. Res., 101, 21 081–21 089, 1996.
Sjostedt, S. J., Huey, L. G., Tanner, D. J, Peischl, J., Chen, G., Dibb, J. E., Lefer, B., Hutterli, M.
10
A., Beyersdorf, A. J., Blake, N. J., and Blake, D. R.: Peroxy and Hydroxyl Radical Measure-ments During the Spring 2004 Summit Field Campaign, Eos Trans. AGU, 86(56), Fall Meet. Suppl., Abstract A24A-02, 2005.
Sjostedt, S. J., Huey, L. G., Tanner, D. J., Peischl, J., Chen, G., Dibb, J. E., Lefer, B., Hutterli, M. A., Beyersdorf, A. J., Blake, N. J., Blake, D. R., Sueper, D., Ryerson, T., Burkhart, J., and
15
Stohl, A.: Observations of hydroxyl and the sum of peroxy radicals at Summit, Greenland during summer 2003, Atmos. Environ., 41, 5122–5137, 2007.
Staffelbach, T., Neftel, A., Stauffer, B., and Jacob, D.: A record of the atmospheric methane sink from formaldehyde in polar ice cores, Nature, 349, 603–605, 1991.
Sumner, A. L., Shepson, P. B., Grannas, A. M., Bottenheim, J. W., Anlauf, K. G., Worthy,
20
D., Schroeder, W. H., Steffen, A., Domine, F., Perrier, S., and Houdier, S.: Atmospheric chemistry of formaldehyde in the Arctic troposphere at Polar Sunrise, and the influence of the snowpack, Atmos. Environ., 36, 2553–2562, 2002.
Sumner, A. L. and Shepson, P. B.: Snowpack production of formaldehyde and its effect on the Arctic troposphere, Nature, 398, 230–233, 1999.
25
Yang, J., Honrath, R. E., Peterson, M. C., Dibb, J. E., Sumner, A .L., Shepson, P. B., Frey, M., Jacobi, H.-W., Swanson, A., and Blake, N.: Impacts of snowpack emissions on deduced levels of OH and peroxy radicals at Summit, Greenland, Atmos. Environ., 36, 2523–2534, 2002.
Zhou, X., Beine, H. J., Honrath, R. E., Fuentes, J. D., Simpson, W., Shepson, P. B., and
30
ACPD
8, 2337–2357, 2008HCHO measurements during CHABLIS in
coastal Antarctica
R. A. Salmon et al.
Title Page
Abstract Introduction
Conclusions References
Tables Figures
◭ ◮
◭ ◮
Back Close
Full Screen / Esc
Printer-friendly Version
Interactive Discussion
Table 1.Relative potential HCHO production from OH-initiated VOC oxidation.
Speciesa k’(OH)b/ HCHO Contribution to s−1
production potential HCHO potential production/%
Methane 0.149 1 79.25 iso-Butene 2.91×10⁻³
4 6.19 Propene 2.68×10⁻³
3 4.28 DMS 3.56×10⁻³ 2 3.79 Ethene 2.47×10⁻³
2 2.63 Methanol 4.43×10⁻³
1 2.35 Propane 3.09×10⁻⁴
3 0.49 Ethane 4.19×10⁻⁴ 2 0.45 Trans-2-Butene 1.45×10⁻⁴ 4 0.31 Benzene 3.35×10⁻⁵ 6 0.11 n-Butane 3.08×10⁻⁵
4 0.07 Iso-Butane 2.24×10⁻⁵
4 0.05 1-Butene 8.55×10⁻⁶
4 0.02 Acetylene 1.43×10⁻⁵
2 0.02
Notes: a CH4 data from CMDL flask analyses (Dlugokencky et al., 2007); CH3OH (200 ppt, taken from Jacob et al., 2005); NMHC data measured via GC-FID (Read et al., 2007).
b
ACPD
8, 2337–2357, 2008HCHO measurements during CHABLIS in
coastal Antarctica
R. A. Salmon et al.
Title Page
Abstract Introduction
Conclusions References
Tables Figures
◭ ◮
◭ ◮
Back Close
Full Screen / Esc
Printer-friendly Version
Interactive Discussion
R2 = 0.9687
0 0.5 1 1.5 2 2.5 3
0 2 4 6 8 10 12 14 16 18
HCHO conc emitted by Kintech source /ppb
A
L
4
0
2
1
s
ig
n
a
l/
V
Kintech gas calibrator AL4021 internal wafer signal
Fig. 1. Gas Calibration of AL4021 HCHO Analyser. Error from Kintech HCHO source 15%, error bars show 2σ variation of repeated calibrations, Pearson’s linear correlation coefficiant,
ACPD
8, 2337–2357, 2008HCHO measurements during CHABLIS in
coastal Antarctica
R. A. Salmon et al.
Title Page
Abstract Introduction
Conclusions References
Tables Figures
◭ ◮
◭ ◮
Back Close
Full Screen / Esc
Printer-friendly Version
Interactive Discussion 0.2
0.1
0.0
-0.1
HCHO conc / ppbv
May 1 Jun 1 Jul 1 Aug 1 Sep 1 Oct 1 Nov 1 Dec 1 Jan 1 Feb 1 Mar 1