AR
TICLE
1Centro de Ciências da Saúde, UFPB. Cidade Universitária s/n, Castelo Branco III. 58051-900 João Pessoa PB Brasil. [email protected] 2 Centro de Ciências Exatas e da Natureza, UFPB. João Pessoa PB Brasil.
Moderate and severe household food insecurity
in families of people living with HIV/Aids: scale validation
and associated factors
Abstract Vulnerable population groups, includ-ing people livinclud-ing with HIV/Aids (PLHA), may have a high prevalence of food insecurity (FI). A cross-sectional study evaluated the internal valid-ity of the Brazilian Food Insecurvalid-ity Scale (Escala Brasileira de Insegurança Alimentar – EBIA) and measured the prevalence of FI in a sample of 796 PLHA in João Pessoa, Paraíba State (PB). The validation was performed using a Rasch analysis. The association of FI with sociodemographic and clinical characteristics was assessed using the chi-square test. Associated variables were included in a Poisson multiple regression model. The EBIA was valid for PLHA with fit values within the expected limits and item severity conforming to the theoretical model. The EBIA identified 66.5% of PLHA with FI in the sample (30.8% mild FI, 18.1% moderate FI and 17.6% severe FI). Mod-erate FI and severe FI were associated with an age younger than 43 years (prevalence ratio (PR) = 1.49; 95% confidence interval (CI): 1.14-1.86), primary education (PR=1.64; 95% CI: 1.24-2.17), income per capita lower than ½ minimum wage (MW) (PR=1.83; 95% CI: 1.37-2.44), lack of occupation (PR=1.59; 95% CI: 1.16-2.19) and adult-only households with a female reference person (PR=2.19; 95% CI: 1.45-3.31). The PLHA in this study had a high prevalence of FI, worsen-ing their livworsen-ing conditions and potentially exacer-bating their health problems.
Keywords Food insecurity, EBIA, HIV, AIDS Amira Rose Costa Medeiros 1
Rafaela Lira Formiga Cavalcanti de Lima 1
Leidyanny Barbosa de Medeiros 1
Flávia Maiele Pedroza Trajano 1
Amanda Amaiy Pessoa Salerno 1
Ronei Marcos de Moraes 2
M
ed
eir
os AR
Introduction
Food and nutritional security (FNS) is “the real-ization of everyone’s right to regular and perma-nent access to quality food, in sufficient quantity, without endangering access to other essential needs, based on food practices that promote health, that respect cultural diversity and that are socially, economically and environmentally
sustainable”1. At the household level, food
se-curity (FS) is associated with food access con-ditions and is directly related to family income, education, access to other basic needs and living
conditions2,3. Food insecurity (FI) affects an
indi-vidual’s health, nutritional status and well-being with physical, biological and psychological
con-sequences4. In 2013, in Brazil, 22.6% of Brazilian
households had FI; this prevalence is historically higher in the north and northeast regions of the country. In Paraíba State in that same year, 36.5%
families were experiencing FI3.
The FS and FI situation has been evaluated using the Brazilian Food Insecurity Scale (Esca-la Brasileira de Insegurança Alimentar – EBIA), which was adapted and validated for the
Brazil-ian context in 20035-7. Based on the answers to
the 14 items of the scale, each household is clas-sified into 1 of 4 groups: FS, mild FI, moderate FI and severe FI. The EBIA has been used to assess the prevalence of FNS and the different FI levels in Brazil and to identify vulnerable groups
re-quiring specific social policies3.
People living with HIV/AIDS (PLHA) are a specific and vulnerable group under permanent treatment with a complex and high-cost therapy. The Brazilian Antiretroviral Therapy Guidelines for HIV-Infected Adults refer to the importance of healthy eating for providing the necessary nu-trients to the body’s functioning, preserving the immune system, improving tolerance toward an-tiretroviral drugs, favoring their absorption and preventing side effects, and helping to promote health and improve physical and mental
perfor-mance8.
Studies conducted in Canada showed that the prevalence of FI among people with access to an-tiretroviral therapy (ARVT) in British Columbia reached 48%, and slightly less than half of those people reported hunger. These individuals were mostly women, aboriginals, people who lived with children, people with a lower educational level, people with a history of drug and alcohol
use and people with unstable housing9.
Subse-quently, a follow-up study, also conducted in this province, observed that the FI situation had
contributed to the unsatisfactory clinical pro-gression of these individuals: FI was associated with a higher mortality rate and worse clinical
outcomes during the sample follow-up10,11.
In Paraíba State (PB), PLHA are followed at the Complexo Hospitalar de Doenças Infec-to-Contagiosas Clementino Fraga (Clementino Fraga Communicable Infectious Diseases Hospi-tal Complex – CHCF) in João Pessoa, which is a referral hospital that treats most patients with HIV from this state. Considering that FI may reach high prevalence rates in population groups
with worse living conditions3 and that PLHA are
known to be vulnerable, this study focused on measuring the prevalence of FI and its associa-tion with sociodemographic and health factors in this population. Although EBIA is an instrument validated for the Brazilian population in general, PLHA are a specific group with a serious disease. Thus, the EBIA internal validity and response be-havior for people from this group must be eval-uated because of concern that the disease may affect other aspects of life, such as access to food, which is an FI dimension assessed by the EBIA.
Methods
A cross-sectional study was performed involv-ing PLHA followed at the CHCF in João Pessoa, PB. All persons treated in the department from March 25 to May 27 and from September 2 to December 23, 2015 were selected by convenience. These data collection months were randomly chosen and are independent of any departmental planning. The chosen time periods are periods of routine hospital activities. In total, 796 PLHA were recruited using this strategy, including 399 from the first period and 397 from the second.
All patients were subjected to a face-to-face in-terview conducted by a team of previously trained researchers. The inclusion criteria were being 18 years of age or older, having been diagnosed with HIV/ AIDS for longer than 6 months, using ARVT, having no neurological or psychiatric disorders and not being pregnant. All participants agreed to participate in the research study and had previ-ously signed an informed consent form.
e C
ole
tiv
a,
22(10):3353-3364,
2017
or older; c) occupation: with occupation/eco-nomically active (employed, freelance, students), without occupation (unemployed, homemaker, retired or pensioner), or information not avail-able; d) marital status: living with partner, not living with partner; e) education: none to in-complete primary education, in-complete primary education or higher; f) family income: total sum of all family income; g) number of household members: absolute value and categories of 1 to 3 members, 4+ members; and h) per capita income (assessed by the ratio between family income and the number of household members) in absolute value and categories of none to ½ minimum wage (MW) and higher than ½ MW.
Weight and height were measured in 479 in-dividuals, using a digital scale with a capacity up to 150 kg and an accuracy to 0.1 kg. Height was measured using an inelastic tape measure fixed to the wall, following the recommendations from
the Brazilian Ministry of Health12. The weight and
height of the rest of the sample were self-report-ed and subsequently correctself-report-ed using an equa-tion generated using self-reported and measured values from 20% of the sample. This correction was performed to achieve higher measurement accuracy and decrease the bias resulting from 2 different data collection methods, measured and
self-reported data13. The body mass index (BMI)
was calculated by dividing weight (kg) by height (m) squared. The values obtained were catego-rized into low weight, normal weight, overweight and obesity14.
Disease length was considered the difference between the date of diagnosis and the date of the interview, and the length of ARVT use was the difference between the start dates of use recorded in the medical charts and the date of the inter-view. These time measurements were categorized into tertiles.
EBIA is a 14-item scale for households with adults and minors and an 8-item scale for adult-only households. All answers are dichoto-mous and evaluate aspects ranging from concern over the lack of food and reduced food quality to the lack of food for the family. Each answer adds a point to the total score of the scale, and the
households were classified into: FS (no points);
mild FI (from 1 to 5 points for households with
minors or from 1 to 3 points for adult-only
households); moderate FI (from 6 to 9 points for
households with minors or from 4 to 5 points for
adult-only households);and severe FI (from 10 to
14 points for households with minors or from 6 to 8 points for adult-only households).
The internal validity of the EBIA was per-formed using the Rasch Model with
measure-ments of severity and fit – infit15. Severity is the
logarithmic measure of the likelihood of a house-hold to respond positively to an item, whereas fit corresponds to the ratio of the squared difference between the expected and observed estimates and is identified as the mean of the squared residuals,
with an acceptable value ranging from 0.5 to 1.516.
The infit ratio compares the response pattern in the empirical data and theoretical model, that is, it is used to assess whether an easier item gets a higher number of correct answers than a more
difficult item17. Both statistics and the number of
affirmative answers to each question were calcu-lated. A Rasch analysis was performed using the software WINSTEPS version 3.72. The sample was stratified into 2 groups for the Rasch anal-ysis: adult-only households and households with adults and minors, as a function of the strong as-sociation observed between household composi-tion and FS situacomposi-tion or different FI levels.
All variables were described through fre-quency tables. The measures of central tendency, mean and median, dispersion, standard devi-ation and 95% confidence intervals (CIs) were also calculated for the continuous variables. The dependent variable of the study, FS or the FI situation, was categorized into group 1 (FS and mild FI) and group 2 (moderate and severe FI) to compare the situation of FS and mild FI (when decreases in food quality or concerns about food quality occur) with more severe situations (when restriction in available food quantity and even household hunger occur). This can identify more serious nutritional problems among PLHA.
The association of FI with the other study variables was tested using the chi-square test with a 5% significance level. To construct the multiple model, the independent variables with a p-value less than or equal to 0.20 were includ-ed in a Poisson regression model to estimate the independent effects – prevalence ratio (PR) – of each variable regarding the highest moderate or severe FI situation compared to the FS or mild FI situation. The final model only consisted of sig-nificant variables (p-value lower than 0.05).
M
ed
eir
os AR
final model when significant, that is, with a
p-val-ue of less than 0.0518.
This research study was approved by the Research Ethics Committee of the Health Sci-ences Center at the Federal University of Paraí-ba (UFPB). All ethical considerations set out in
Resolution 466/1219 were observed, particularly
because this is a special group, strictly respecting secrecy and anonymity. The researchers declare no conflicts of interest with the research results.
Results
A total of 796 PLHA participated in this research study, of whom 312 (39.2%) were women and 484 (60.8%) were men. The recorded age ranged from 19 to 87 years, with a mean of 44.3 years (SD = 10.7 years) and a median of 43 years. Most participants had incomplete primary education (52.4%) and 66.3% stated having no occupation, declaring themselves as economically inactive. The calculated income per capita ranged wide-ly, with a mean of R$ 632.07 (SD = R$735.41). There was an average of 3.0 residents in a house-hold, and 62.2% of the interviewees lived in adult-only households.
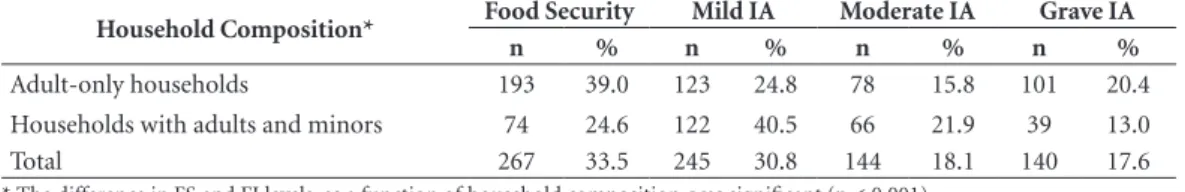
The prevalence of FI in this sample was 66.5%, and the distribution of FS and the dif-ferent FI levels was significantly associated with adult-only households or households also with minors. The differences observed in the frequen-cy distribution of these 2 groups showed that the prevalence of severe FI was higher in adult-only households even though FS was also higher in this group (Table 1).
These same 2 strata were considered for the psychometric analyses of the scale. The results from the Rasch model respond adequately to the theoretical model of the FI construct according to the severity values of the items and to the in-fit adjustment of each item in the 2 study groups (Figure 1). The least serious items, “decreasing the quality”, “decreasing the variety” and “being con-cerned”, had the lowest severity, followed by the issues “decreasing the quantity”, “lacking food” and “decreasing the number of meals”. The most serious issues of “feeling hungry” and “skipping meals” had the highest severity, as expected. The infit values of the items remained within the ex-pected range from 0.7 to 1.3, except for the item “being concerned”, which had infit scores of 1.36 and 1.38 for adult-only households and house-hold with adults and minors, respectively. These results show that the scale behaved as expected
and had internal validity when administered to the population of PLHA.
The mean length of HIV-seropositive diag-nosis among the participants was 7.4 years, with a standard deviation of 5.3 years, a minimum length of 6 months (set as the inclusion criteri-on) and a maximum length observed of 35 years. The median length of diagnosis was 6.2 years. The mean length observed for ARVT use was 6.5 years, with a standard deviation of 5.09 years and a median of 5 years.
A detailed description of sociodemographic, economic and health variables as a function of the FS and FI situation is outlined in Table 2, IA, ac-cording to the dichotomization into FS or mild FI
(Group 1) and moderate or severe FI(Group 2).
The association test between the dependent variable, FI situation, which was dichotomized in both groups, and the other study variables showed an association with age, sex, income, ed-ucation and occupation of PLHA. Thus, being a woman (p < 0.001) 43 years or younger (p = 0.013) and having an income per capita lower than half the MW wage (p < 0.001) and incom-plete primary education (p < 0.001) or lacking occupation (p < 0.001) were characteristics as-sociated with a higher prevalence of moderate and severe FI. These significant variables and the variables marital status, length of disease diag-nosis and length of ARVT use were included in a Poisson regression model to estimate the in-dependent effects (PRs) of each variable. Only age, income per capita, education and occupa-tion remained significant within the model. The variable sex of PLHA lost significance within the multiple regression model and was associated with income, education, occupation, number of household members, BMI and household com-position when testing its association with the other variables. Because the variable number of household members was also associated with household composition – adult-only household and household with adults and minors – 2 inter-action variables: sex x BMI and sex x household composition, were created, and the latter was significantly associated with FI, both alone and fitted to the model (Table 3).
e C
ole
tiv
a,
22(10):3353-3364,
2017
with age. Similarly, having lower education in-creased the PR of FI by 64%, lacking occupation or being economically inactive increased the PR by 59.2% and having an income per capita below ½ MW increased the prevalence of moderate or severe FI by 83.1%.
The results from the interaction variable sex of PLHA and household composition showed that the best situation was male PLHA living in households with adults and minors. The prev-alence of moderate and severe FI increased by 63.2% when the person of reference was a woman
Table 1. Prevalence rates of FS and different FI levels in the households of 796 PLHA as a function of their
composition. João Pessoa, 2015.
Household Composition* Food Security Mild IA Moderate IA Grave IA
n % n % n % n %
Adult-only households 193 39.0 123 24.8 78 15.8 101 20.4
Households with adults and minors 74 24.6 122 40.5 66 21.9 39 13.0
Total 267 33.5 245 30.8 144 18.1 140 17.6
* The difference in FS and FI levels, as a function of household composition, was significant (p < 0.001).
Figure 1. Rasch model statistics. (1) Infit values for adult-only households. (2) Severity values of items for
adult-only households. (3) Infit valuesfor households with minors. (4) Severity values of items for households with minors. João Pessoa, 2015.
-4 -3 -2 -1 0 1 2 3 4 5 -3 -2 -1 0 1 2 3
0 0,2 0,4 0,6 0,8 1 1,2 1,4 1,6
1 2
3 4
M
ed
eir
os AR
in households with adults and minors and 85.7% when the person of reference was a man but lived in an adult-only household; the worst situation was assessed when the person of reference was a woman living in an adult-only household. In this last situation, the prevalence of moderate or severe FI was more than double that of the refer-ence group (119.1%).
Discussion
The present study reported the results from the validation of the EBIA administered to PLHA, the measurements of FI prevalence and the fac-tors associated with FI. PLHA are a vulnerable group with a serious disease that, although there is no cure for, may be controlled with proper
Table 2. Frequency distribution of sociodemographic, economic and health variables in PLHA as a function of
the food security situation. João Pessoa, 2015.
Sociodemographic, economic and health variables
Food Security +
Mild FI
Moderate +
Severe FI Total Sample
p-value*
n1 % n2 % n %
Age
Up to 43 years (median) 236 60.0 157 40.0 396 100.0 0.013
Older than 43 years 276 68.5 127 31.5 403 100.0
Sex
Female 171 54.8 141 45.2 312 100.0 < 0.001
Male 341 70.4 143 29.6 484 100.0
Per capita income
Up to ½ minimum wage 229 52.9 204 47.1 433 100.0 < 0.001
More than ½ minimum wage 283 78.0 80 22.0 363 100.0
Education**
Up to incomplete primary education 219 52.5 198 47.5 417 100.0 0.001
Incomplete primary education or higher 292 77.4 85 22.5 377 100.0
Marital status **
Living with partner 331 66.1 170 33.9 501 100.0 0.177
Not living with partner 179 61.3 113 38.7 292
Occupation **
Employed/economically active 209 79.5 54 20.5 263 100.0 < 0.001
Unemployed/economically inactive 302 57.2 226 42.8 528
Number of household members
Up to 3 345 65.6 181 34.4 562 100.0 0.297
4 or more 167 61.8 103 38.2 270
Length of diagnosis
Up to 4 years 164 60.5 107 39.5 271 100.0 0.107
Longer than 4 years 348 66.3 177 33.7 525 100.0
Length of TARV use***
Up to 3 years 166 60.8 107 39.2 273 100.0 0.135
Longer than 3 years 346 66.2 177 33.8 523 100.0
BMI**
Underweight 17 58.6 12 41.4 29 100.0 0.337
Normal weight 262 64.7 143 35.3 405 100.0
Overweight 175 67.0 86 33.0 261 100.0
Obesity 52 55.9 41 44.1 93 100.0
Household composition
Only adults 316 63.8 179 36.2 495 100.0 0.715
Adults and minors 196 65.1 105 34.9 301
e C
ole
tiv
a,
22(10):3353-3364,
2017
treatment, enabling a survival rate similar to that
of the general population20,21. In addition to the
disease itself and other serious problems experi-enced by PLHA, including social prejudice, the need for and complexity of the treatment, this study showed that FI, in its more severe forms, also affects a large part of this population. The EBIA proved adequate for administration to the population group with a good internal validity, according to the tests performed in the Rasch analysis. Acceptable values of fit between the es-timated and the expected response, called infit values, should range from 0.5 to 1.5. Because it is a one-dimensional scale, fits ranging from 0.7 to 1.3 are considered adequate and from 0.8 to 1.2
are considered excellent16. In this study, the
high-est infit value observed in adult-only households was 1.36, and the highest infit value observed in households with adults and minors was 1.38. In both cases, these infit values were for the least se-vere item in the scale: “being concerned about the lack of food”. Some low fits are acceptable for the most extreme items.
The positive results from the validation are important to confirm the adequate performance of the scale in this specific population group. Characteristics such as the biological vulnera-bility of PLHA, risks related to sexual practic-es and their effect on household structure and changes in taste perception and appetite due to ARVT, among others, could be factors that would change the pattern of responses to EBIA items, thereby compromising the validity of this scale. A study conducted with families living in the
interior of PB confirmed the internal and ex-ternal validity of the EBIA, and its consistency, when administered to adult-only households and households with adults and minors. In the vali-dation study, adult-only households have fewer members and higher income per capita, thereby having higher FS than households with adults and minors (66.6% vs 38.1%) and substantially
lower severe FI (3.1% vs 15.4%)22. In this study,
a similar result of a higher prevalence of FS was observed in families of PLHA without the pres-ence of minors. However, the same household composition had a higher prevalence of severe FI. This behavior could be further studied because this may be a key risk factor for the severe FI situ-ation, although the present study failed to collect data for such purpose.
The different behavior of the distribution of safety PRs and the 3 levels of FI as a function of household composition also justifies the house-hold stratification as a function of this charac-teristic to perform the validation analysis. The result, as expected, enables using EBIA in families of PLHA, regardless of their composition.
Regarding the results from the PRs observed, the findings of this study on PLHA were almost twice as high as those observed in the general population of the state of Paraíba in 2013 (36.5% according to the Instituto Brasileiro de Geogra-fia e Estatística [Brazilian Institute of Geography
and Statistics – IBGE]3 compared to 66.5% in
this study). Of the total study sample, 17.6% cas-es were classified as severe FI, which reprcas-esents, according to the EBIA, experiencing hunger in
Table 3. Result from the Poisson multiple regression – variables independently associated with moderate or
severe FI in the total sample, with the prevalence ratio (PR) and confidence interval (CI). João Pessoa, 2015.
Variable Category PR -adjusted
Confidence Interval (95%)
Minimum Maximum
Sex x household composition
Female with an adult-only family Male with an adult-only family
Female with a family of adults and minors Male with a family of adults and minors
2.191 1.857 1.632 1
1.449 1.247 1.083
3.314 2.765 2.460
Age ≤ 43 years
> 43 years
1.459 1
1.143 1.862
Education Up to incomplete primary education
Primary education or higher
1.640 1
1.237 2.174
Occupation Without occupation
With occupation
1.592 1
1.156 2.192
Income per capita ≤ ½ minimum wage
> ½ minimum wage
1.831 1
M
ed
eir
os AR
the last 3 months. This result shows a very seri-ous problem that reflects a great social inequal-ity experienced by the population infected with HIV who are treated in the main public health-care service for infectious diseases of the state of Paraíba. The combined PRs of moderate and se-vere FI in this population group are higher than those among homeless people or people living in poor households in San Francisco, Califor-nia, USA, wherein 25% were classified as severe
FI and the other 24% as mild or moderate FI23.
Notably, the scale used in the USA refers to events
that occurred in the previous year24, whereas the
scale used in Brazil refers only to the previous 3 months.
The FI prevalence among PLHA varies in the literature. In Brazil, a study conducted with 103 PLHA in Brasília evaluated FI in this sample and found results better than the results from João Pessoa, that is, 33.8% FI prevalence among peo-ple with HIV and 36.8% among those with AIDS. This lower prevalence may be attributed to char-acteristics specific to the region. However, these values are much higher than those observed by the national survey in 2013, wherein the FI prev-alence among the general population of the
Fed-eral District was 13.3%25.
These results are also similar to the context of developed countries, including Canada, where 71% of a sample of 457 PLHA using ARVT were experiencing FI, regardless of the level of
severi-ty10; India, where 50.9% of patients from a
clin-ic undergoing ARVT experienced some level of
FI26; or poor countries, including Ethiopia, where
63% of a sample of 319 PLHA also experienced
FI27. FI in the context of PLHA may be a key
risk factor for the occurrence of negative
out-comes28. FI has been associated with a 1.3 times
increased likelihood of showing a worse CD4 cell
count, according to a recent meta-analysis29, and
is associated with depression symptoms, worse treatment compliance and exacerbation of side
effects30. PLHA experiencing FI have a 1.29 times
higher likelihood of showing incomplete viral load suppression and a 1.48 times higher
likeli-hood of failing to comply with the treatment31. A
follow-up study with PLHA conducted in India found that moderate or severe FI is a risk factor for depression among male patients, reinforc-ing the notion that food assistance may decrease stress and provide key benefits for the treatment
of PLHA32.
FI and compromised nutritional status may accelerate the progression of diseases related to AIDS, impair the compliance with and response
to ARVT and exacerbate the socioeconomic im-pacts of the virus. Infection with the virus itself weakens FS and compromises the nutritional sta-tus by reducing the work capacity and productiv-ity and jeopardizing the means of subsistence of
households or families33. PLHA experiencing FI
exacerbate their self-perception of social failure, as reported in a sub-group receiving food assis-tance30.
The variables associated with moderate and severe FI that remained in the final Poisson mul-tiple regression model were incomplete prima-ry education, age younger than the median (43 years), income per capita lower than half the MW, being economically inactive or lacking oc-cupation and adult-only households, particularly when the person infected with HIV is a woman. Because the scale measures access to food, these results are quite consistent and meet the theoret-ical threshold of FI where social inequalities are directly related to the FI phenomenon, that is, the worse the household socioeconomic condi-tions are, the higher the FI prevalence and inten-sity will be, according to the results from other
studies on FI in PLHA34,35. These relationships
are well known in regional or nationwide stud-ies performed with other population groups. In Paraíba, the external validity of the EBIA was confirmed with the direct relationship between
the decrease in income and the increase in FI22. In
Brazil, the lack of access to public services, lower household income per capita, female person of reference, lower education and worse working
conditions were associated with higher FI3. These
results show that the negative effects of social in-equalities are directly related to the perception of
FI36. Notably, the factors measuring the
occur-rence of FI among PLHA are similar to those re-ported in general, but they more intensely affect individuals with a more vulnerable economic situation.
In Ethiopia, a study showed that FI was as-sociated with low family income, low education level and occupation. A higher educational level provides better opportunities for PLHA to en-gage in income-generating activities toward
de-creasing the vulnerability to FI27. The association
of FI with worse social class and lower education
among PLHA was also shown in Brazil25.
mul-e C
ole
tiv
a,
22(10):3353-3364,
2017
tiple regression model. In Brazil, FI is higher in households in which a woman is the person of
reference5. Another nationwide research study
also showed that women experiencing a severe FI situation were more likely to show risk
behav-iors that could lead to infection with HIV31. The
sex distribution observed in this study, in which nearly 40% of PLHA were women, confirms the need for further studies addressing the issue of gender and its impact on the treatment and liv-ing conditions of HIV-positive women.
The observed relationship of a higher prev-alence of moderate and severe FI among PLHA with lower income (lower than ½ MW per capita) confirms that this phenomenon is observed in FI studies conducted with other population groups. However, income restriction in PLHA may be worse than that experienced by families without chronic diseases due to the urgent demand for
treatment needs and their consequences37. Facing
poverty and FI problems in PLHA may be a cru-cial element to obtain improved treatment com-pliance and clinical results with ARVT.
This study identifies factors associated with the increase in prevalence of moderate and severe FI in PLHA, although the FI effects on treatment, compliance and efficacy and clinical outcomes of these patients must be known. These data are important to organize public policies adequate to food access and assistance and social support to improve the survival and quality of life of
pa-tients undergoing ARVT10,38 and to ensure the
FNS of PLHA27.
Some limitations of this study should be con-sidered, particularly because this is a cross-sec-tional study in which the causal relationships cannot be examined. Selection bias may also oc-cur in both the recruitment method and research using cases from the hospital of reference of the state as a source. The sample space used by this study included 2 different periods to recruit all patients accessing the service, and no initiative, campaign or specific activity of the hospital that could bias the sample occurred during the data collection months. Thus, considering that the sample randomization of this population was
precluded, the option used obtained a sample large enough to ensure the internal validity of the results and with a high likelihood of representing PLHA undergoing treatment in the state of Paraí-ba because it is a small state, with high coverage by the Unified Health System (Sistema Único de Saúde – SUS), and most cases are treated in this referral hospital. Furthermore, because this is a serious disease, the percentage of underreport-ing is expected to be lower than that of other less serious diseases. Nevertheless, prejudice and dis-criminatory aspects related to infection with HIV remain a barrier to the identification and
time-ly treatment of the disease39, particularly when
combined with the difficulty of perceiving them-selves as vulnerable to infection, often for fear of embarrassment, and the poor care in testing and
counseling centers40.
Conclusions
The present study showed that EBIA is a valid in-strument for measuring FI among PLHA, which also highlights that this evaluation is important because a high prevalence (66.5%) of PLHA un-dergoing treatment in an FI situation was found in the state of Paraíba. The most serious forms of FI - moderate and severe, with quality and quantity restrictions and even hunger among household members - affected 35.7% of PLHA and were associated with worse socioeconomic conditions, confirming the negative impact on health and nutrition due to social inequalities.
M
ed
eir
os AR
Collaborations
e C
ole
tiv
a,
22(10):3353-3364,
2017
References
1. CONSEA. Princípios e Diretrizes de uma Política de Segurança Alimentar e Nutricional: Textos de Referên-cia da II ConferênReferên-cia Nacional de Segurança Alimentar
e Nutricional. [acessado 2017 set 28]. Disponível em:
http://www4.planalto.gov.br/consea/eventos/conferen-cias/2a-conferencia-nacional-de-seguranca-alimentar -e-nutricional/documento-de-referencia
2. Vianna RPT, Segall-Corrêa AM. Household food inse-curity in municipalities of the Paraíba State, Brazil. Rev Nutr 2008; 21(Supl.):111s-122s.
3. Instituto Brasileiro de Geografia e Estatística (IBGE).
Pesquisa Nacional por Amostra de Domicílios – Seguran-ça Alimentar 2013. Rio de Janeiro: IBGE. [acessado 2017 set 28]. Disponível em: http://www.ibge.gov.br/home/ estatistica/populacao/seguranca_alimentar_2013/ 4. Campbell CC. Food insecurity: a nutritional outcome
or a predictor variable? J Nutr 1991; 121(3):408-415. 5. Pérez-Escamilla R, Segall-Corrêa AM, Kurdian
Mara-nha L, Sampaio MMF, Marín-León L, Panigassi G. An adapted version of the U.S. Department of Agriculture Food Insecurity module is a valid tool for assessing household food insecurity in Campinas, Brazil. J Nutr
2004; 134(8):1923-1928.
6. Segall-Corrêa AM, Escamilla RP, Maranha LK, Sam-paio MFA. (In) Segurança Alimentar no Brasil: Valida-ção de metodologia para acompanhamento e avaliaValida-ção. [acessado 2017 fev 3]. Disponível em: http://bvsms. saude.gov.br/bvs/publicacoes/validacao_brasil1.pdf 7. Segall-Corrêa AM, Marin-León L, Melgar-Quiñonez
H, et al. Refinement of the Brazilian Household Food Insecurity Measurement Scale: Recommendation for a 14-item EBIA. Rev Nutr 2014; 27:241-251.
8. Brasil. Protocolo Clínico e Diretrizes Terapêuticas para
manejo da Infecção pelo HIV em Adultos. [acessado
2017 fev 2]. Disponível em: http://www.aids.gov.br/ sites/default/files/anexos/publicacao/2013/55308/pro-tocolo_13_3_2014_pdf_28003.pdf
9. Normén L, Chan K, Braitstein P, Anema A, Bondy G, Montaner JS, Hogg RS. Food insecurity and hunger are prevalent among HIV-positive individuals in British Columbia, Canada. J Nutr 2005; 135(4):820-825. 10. Anema A, Weiser SD, Fernandes KA, Ding E, Brandson
EK, Palmer A, Montaner JS, Hogg RS. High prevalence of food insecurity among HIV-infected individuals re-ceiving HAART in a resource-rich setting. AIDS Care
2011; 23(2):221-230.
11. Anema A, Chan K, Chen Y, Weiser S, Montaner JS, Hogg RS. Relationship between Food Insecurity and Mortality among HIV-Positive Injection Drug Users Receiving Antiretroviral Therapy in British Columbia, Canada. PLoS ONE; 8(5):e61277.
12. Brasil. Ministério da Saúde (MS). Orientações para a coleta e análise de dados antropométricos em serviços de saúde : Norma Técnica do Sistema de Vigilância
Ali-mentar e Nutricional - SISVAN. Brasília: Secretaria de
Atenção à Saúde. Departamento de Atenção Básica. [acessado 2017 set 28]. Disponível em: http://bvsms. saude.gov.br/bvs/publicacoes/orientacoes_coleta_ana-lise_dados_antropometricos.pdf
13. Duran ACFL, Florindo AA, Jaime PC. Can self-report-ed height and weight be usself-report-ed among people living with HIV/AIDS? Int J STD AIDS 2012; 23(4):e1-e6.
14. World Health Organization (WHO). Physical status:
the use and interpretation of anthropometry. Geneva:
WHO Expert Committee. [acessado 2017 jan 31]. Dis-ponível em: http://www.who.int/childgrowth/publica-tions/physical_status/en/
15. Bond T, Fox CM. Applying the Rasch Model: Fundamen-tal Measurement in the Human Sciences, Third Edition,
3rd Edition (Paperback) - Routledge. Third. [acessado
2016 jul 22]. Disponível em: https://www.routledge. com/Applying-the-Rasch-Model-Fundamental-Mea-surement-in-the-Human-Sciences/Bond-Fox/p/ book/9780415833424
16. Derrickson JP, Fisher AG, Anderson JE. The core food security module scale measure is valid and reliable when used with Asians and Pacific Islanders. J Nutr
2000; 130(11):2666-2674.
17. John M Linacre. Winsteps and Facets Comparison. In: Winsteps and Facets Rasch Software. [acessado 2016 set 8]. Disponível em: http://www.winsteps.com/win-fac.htm
18. Francisco PMSB, Donalisio MR, Barros MBA, Cesar CLG, Carandina L, Goldbaum M. Association mea-sures in cross-sectional studies with complex sampling: odds ratio and prevalence ratio. Rev Bras Epidemiol
2008; 11(3):347-355.
19. Brasil. Resolução CNS no. 466, de 12 de dezembro de 2012-Estabelece as diretrizes e normas brasileiras regu-lamentadoras de pesquisas envolvendo seres humanos.
Rev Bras Bioét 2012; 8:105-120.
20. Rezende ELLF, Vasconcelos AMN, Pereira MG. Causes of death among people living with HIV/AIDS in Brazil.
Braz J Infect Dis 2010; 14(6):558-563.
21. Samji H, Cescon A, Hogg RS, Modur SP, Althoff KN, Buchacz K, Burchell AN, Cohen M, Gebo KA, Gill MJ, Justice A, Kirk G, Klein MB, Korthuis PT, Martin J, Napravnik S, Rourke SB, Sterling TR, Silverberg MJ, Deeks S, Jacobson LP, Bosch RJ, Kitahata MM, Goedert JJ, Moore R, Gange SJ; North American AIDS Cohort Collaboration on Research and Design (NA-AC-CORD) of IeDEA. Closing the Gap: Increases in Life Expectancy among Treated HIV-Positive Individuals in the United States and Canada. PLoS ONE 2013; 8(12):e81355.
22. Vianna RPT, Hromi-Fiedler AJ, Segall-Correa AM, Pérez-Escamilla R. Household food insecurity in small municipalities in Northeastern Brazil: a validation study. Food Secur 2012; 4(2):295-303.
23. Weiser SD, Frongillo EA, Ragland K, Hogg RS, Riley ED, Bangsberg DR. Food insecurity is associated with incomplete HIV RNA suppression among homeless and marginally housed HIV-infected individuals in San Francisco. J Gen Intern Med 2009; 24(1):14-20. 24. Swindale A, Bilinsky P. Household dietary diversity score
(HDDS) for measurement of household food access:
indi-cator guide. Washington: Food and Nutrition Technical
Assistance Project, Academy for Educational Develop-ment; 2005.
25. Charão APS, Batista MHRS, Ferreira LB. Food inse-curity of HIV/AIDS patients at a unit of outpatient healthcare system in Brasilia, Federal District, Brazil.
M
ed
eir
os AR
26. Dasgupta P, Bhattacherjee S, Das DK. Food Security in Households of People Living With Human Immu-nodeficiency Virus/Acquired ImmuImmu-nodeficiency Syn-drome: A Cross-sectional Study in a Subdivision of Darjeeling District, West Bengal. J Prev Med Pub Health
2016; 49(4):240-248.
27. Tiyou A, Belachew T, Alemseged F, Biadgilign S. Food insecurity and associated factors among HIV-infected individuals receiving highly active antiretroviral ther-apy in Jimma zone Southwest Ethiopia. Nutr J 2012; 11:51.
28. Weiser SD, Tsai AC, Gupta R, Frongillo EA, Kawuma A, Senkungu J, Hunt PW, Emenyonu NI, Mattson JE, Martin JN, Bangsberg DR. Food insecurity is associated with morbidity and patterns of healthcare utilization among HIV-infected individuals in a resource-poor setting. AIDS Lond Engl 2012; 26(1):67-75.
29. Aibibula W, Cox J, Hamelin A-M, Mamiya H, Klein MB, Brassard P. Food insecurity and low CD4 count among HIV-infected people: a systematic review and meta-analysis. AIDS Care 2016; 28(12):1577-1585. 30. Whittle HJ, Palar K, Seligman HK, Napoles T,
Frongil-lo EA, Weiser SD. How food insecurity contributes to poor HIV health outcomes: Qualitative evidence from the San Francisco Bay Area. Soc Sci Med 2016; 170:228-236.
31. Weiser SD, Yuan C, Guzman D, Frongillo EA, Riley ED, Bangsberg DR, Kushel MB. Food insecurity and HIV clinical outcomes in a longitudinal study of urban homeless and marginally housed HIV-infected individ-uals. AIDS Lond Engl 2013; 27(18):2953-2958. 32. Heylen E, Panicker ST, Chandy S, Steward WT,
Ek-strand ML. Food Insecurity and Its Relation to Psycho-logical Well-Being Among South Indian People Living with HIV. AIDS Behav 2015; 19(8):1548-1558. 33. Castleman T, Seumo-Fosso E, Cogill B. Food and
Nutri-tion ImplicaNutri-tions of Antiretroviral Therapy in Resource Limited Settings. [acessado 2015 jul 21]. Disponível em: http://pdf.usaid.gov/pdf_docs/Pnacw463.pdf
34. Anema A, Vogenthaler N, Frongillo EA, Kadiyala S, Weiser SD. Food insecurity and HIV/AIDS: current knowledge, gaps, and research priorities. Curr HIV/
AIDS Rep 2009; 6(4):224-231.
35. Palermo T, Rawat R, Weiser SD, Kadiyala S. Food Access and Diet Quality Are Associated with Quality of Life Outcomes among HIV-Infected Individuals in Uganda.
PLoS ONE; 8(4):e62353.
36. Kepple AW, Segall-Corrêa AM. Conceptualizing and measuring food and nutrition security. Cien Saude Co-let 2011; 16(1):187-199.
37. UNAIDS. UNAIDS Policy Brief: HIV, Food Security
and Nutrition. [acessado 2015 fev 11]. Disponível em:
http://www.tandfonline.com/doi/abs/10.2989/AJAR. 2009.8.4.4.1041
38. Interlenghi GS, Salles-Costa R. Inverse association be-tween social support and household food insecurity in a metropolitan area of Rio de Janeiro, Brazil. Public
Health Nutr 2015; 18(16):2925-2933.
39. Santos ECM, França Junior I, Lopes F. Quality of life of people living with HIV/AIDS in São Paulo, Brazil. Rev Saude Publica 2007; 41(Supl. 2):64-71.
40. Souza V, Czeresnia D. Demandas e expectativas de usuários de centro de testagem e aconselhamento anti -HIV. Rev Saude Publica 2010; 44(3):441-447.
Article submitted 05/10/2016 Approved 05/05/2017