DOI: 10.1590/1518-8345.1770.2886 www.eerp.usp.br/rlae
Associations between frailty syndrome and sociodemographic
characteristics in long-lived individuals of a community
1Clóris Regina Blanski Grden
2Maria Helena Lenardt
3Jacy Aurelia Vieira de Sousa
2Luciana Kusomota
4Mara Solange Gomes Dellaroza
5Susanne Elero Betiolli
6Objective: investigating the association between frailty syndrome and sociodemographic
characteristics in long-lived individuals of a community. Method: a cross-sectional study with a
proportional stratified sample consisting of 243 long-lived individuals. A structured instrument,
scales and tests that comprise evaluating frailty were applied for data collection. Univariate and
multivariate analyzes were performed by logistic regression (p<0.05) by Statistica 10® software
and Odds Ratio (95% Confidence Interval) were calculated for the predictive models. Results: of
the 243 long-lived individuals evaluated, 36 (14.8%) were frail, 55 (63.8%) were pre-frail and 52
(21.4%) were not frail. A predominance of females (n=161; 66.3%), widows/widowers (n=158;
65%), who lived with family members (n=144; 59.3%) and in a self-reported satisfactory
financial situation (n=108; 44.5%) was observed. A significant association was found between
the demographic variable of age (p=0.043) and frailty syndrome. The best predictor model for
the syndrome included the variables: gender, age and household companion. Conclusion: the
variable of age contributed most to the fragilization process of long-lived individuals residing in
the community. It is essential that gerontological nursing care contemplates early detection of
this syndrome, considering age as being indicative of care needs.
Descriptors: Elderly; Aged, 80 and Over; Frail Elderly; Geriatric Nursing; Socioeconomic Factors;
Aging.
1 Paper extracted from Doctoral Dissertation “Síndrome da fragilidade física e as características sociodemográficas de idosos longevos”,
presented to Departamento de Enfermagem, Universidade Federal do Paraná, Curitiba, Paraná, Brazil.
2 PhD, Adjunct Professor, Departamento de Enfermagem e Saúde Pública, Universidade Estadual de Ponta Grossa, Ponta Grossa, PR, Brazil. 3 PhD, Professor, Departamento de Enfermagem, Universidade Federal do Paraná, Curitiba, PR, Brazil.
4 PhD, Professor, Escola de Enfermagem de Ribeirão Preto, Universidade de São Paulo, WHO Collaborating Centre for Nursing Research
Development, Ribeirão Preto, SP, Brazil.
5 PhD, Adjunct Professor, Departamento de Enfermagem, Universidade Estadual de Londrina, Londrina, PR, Brazil. 6 PhD, Professor, Sociedade Educacional Herrero, Curitiba, PR, Brazil.
How to cite this article
Grden CRB, Lenardt MH, Sousa JAV, Kusumota L, Dellaroza MSG, Betiolli SE. Associations between frailty syndrome and sociodemographic characteristics in long-lived individuals of a community. Rev. Latino-Am. Enfermagem. 2017;25:e2886. [Access ___ __ ____]; Available in: ____________________. DOI: http://dx.doi.org/10.1590/1518-8345.1770.2886.
day
Introduction
The increase in the number of elderly people (also called long-lived individuals or oldest old) at 80 years or more is a world-wide reality. A decrease in physical
reserves and an increase in vulnerability to internal and external stressors is common in this population segment, culminating in the development of physical
frailty(1). Researchers deine it as a medical syndrome with multiple causes and related factors, characterized by a decrease in the body’s homeostatic reserve capacity
and resistance to stressors, which result in cumulative declines in multiple physiological systems causing
vulnerability and adverse clinical outcomes(1-2).
In order to evaluate the syndrome, the frailty/ fragility phenotype stands out, being composed of
markers that include: slow gait, reduced hand grip strength, unintentional weight loss, self-reported exhaustion and low level of physical activity. Long-lived
individuals who do not have any of the markers are considered as not frail, those with one or two markers
are pre-frail, and three or more characterize frail aged adults(2).
The frequency of physical frailty presents great
variability, whether in homogeneous or distinct long-lived populations(3). In younger aged adults (60-69 years), values between 6.9% and 9.3%(2,4) are predominant,
while the index is signiicantly higher for long-lived individuals (≥80 years), ranging from 16% to 26% (3).
High prevalence rates of the syndrome in the national
context do not correspond to the number of publications found in Brazilian gerontology nursing literature or in
general health(5). This suggests the need for further studies investigating the predictive characteristics of the syndrome, since they provide valuable subsidies for care
management. These studies especially focused on long-lived individuals cannot be disregarded, as they are high risk for frailty with a higher probability of changing from
pre-frail to frail(2), and which predisposes this age group to hospitalizations, falls and dependencies.
Among the factors that determine frailty development, some sociodemographic factors stand out even though they are often ignored by the healthcare
team providing care, and they should be systematically investigated in evaluating longed-lived older adults. In developing countries, higher values of frailty in elderly(6)
have been identiied. In investigations carried out in Mexico(7) and Peru(8), researchers have demonstrated frailty associated with sociodemographic variables,
including female gender(7) and age(7-8).
Despite sociodemographic variables that are associated with frailty being known, we highlight a lack of national studies that investigate predictive models of frailty based on these characteristics of the population. In view of the above, the objective of the present study was to investigate the association between frailty syndrome and sociodemographic characteristics of long-lived individuals in a community.
Method
A cross-sectional study developed with long-lived individuals (≥80 years) living in a community of households in an area covered by three Basic Health Units (UBS) belonging to the Boa Vista Sanitary District, in the city of Curitiba, Paraná, Brazil. As criteria the choice of these UBS(9)* was the representativeness of different social strata associated to the greater number of long-lived adults enrolled in the UBS. A proportional stratiied sample was adopted, considering the number of long-lived individuals enrolled in each UBS, so that none of the UBS was over or underestimated. The sample calculation considered the population of long-lived individuals enrolled in the three UBS (N=503), an 80% (1-ß) beta value, a 5% signiicance level (α=0.05) and a 10% signiicant minimum difference between the proportions of long-lived individuals with frailty. The sample size was increased by 10% due to the possibilities of losses and refusals, which resulted in the inal sample being 243 long-lived individuals.
The selection of the aged adults was randomly carried out through a draw based on the list of long-lived individuals registered at the UBSs generated by the city’s electronic system. Home visits were made, and a new name was drawn in cases of refusal or absence (three attempts for each household).
Inclusion criteria were: a) being ≥80 years of age; b) being enrolled in one of the UBS participating in the study; c) scoring higher than the cutoff point in the Mini Mental State Examination (MMSE)(10), which was 13 points for illiterates, 18 for having an average or low education level, and 26 points for having a high education level(11).
The family caregiver was invited to participate in cases where long-lived individuals did not have cognitive conditions (n=36) to answer the research questions, and for which the following inclusion criteria were considered: a) being ≥18 years of age; b) being a family caregiver; c) living with the aged adult for at least three months. Long-lived individuals who were
physically unable to perform the physical tests (n=15) or in chemotherapeutic treatment (n=1) were excluded.
Data collection was carried out from January 2013 to September 2015 by previously trained scientiic initiation fellowship, master’s and doctorate students. A pilot study with ten long-lived individuals was conducted for veriication and adequacy of the instrument.
The structured questionnaire included
sociodemographic variables of interest to the study adapted from the Brazilian Institute of Geography and Statistics(12), and categorized according to statistical recommendation and/or studies that supported the methodology (11): gender (female, male); age (≥80 and
<87, ≥87 and <93, ≥93 and <100 years); marital status (widower, married, single); education level (illiterate, low, average, high); household situation (living alone, living with family members, living with a partner); self-reported inancial situation (unsatisfactory, average, satisfactory); individual monthly income (insuficient ≤1.0 minimum wage (MW), average >1.0 MW and ≤2.0 MW, satisfactory >2 MW) and monthly family income (insuficient ≤2.0 MW, average >2.0 and ≤5.0 MW, satisfactory >5 MW).
Physical frailty markers were evaluated according to the authors’ proposal(2) in the Cardiovascular Health Study (CHS), a prospective and observational reference study conducted in the United States with 5,317 community aged adults between 65 to 101 years of age.
Hand Grip Strength (HGS) was measured with a Jamar® hydraulic dynamometer according to the American Society of Hand Therapists(13). The highest of three obtained measurements presented in kilograms (Kgf) was considered(14), adjusted according to gender and body mass index(2) (BMI=weight/height2), and
values in the lowest ifth were considered frailty markers, as observed in Figure 1.
Gender
Male Female
BMI* Reduced HGS† BMI* Reduced HGS†
BMI ≤23.6 ≤24 kgf BMI ≤23.1 ≤14 kgf
>23.6 BMI ≤25.7 ≤23.2 kgf >23.1 BMI ≤26.1 ≤15.8 kgf >25.7 BMI ≤28.3 ≤21.6 kgf >26.1 BMI ≤29.5 ≤14 kgf
BMI >28.3 ≤25 kgf BMI >29.5 ≤14 kgf *Body mass index †Hand Grip Strength
Figure 1 – Cutoff points adopted by gender according to BMI classiications, which indicated reduced HGS in long-lived participants. Curitiba-PR, Brazil, 2015.
In order to evaluate the Gait Speed (GS) marker, the long-lived participants were instructed to walk a distance of six meters(15) in a usual manner on a lat surface marked by two marks of four meters distance from one
another. Only the intermediate four-meter course was considered to reduce the effects of acceleration and deceleration. Time was measured in seconds by a digital stopwatch and divided by the four-meter trajectory, thus resulting in a GS in meters/second, as according to an international study(2).
The results were adjusted according to gender and height(2), and then divided into two categories based on
the median (50th percentile): men ≤166 cm and women ≤152 cm (below or equal to the median); and men > 166 cm and women > 152 cm (above the median). The cutoff points were set in the lower ifth(2) for each category with the following values for men and women, respectively: below or equal to the median of ≥9.65 s and ≥13.0 seconds; and above the median of ≥7.97 s and ≥11.6 seconds. Values equal to or greater than the cutoff points on the walking test were considered as markers for the syndrome.
Unintentional weight loss was veriied according to participants’ self-report regarding the following questions: a) Have you lost weight in the last twelve months? b) If so, how many kilos? The caregiver was consulted if they did not remember their weight a year ago. Unintentional (without diet or exercise) weight loss reported as greater than or equal to 4.5 kg in the last twelve months was considered a marker for physical frailty(2).
Fatigue/exhaustion was evaluated based on self-reporting for a question from the Depression Scale of the Center of Epidemiological Studies(16): “Do you feel full of energy?” A visual scale was used to measure energy level using a ruler numbered from zero to ten, with zero being the minimum energy level and ten the maximum. Negative responses provided by long-lived individuals to the question associated with an energy value equal to or less than three points on the ruler were considered as a marker for the syndrome(17).
The reduction in physical activity level was evaluated using the “Physical Activity Level Questionnaire for the Aged” - CuritibAtiva. The validated instrument(18) contains twenty questions subdivided into: systematic practice of physical activities (n=7); heavy household or occupational tasks (n=7); and social and leisure activities (n=6). The questions refer to the frequency and duration of the activities performed in the last week, and the score is converted into the following classiication: inactive (0-32); slightly active (33-82); moderately active (83-108); active (109-133); very active (≥134). Classiications compatible with the inactive and slightly active groups were considered as a marker for the syndrome.
The results were tabulated and analyzed in
obtained through distribution of absolute and relative
frequency, mean, standard deviation, mode and median. The association between frailty and independent variables was analyzed by the chi-square test, with
p<0.05. Two groups were analyzed (Cluster analysis) in the multivariate model using logistic regression, which lead to merging the pre-frail and not frail categories. The priority response for prediction was deined as the frail response, and the other category (not frail) was
attributed as its complement in order to follow a model associated with a binomial distribution.
A complete predictive model was developed for frailty in which all variables of the study were
included. Using the Forward Stepwise method, the sociodemographic variables were individually entered into multiple logistic regression analyzes, starting with those that showed a lower individual p-value for the complete model. The Likelihood Ratio Test (LRT) was
implemented for selecting the models, and the quality of it was assessed by Deviance analysis. The respective Odds Ratio (OR) and Conidence Interval (CI) of 95% were also calculated.
The study complied with national and international standards of research ethics involving human subjects, and was approved by the Research Ethics Committee in Human Beings of the institution under registration CEP/
SD: 156.413.
Results
For physical frailty, 36 (14.8%) of the long-lived individuals were classiied as frail, 52 (21.4%) as not frail, and 155 (63.8%) as pre-frail. A predominance of females (n=161; 66.3%), in the age group ≥ 80 to <87 years (n=181; 74.5%), with a mean age of 84.4
(SD=3.8) was observed. The majority were widowed (n=158; 65%), with a low education level (n=137; 56.4%), and living with family members (n=144; 59.3%). Of the participants, 108 (44.5%) considered their inancial situation satisfactory; however, most of the long-lived individuals (n=181; 74.5%) reported their individual monthly income as insuficient (receiving up to a minimum wage)**
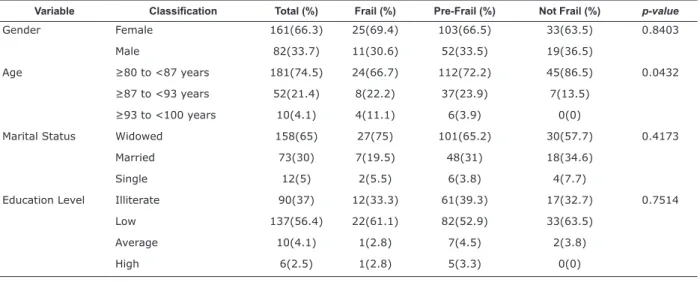
*. Regarding frail individuals (n=36; 14.8%), the majority were females (n=25; 69.4%), widowed (n=27; 75%), living with family members (n=28; 77.7%), with average inancial situation (n=16; 44.4%) and individual and familiar monthly income classiied as insuficient, in the same frequency (n=28; 77.8%). There was a signiicant association between age (p=0.0432) and frailty (Table 1).
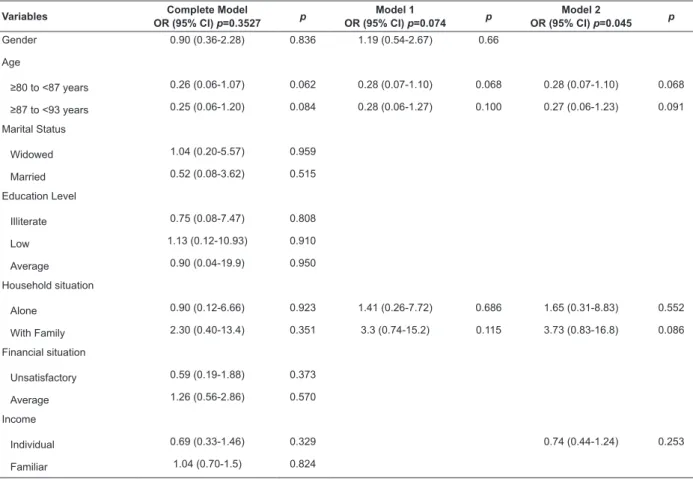
Three predictive logistic models of frailty for long-lived individuals were carried out. The complete model (p=0.352) included the variables of gender, age, marital status, household situation, education level, inancial situation, individual and family income. Model 1 (p=0.075) included gender, age and household situation. Model 2 (p=0.045) considered the variables age, household situation and individual income. No signiicant associations were found between the models (Table 2).
The complete model presented a higher predictive value (62.5%) and specificity (60.8%). Model 1 had better sensitivity (77.7%), lower predictive value (48.1%) and specificity (42.9%). Model 2 presented worse sensitivity (69.4%), with a predictive value of 57.2% and specificity of 55% (Table 3). The choice for the best prediction model of frail long-lived individuals considered the parsimony rule and a higher index of sensitivity. Thus, we opted for the choice of Model 1.
* Current MW value at data collection, R$678.00, with an equivalent value in dollars corresponding to $295.00USD.
Table 1 – Association between frailty and sociodemographic characteristics in long-lived individuals by levels of frailty. Curitiba, PR, Brazil, 2015
Variable Classiication Total (%) Frail (%) Pre-Frail (%) Not Frail (%) p-value
Gender Female 161(66.3) 25(69.4) 103(66.5) 33(63.5) 0.8403
Male 82(33.7) 11(30.6) 52(33.5) 19(36.5)
Age ≥80 to <87 years 181(74.5) 24(66.7) 112(72.2) 45(86.5) 0.0432
≥87 to <93 years 52(21.4) 8(22.2) 37(23.9) 7(13.5)
≥93 to <100 years 10(4.1) 4(11.1) 6(3.9) 0(0)
Marital Status Widowed 158(65) 27(75) 101(65.2) 30(57.7) 0.4173
Married 73(30) 7(19.5) 48(31) 18(34.6)
Single 12(5) 2(5.5) 6(3.8) 4(7.7)
Education Level Illiterate 90(37) 12(33.3) 61(39.3) 17(32.7) 0.7514
Low 137(56.4) 22(61.1) 82(52.9) 33(63.5)
Average 10(4.1) 1(2.8) 7(4.5) 2(3.8)
Variable Classiication Total (%) Frail (%) Pre-Frail (%) Not Frail (%) p-value
Household (living situation)
Alone 65(26.7) 6(16.7) 41(26.5) 18(34.6) 0.1088
With family members 144(59.3) 28(77.7) 89(57.4) 27(51.9)
With partner 34(14) 2(5.6) 25(16.1) 7(13.5)
Financial situation Unsatisfactory 47(19.3) 5(13.9) 33(21.3) 9(17.3) 0.7379
Average 88(36.2) 16(44.4) 54(34.8) 18(34.6)
Satisfactory 108(44.5) 15(41.7) 68(43.9) 25(48.1)
Individual Monthly Income
Insuficient 181(74.5) 28(77.8) 117(75.5) 36(69.2) 0.7422
Average 51(21) 7(19.4) 32(20.6) 12(23.1)
High 11(4.5) 1(2.8) 6(3.9) 4(7.7)
Monthly Family Income
Insuficient 182(74.9) 28(77.8) 114(73.5) 40(76.9) 0.5328
Average 54(22.2) 7(19.4) 38(24.6) 9(17.3)
High 7(2.9) 1(2.8) 3(1.9) 3(5.8)
Total 243(100) 36(14.8) 155(63.8) 52(21.4)
Table 2 – Predictive models for frailty in long-lived individuals, according to sociodemographic variables. Curitiba, PR, Brazil, 2015
Variables Complete Model
OR (95% CI) p=0.3527 p
Model 1
OR (95% CI) p=0.074 p
Model 2
OR (95% CI) p=0.045 p
Gender 0.90 (0.36-2.28) 0.836 1.19 (0.54-2.67) 0.66
Age
≥80 to <87 years 0.26 (0.06-1.07) 0.062 0.28 (0.07-1.10) 0.068 0.28 (0.07-1.10) 0.068 ≥87 to <93 years 0.25 (0.06-1.20) 0.084 0.28 (0.06-1.27) 0.100 0.27 (0.06-1.23) 0.091 Marital Status
Widowed 1.04 (0.20-5.57) 0.959
Married 0.52 (0.08-3.62) 0.515
Education Level
Illiterate 0.75 (0.08-7.47) 0.808
Low 1.13 (0.12-10.93) 0.910
Average 0.90 (0.04-19.9) 0.950
Household situation
Alone 0.90 (0.12-6.66) 0.923 1.41 (0.26-7.72) 0.686 1.65 (0.31-8.83) 0.552
With Family 2.30 (0.40-13.4) 0.351 3.3 (0.74-15.2) 0.115 3.73 (0.83-16.8) 0.086
Financial situation
Unsatisfactory 0.59 (0.19-1.88) 0.373
Average 1.26 (0.56-2.86) 0.570
Income
Individual 0.69 (0.33-1.46) 0.329 0.74 (0.44-1.24) 0.253
Familiar 1.04 (0.70-1.5) 0.824
Table 3 – Comparison between predictive models for frailty in long-lived individuals. Curitiba, PR, Brazil, 2015.
Complete Model Model 1 Model 2
p-value 0.352 0.074 0.045
Prediction model 62.50% 48.10% 57.20%
Sensitivity 72.20% 77.70% 69.40%
Discussion
The condition of pre-frailty and frailty was signiicantly higher when compared to the Cardiovascular Health Study (CHS), which showed a prevalence of 46.6% of pre-frail older adults and 6.9% of frail older adults in a sample of 5,317 older/aged individuals, between 65 and 101 years old(2). This result is due in part to the characteristic of the studied population, since
they are older individuals aged 80 years or more. Results close to the present study are presented in cross-sectional surveys with 1,327 Spanish older adults (≥65 years), who identiied 19.1% frail adults among the older adults in the group aged ≥75 years(19); and the Frailty in Older Brazilian People Network (FIBRA) carried out in seven Brazilian cities revealed 19.7% as frail and 57.2% as pre-frail(20) among the 512 long-lived individual participants. The high number of frail and pre-frail participants identiied in this study similar to those long-lived individuals in the aforementioned investigations(19-20) supports the relevance of preventive or therapeutic intervention actions in the care of long-lived individuals, with the objective of delaying or avoiding hospitalizations, falls and dependence, which are typical situations and events that occur due to physical frailty.
Regarding the general characterization of the sample, the indings are similar to the results of national studies with long-lived individuals, which have indicated a greater number of women with a mean age of 84.4 years, widowed, with z low education level(21-22), living
with a partner and/or family members(21) and receiving up to one minimum wage(22). It is noticed that they are older women, with years marked only by the increase in life expectancy, who, nonetheless survive in undesirable physical and socioeconomic conditions, and for whom there is no speciic care policy in force.
We observed that long-lived women were twice as frail as long-lived individuals, however, a signiicant association was found between the female gender and frailty. It can be inferred that this result is due to the quantitative study participants, which represent a local reality in the South of Brazil. This result differs from others found in the literature which demonstrate such an association(2,19-20). Among the contributory factors are physiological characteristics, unfavorable psychological and social conditions, stressors that interfere in the health status and contribute to an increase of accumulated deicits.
Among octogenarians (in their 80’s) and nonagenarians (90’s), the frequency of the syndrome did not increase with age, which can be explained by the categorization of the age groups which caused
stratiication of the aged population. However, univariate analysis revealed a signiicant association between age and frailty, similar to international and national studies(3-5).
The signiicant increase in frail older adults in advanced ages suggests progressive condition of the syndrome, which is determined by physiological factors that can justify this relationship. In the perspective of the model proposed by North American authors(2), the aging process predisposes individuals to develop physical frailty, and it can be related to changes and the decline of multiple systems, resulting from physiological mechanisms and pathological conditions(2) which may
be relected in accumulated damage to the health and functionality of the aged individual(20).
An analysis of marital status pointed to a higher proportion of frail widowed older adults, as expected for the age range of the study population and the predominantly female composition of the sample. A similar result was identiied in other investigations(5,19). However, unlike the longitudinal study with 1887 younger Italian aged adults, no signiicant association between widowhood and physical frailty was identiied(23). We highlight that widowhood can contribute to social and family isolation, and therefore lead to developing self-care deicit due to lack of encouragement from a partner. It is noteworthy that more than half of the frail individuals had 1 to 4 incomplete years of study; however, this variable was not associated with the syndrome, corroborating a national study with community aged adults(5). Nevertheless, a study conducted with 1,933
Mexican older adults at 65 years of age or older identiied a higher probability of the syndrome in the aged with lower education levels (OR=2.51)(7).
Despite developing countries having higher rates of illiteracy and lower education levels, a signiicant association between education level and the syndrome is found in developed countries such as Spain(19) and Japan(4). In this sense, the educational level can be considered a protection factor, since it provides individuals with better access to information and services, as well as inancial resources and employment opportunities.
The household situation variable had no signiicant association for the frail older adults, similar to a study developed with 203 aged people from Curitiba, whose objective was to investigate the association between frailty syndrome and sociodemographic and clinical characteristics of aged adult primary care users (24). This result differs from those of other studies that observed this relationship among older adults who lived with family members(25) and those living alone(2,4,7). Social
health maintenance, promoting adaptive behavior in
stress situations.
Regarding the inancial situation, no signiicant association between individual and family monthly income with the syndrome was found. However, some authors indicate that aged adults with unfavorable or insuficient income are more frail(7-8). Socioeconomic conditions can trigger the physical frailty cycle in the aged as they hinder access to adequate food, health services, medicine and to practicing physical exercise, predisposing the individual to diseases and decreased functional capacity.
The predictive model of physical frailty chosen included variables that were associated with the
syndrome: gender, age and household. Studies highlight advanced age and female gender as conditions strongly present in predictive models of frailty, both in the national(5) and international context(2,25).
The present study indicated greater chances of physical frailty in participants who lived with
family members. This relationship was also observed (p=0.012)(25) similarly to a multicentric cross-sectional study conducted with 1,126 aged Turkish people investigating characteristics, prevalence and associated factors related to this syndrome in older adults. Higher odds of developing the syndrome in participants residing
with family members can be attributed to the condition of long-lived individual’s presenting some type of dependency (physical, inancial or psychological), which may contribute to or accelerate the frailty process.
The cross-sectional design was a limiting factor in evaluating cause and effect relationships. Moreover, the
sampling is representative of a local community, and therefore the results cannot be extrapolated to other territories. We suggest that further longitudinal, cohort, and population studies that allow for observing physical frailty levels in long-lived individuals and a deeper exploration of the relationship between the syndrome
and sociodemographic variables be carried out.
Based on these results, we suggested that health professionals consider sociodemographic variables for screening physical frailty, seeking early identiication of the syndrome. Thus, nursing care performed in basic care units can be targeted to speciic groups of older adults and/or families (women, with advanced age, living with their family members) as an attempt to delay the frailty process and avoiding its negative outcomes.
Conclusion
Regarding the investigated sociodemographic variables, we can conclude that age signiicantly contributed to the frailty process in long-lived individual
users of basic health care (units). The results show the inluence of the aging process on the syndrome’s occurrence, and it supports biological characteristics of the physical frailty phenotype proposed by North American authors.
References
1. Morley JE, Vellas B, Kan GAV, Anker SD, Bauer
JM, Bernabei R, et al. Frailty consensus: a call to action. JAMDA. 2013;14(6):392-7. doi: http://dx.doi. org/10.1016/j.jamda.2013.03.022.
2. Fried L, Tangen CM, Walston J, Newman AB, Hirsch C, Gottdiener J, et al. Frailty in older adults: evidence for a phenotype. J Gerontol A Biol Sci Med Sci. [Internet]. 2001
[Access March 22, 2015];56A(3):146-56. Disponível em: http://www.ncbi.nlm.nih.gov/pubmed/11253156. 3. Shamliyan T, Talley KM, Ramakrishnan R, Kane RL. Association of frailty with survival: a systematic literature review. Ageing Res Rev. 2013;2(12):719-36. doi: http://dx.doi.org/10.1016/j.arr.2012.03.001. 4. Chen S, Honda T, Chen T, Narazaki K, Haeuchi Y,
Supartini A, et al. Screening for frailty phenotype with objectively-measured physical activity in a west Japanese suburban community: evidence from the Sasaguri Genkimon Study. BMC Geriatr. 2015;15(36):1-10. doi: http://dx.doi.org/2015;15(36):1-10.1186/s12877-015-0037-9. 5. Pegorari M.S, Tavares DMS. Factors associated with the
frailty syndrome in elderly individuals living in the urban área. Rev. Latino-Am. Enfermagem. 2014;22(5):874-82. doi: http://dx.doi.org/10.1590/0104-1169.0213.2493. 6. Guessous I, Luthi JC, Bowling CB, Theler JM, Paccaud F, Gaspoz JM, et al. Prevalence of frailty indicators and association with socioeconomic status in middle-aged
and older adults in a swiss region with universal health insurance coverage: a population-based cross-sectional study. J Aging Res. 2014;2014:1-8. doi: http://dx.doi. org/10.1155/2014/198603.
7. Sánchez-García S, Sánchez-Arenas R, García-Peña C, Rosas-Carrasco O, Avila-Funes JA, Ruiz-Arregui L, et
al. Frailty among community-dwelling elderly Mexican people: prevalence and association with sociodemographic characteristics, health state and the use of health services. Geriatr Gerontol Int. 2014;14(2):395-402. doi: http://dx.doi.org/10.1111/ggi.12114.
8. Runzer-Colmenares FM, Samper-Ternent R, Al Snih
Received: July 4th 2016
Accepted: Mar. 1st 2017
Copyright © 2017 Revista Latino-Americana de Enfermagem This is an Open Access article distributed under the terms of the Creative Commons (CC BY).
This license lets others distribute, remix, tweak, and build upon your work, even commercially, as long as they credit you for the original creation. This is the most accommodating of licenses offered. Recommended for maximum dissemination and use of licensed materials.
Corresponding Author: Clóris Regina Blanski Grden Universidade Federal do Paraná Av. Pref. Lothario Meissner, 632 Jardim Botânico
CEP: 80210-170, Curitiba, PR, Brasil E-mail: [email protected]
set 2014]. Disponível em: http://www.abep.org/new/ Servicos/Download.aspx?id=01.
10. Folstein MF, Folstein SE, McHugh PR. “Mini-mental state”: a practical method for grading the cognitive state of patients for the clinician. J Psychiatr Res. 1975;12(3):189-98. doi: http://dx.doi. org/10.1016/0022-3956(75)90026-6.
11. Bertolucci PH, Brucki SM, Campacci SR, Juliano Y. The Mini-Mental State Examination in a general popula-tion: impact of educational status. Arq. Neuropsiquiatr. 1994 ;52(1):1-7. doi: http://dx.doi.org/10.1590/ S0004-282X1994000100001.
12. Instituto Brasileiro de Geograia e Estatística (IBGE). Censo Demográico 2000 – Migração e deslocamento. 2000. Questionário da Amostra CD 1.02. 2000. [Internet]. [Acesso 17 fev 2012]. Disponível em: http://www.ibge.gov.br/home/estatistica/populacao/ censo2000/populacao/censo2000_populacao.pdf 13. Fess EE. Grip strength. In: Casanova JS. American Society of Hand Therapists. Clinical assessment recommendations. Chicago: American Society of Hand Therapists (ASHT); 1992.
14. Hollak N, Soer R, Woude LH, Reneman MF. Towards a comprehensive functional capacity evaluation for hand function. Appl Ergon. 2014;45(3):686-92. doi: http:// dx.doi.org/10.1016/j.apergo.2013.09.006.
15. Studenski S, Perera S, Patel K, Rosano C, Faulkner K, Inzitari M, et al. Gait speed and survival in older adults. JAMA. 2011;305(1):50-8. doi:http://dx.doi.org/10.1001/ jama.2010.1923.
16. Radloff LS. The CES-D scale: a self-report depression scale for research in the general population. Appl Psychol Meas. 1977;1(3):385-401. doi: http://dx.doi. org/ 10.1177/014662167700100306.
17. Retornaz F, Monette J, Batist G, Monette M, Sourial N, Small D, et al. Usefulness of frailty markers in the assessment of the health and functional status of older cancer patients referred for chemotherapy: a pilot study. J Gerontol A Biol Sci Med Sci. [Internet]. 2008 [Access March 12, 2015];63(5):518-22. Available from: http:// www.ncbi.nlm.nih.gov/pubmed/18511757.
18. Rauchbach R, Wendling NMS. Evolução da construção de um instrumento de avaliação do nível de atividade física para idosos - Curitibativa. FIEP Bull. [Internet]. 2009 [Acesso 12 março 2015];79(n.esp.):543-7.
Disponível em: http://www.iepbulletin.net/index.php/ iepbulletin/article/view/3405.
19. Castell MV, Sânchez M, Julián R, Queipo R, Martín S, Otero A. Frailty prevalence and slow walking speed in persons age 65 and older: implications for primary care. BMC Fam Pract. 2013;14(86):1-9. doi: http://dx.doi. org/10.1186/1471-2296-14-86.
20. Neri AL, Yassuda MA, Araújo LF, Eulálio MC, Cabral BE, Siqueira MEC, et al. Methodology and social, demographic, cognitive, and frailty proiles of community-dwelling elderly from seven Brazilian cities: the FIBRA Study. Cad Saúde Pública. 2013;29(4):778-92. doi: http://dx.doi. org/10.1590/S0102-311X2013000400015.
21. Pereira LF, Lenardt MH, Michel T, Carneiro NCH. Socioeconomic and demographic proile of older elderly users of a primary health unit. Cogitare Enferm. [Internet]. 2014 [Access March 12, 2015];19(4):709-16. Available from: http://revistas.ufpr.br/cogitare/ article/view/35516/23933.
22. Leonardo KC, Talmelli LFS, Diniz MA, Fhon JRS, Fabrício-Wehbe SCC, Rodrigues RAP. Assessment of cognitive status and frailty of elder elderly living at home. Cienc Cuid Saude. 2014;13(1):120-27. doi: http://dx.doi.org/10.4025/cienccuidsaude.v13i1.20033. 23. Trevisan C, Veronese N, Maggi S, Baggio G, De Rui M, Bolzetta F, et al. Marital Status and Frailty in Older People: Gender Differences in the Progetto Veneto Anziani Longitudinal Study. 2014;25(6):630-7. doi: 10.1089/jwh.2015.5592.