Electronic cephalometric diagnosis:
Contextualized cephalometric variables
Marinho Del Santo Jr*, Luciano Del Santo**
Introduction: Classical parametric assessments and isolated cephalometric variables may
not provide the best information in craniofacial morphology. Rather, contextualized cephalometrics can be more promising, since it allows for integration among weighty cephalometric variables. Objective: The main purpose of this manuscript is to present the application of a non-trivial mathematical model in cephalometrics, providing data mining by filtering certainty and contradiction in each network “node”. Methods: In the proposed “neural network”, each “cell” is connected to others “cells” by “synapses”. Such decision-making system is an artificial intelligence tool tailored to potentially increase the meaning of assessed data. Results: The comparison between the final diagnosis pro-vided by the paraconsistent neural network with the opinions of three examiners was heterogeneous. Kappa agreement was fair for anteroposterior discrepancies, substantial or fair for vertical discrepancies and moderate for dental discrepancies. For the bimax-illary dental protrusion, the agreement was almost perfect. Similarly, the agreement among the three examiners, without any software aid, was just moderate for skeletal and dental discrepancies. An exception was dental protrusion, which agreement was almost perfect. Conclusions: In conclusion, the analysis of performance of the developed tech-nology supports that the presented electronic tool might match human decisions in the most of the events. As an expected limitation, such mathematical-computational tool was less effective for skeletal discrepancies than for dental discrepancies.
Abstract
Keywords: Cephalometric diagnosis. Non-trivial logics. Artiicial intelligence.
IntROduCtIOn
In orthodontics, as in any other medical or den-tal specialty, it is possible to apply mathematical parameters to biological systems. Before the prem-ises are set, the evidences may be considered as co-incidences or as “truth”, although “truth” may hold significant uncertainty or contradiction.
Routinely, cephalometric data have been exten-sively described in the orthodontic literature. With no doubt, the most of such data is expressed by means and standard deviations. Central tendency measurements are frequently criticized because they present just a general view of a specific problem, far less than the desired individualized information.
Therefore, with clear limitation, means and standard deviations force the orthodontist to allo-cate each variable in certain pre-determined class-es, many times academically well accepted, howev-er, not always biologically proofed. The values can be interpreted with a “flexible” allocation, allowing that a value refers to two sequential classes, with certain degree of pertinence to each one of them. In this case, the application of mathematical val-ues to the understanding of natural phenomena is probably better.
With such support, the theory of the fuzzy log-ic1,2 was presented. According to such theory, val-ues are pertinent to more than a pre-determined class, what means that a specific value may refer to two sequential classes, with certain degree of pertinence to each one. The fuzzy logic was ap-plied in orthodontics to select types of headgears3, to evaluate the visual subjective judgment of the anteroposterior relationship between maxilla and mandible4,5 and to establish non-surgical treatment plans.6 However, a mathematical model based upon fuzzy and paraconsistent logic in order to contextualized cephalometric data has not been presented.
In general, cephalometric is limited because cephalometric variables hold important degrees of imprecision when individually analyzed. With-out the “whole picture”, there is no clear “gestalt”
about the craniofacial architecture of each person, what means that there is no trustable screening of a possible discrepancy and its degree of severity. Such limitations make the clinical application of cephalometry less effective than what is expected by clinical orthodontists.
A better scenario would be to setup specific software that could quantify how much “noise” is carried by each cephalometric variable, weighing its relative contribution to a general index of dis-crepancy. Such approach would offer a significant progress in regard to the current cephalometric comparisons, which are simple measurements of central tendency, as means and standard deviations.
Furthermore, the application of paraconsistent logic7-10 allows the mathematical modeling of im-precise and inconsistent data. Therefore, it is pos-sible to detect and control contradictions, targeting to provide more and better answers to old prob-lems. In this study, the paraconsistent logic was applied to contextualize selected cephalometric variables, throughout neural networks, which con-sidered the degrees of certainty and contradiction in each one of its “cells”.
PROPOsItIOn
The goals of this project are:
1. To present a mathematical-computational model to process interactions among cepha-lometric values.
2. To validate the performance of such artificial intelligence tool, comparing to the opinions of three specialists in orthodontics, even not having a golden standard for such approach. 3. To classify in a ranking the degree of agree-ment between the opinion of the examiners and the electronic cephalometric diagnosis, in specific parts or dimension of the cranio-facial complex.
MAteRIAl And MethOds
2
16
7
9 1
5
4 6
3
12
17 8 15
13 14 11
11
3 1
4 2
15
10
14
9 8
7 6
13
12 5
10 18
1. Basion (Ba): the most inferior posterior point on the posterior margin of the foramen mag-num.
2. Sella (S): the center of the pituitary fossa of the sphenoid bone.
3. Nasion (N): the junction of the frontal and nasal bones, at the fronto-nasal suture. 4. Pterygo-maxillary fissure (PtgI): the most
in-ferior point of the pterygo-maxillary fissure. 5. Posterior nasal spine (PNS): the most
poste-rior point on the bony hard palate.
6. Anterior nasal spine (ANS): the tip of the median anterior bony process of the maxilla. 7. Upper molar: the most inferior point of the mesial cuspid tip of the first upper molar, posterior reference for the occlusal plane. 8. Anterior reference of the occlusal plane:
es-tablished by bisecting the overbite or open-bite of the incisors, considering the incisal edges of the upper and lower incisors. 9. Gonion (Go): the most postero-inferior
point of the angle of the mandible.
10. Menton (Me): the most inferior point on the mandibular symphysis.
11. Gnathion (Gn): the most anterior and infe-rior point on the contour of the symphysis. Determined by bisecting the angle formed by the mandibular plane (Go-Me) and the Nasion-Pogonion line.
12. A Point: the most posterior point on the anterior curvature of the maxilla.
13. B Point: the most posterior point on the anterior curvature of the mandibular sym-physis.
14. Pogonion (Pg): the most anterior point on the contour of the bony chin.
15. Upper incisor edge: the incisal tip of the maxillary central incisor.
16. Upper incisor apex: the root tip of the maxillary central incisor.
17. Lower incisor edge: the incisal tip of the mandibular central incisor.
18. Lower incisor apex: the root tip of the mandibular central incisor.
FIGURE 1 - Selected cephalometric variables.
FIGURE 2 - Cephalometric analysis. 1. Anterior Cranial Base 2. Palatal Plane (PP) 3. Occlusal Plane (OP) 4. Mandibular Plane (MP) 5. Cranial Base 6. Y Axis
7. Posterior Facial Height
8. Anterior Facial Height – Middle Third 9. Anterior Facial Height – Lower Third 10. Anterior Facial Height
11. SNA 12. SNB
13. Long Axis – Upper Incisors 14. Long Axis – Lower Incisors 15. A Point – Pogonion Line
F
-1 0 +1
τ
τ
µ +1 λ
-1
FIGURE 3 - Description and graphic illustration of the “basal cell” of the paraconsistent logics. µ = Certainty axis, i.e., favorable evidence.
• Positive values indicate the degree of trueness. • Negative values indicate the degree of falseness.
λ = Contradiction axis, i.e., unfavorable evidence. • Positive values indicate the degree of inconsistency.
•Negativevaluesindicatethedegreeofignorance.
Extreme States: T = +1; Absolutely True F = -1; Absolutely False
┬ = +1; Absolutely Inconsistent
┴ = -1; Absolutely Unknown
The means and standard deviations of the de-scribed cephalometric measurements (Fig 2) were provided by a Brazilian cephalometric atlas.11 The values were allocated by age and gender and the means and standard deviation were z-scored, be-fore the mathematical modeling.
The selected cephalometric variables were di-vided in three units:
» Unit I: related to the anteroposterior discrep-ancy. Variables: divided into two levels of infor-mation (level 1 prioritized to level 2). The level 1 included the variables ANB and Wits. In the level 2, there was a composition of the results of level 1 with the variables SNA and SNB.
» Unit II: related to the vertical skeletal dis-crepancy.12 Variables: 1) S-Go/N-Me Proportion; 3) Y Axis angle and; 3) SN/PP, SN/OP and SN/ MP angles.
» Unit III: related to the dental discrepan-cies. Variables: divided into three different levels (without priority): 1) Upper incisors: U1.PP angle, U1.SN angle and the linear measurement U1-NA, taking in account the SNA angle (from Unit I); 2) Lower incisors: L1.APg angle, L1.NB angle, L1.GoMe angle and the linear measurements L1-APg and L1-NB, taking in account the SNB angle (from the unit 1); 3) Relationship between the upper and lower incisors: U1.L1 angle.
lIMItAtIOns Of the COnventIOnAl CePhAlOMetRIC AssessMent
Considering that the average of the ANB angle for a young adult (18 year-old male) is 2° (Skele-tal Class I) and the orthodontist wants to evaluate the anteroposterior relationship using such cepha-lometric reference, even assuming that significant limitation is involved, let us describe such conven-tional cephalometric diagnostic process.
It is well known that the use of cephalometric variables assumes landmark location, tracing re-producibility, clinical significance errors and oth-ers. To exemplify some of them, in such particular case, the ANB value may incorporate errors such as the position of the Nasion (due to the length and/or inclination of the anterior cranial base), the limited identification of A point and the verti-cal facial features of the assessed patient. Observe that such errors may be due to the limitations of the cephalometric method or due to the geo-metrical camouflage. Geogeo-metrical camouflage is, for instance, the ANB angle be smaller than the actual discrepancy because of a long or steep an-terior cranial base.
Independent of the nature of the limitation, methodological or geometrical, the possible use of the ANB angle takes to the next question: “In this specific case, which value for the ANB angle
certainty
F
F F
0 -1
-1 -1
-6º -2º 2º 6º 10º
-1
-1 -1
+1
+1 +1
+1
+1 +1
τ
τ τ
τ
τ
τ τ
τ µ
µ µ
µ
λ
λ λ
λ would be coherent with an actual scenario of
skel-etal Class II or Class III?” In the most of the cases, the answer is not clear. Other cephalometric in-formation as Wits, SNA, SNB (and many others) could be elected to help to answer such question.
neuRAl netwORK And PARACOnsIstent lOgIC
The model of “artificial intelligence” applied in the current project, targeting to enhance the meaning of conventional cephalometric data, makes decisions in each one of the “nodes” of the proposed neural network, filtering degrees of cer-tainty and contradiction. As a result, in each as-sessed case, degrees of evidence of abnormality
quantify the favorable and unfavorable evidences for each attribute of interest, for each region or dimension considered by the program.
COntextuAlIzIng
CePhAlOMetRIC vARIAbles
The statement can be formulated under a dif-ferent view: “In this case, how high or low/nega-tive is necessary for the value of ANB to allow certainty that it is a skeletal Class II (or Class III)?” Such quantification is represented by the axis [µ] (Certainty Axis, Fig 3). An extremely high ANB value, which clearly indicates a skeletal Class II, could be, for instance, 10° (Fig 4). It can be af-firmed that, if ANB is equal or higher than 10°,
FIGURE 4 - Borderline zone.
FIGURE 6 - The [µ] values distant from the norm correspond to the de-crease of the [λ] values.
FIGURE 5 - Examples of ANB angles.
FIGURE 7 - The [µ] values near to the norm correspond to the increase of the [λ] values.
T for Class III
F for Class II
T for Class II
F for Class III ANB to diagnose skeletal
Class II or III
-0.5 +0.5
+0.5
-0.5 Borderline zone T
T = +1 and the individual clearly presents a skele-tal Class II. In the same manner, an extremely low value for skeletal Class III could be, for instance, -6° (Fig 5). If ANB is equal to or lower (negative) than -6°, F=-1, and the individual clearly does not present a skeletal Class II. Degrees of trueness (T) and falseness (F) are represented with a “mirror image” (Fig 5) in order to show the possibility of the discrepancy to be a scenario of skeletal Class II or skeletal Class III.
The intermediary values, in between the ex-treme states already mentioned, are located in the borderline zone 0.5 ≤ µ ≤ 0.5 (Fig 4); that means that the graphic shows ANB values, that in this case, cannot guarantee trueness or false-ness of the occurrence of events like skeletal Class II or Class III.
Over the [µ] axis, as far as the ANB value is distant from the norm, the degree of contradiction showed in the [λ] decreases, for skeletal Class II or III, since such ANB angle reflects with lesser un-certainty a skeletal discrepancy (see arrows, Fig 6). When the ANB angle is close to the norm (or is the norm), the scenario of a skeletal discrep-ancy only occurs if the information “ANB angle” is significantly inconsistent or unknown (see arrows, Fig 7). If [λ] is the extreme value ┬ = +1, means that is absolutely inconsistent with the scenario of a skeletal Class II or Class III and if [λ] is the extreme value ┴ = -1, means that the value is ab-solutely unknown to identify such scenario.
sAMPle fOR vAlIdAtIOn Of the PROPOsed MOdel
The sample for validation consisted of 120 cephalometric tracings, retrospectively analyzed, of Caucasian individuals which sought for orth-odontic treatment in a private office, which ra-diographs were consecutively selected form the files of the author. Such sample included 53 males and 67 females, from 06 to 53 year-old. Twenty two patients (18.3%) were older than 18 year-old and were considered adults. The
inclu-sion criteria for this specific sample were: 1) To be Caucasian (to match the data of the atlas11) and; 2) To have a lateral radiograph taken in the same cephalostat (Lúmina Radiologia, São Paulo, SP, Brazil). The exclusion criteria were: 1) To present any craniofacial deformity or syndrome and; 2) Radiographs with bad quality (head posi-tioning or processing).
dAtA COlleCtIOn
The lateral radiographs were traced by an orthodontist-operator and digitalized by other operator. A 0.03 mm mechanical pencil and orthodontic acetate paper were used for the orthodontic tracing. The tracings were digi-talized in the Summasketch III table (Summa-graphics Corporation, Scottsdale, AZ, USA) and collected by software developed to operate the cephalometric electronic system (Iris Informáti-ca, São Paulo, SP, Brazil).
systeMAtIC And MethOd eRRORs
In order to calculate the systematic and meth-od errors (Dahlberg13 formula), a sub-sample of 15 radiographs, chose by random selection (one in every five radiographs, starting with the 20th case of the sample) was re-traced and re-dig-italized, in a 4 week interval. Taking into con-sideration both operators, there was no statisti-cally significant systematic error for any assessed cephalometric variable. Taking into consideration both operators again, the method error varied from 0.46 mm (S-Go variable) to 0.94 mm (N-ANS) and from 0.33° (Y axis variable) to 0.94° (SN-OP variable).
MAtheMAtICAl-COMPutAtIOnAl MOdelIng
ap-proximately 10 thousand lines of Delphi language (Release 8.0, Borland Inc., Austin, TX, USA) and compatible the Oracle platform (Oracle Corp., CA, USA) by the company Iris Informática (São Paulo, SP, Brazil).
exAMIneRs seleCtIOn
The tracings and cephalometric values were submitted to three examiners, selected accord-ing to their academic education and clinical ex-perience. Inclusion criteria: 1) To hold a PhD degree and; 2) To be involved in research proj-ects and a recognized university and also prac-tice clinical orthodontics. The exclusion criteria were: 1) To know the project by contact with the author and; 2) To demonstrate preference or rejection biases for any cephalometric variable or cephalometric analysis.
stAtIstICAl tOOls
The validation sample (120 cases) was sub-mitted to four assessments: three examiners assessments (subjective and qualitative) and electronic cephalometric analysis (objective and quantitative). The data from all the collections (examiners and software) were pooled and com-puted by the SPSS statistical package (Release 10.0; Chicago, IL, USA).
Results
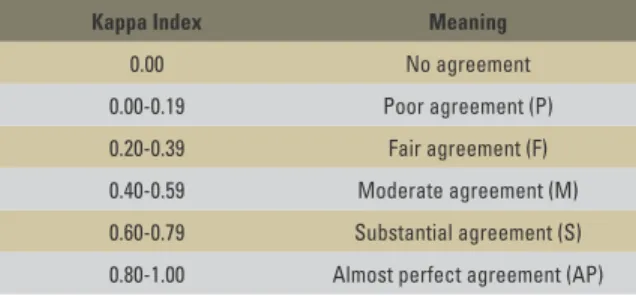
The developed neural network contextual-ized cephalometric data throughout its “synaps-es”, connecting the values [µ] and [λ] of the cells. The performance of the software was as-sessed by Kappa agreement indexes,14 which
pa-rameters are presented in the Table 1. The opin-ions of the three examiners (E1, E2, E3) were tested against the performance of the software, besides the indexes of agreement between the examiners without the software (Table 2).
The Kappa index of agreement was fair for anteroposterior discrepancies, substantial or fair for vertical discrepancies and mainly moderate for dental discrepancies. For the bimaxillary pro-trusion, the agreement was almost perfect. Fur-thermore, the agreement among the opinions of the three examiners was moderate for skeletal and dental discrepancies and almost perfect for the bimaxillary protrusion.
dIsCussIOn
Neural artificial networks can be described as computational systems which allow the connec-tion among “cells”. As biological neurons, the “ar-tificial neurons” are united by “synapses”, which connections might be “excitatory or inhibitory”.
Kappa Index Meaning
0.00 No agreement
0.00-0.19 Poor agreement (P)
0.20-0.39 Fair agreement (F)
0.40-0.59 Moderate agreement (M)
0.60-0.79 Substantial agreement (S)
0.80-1.00 Almost perfect agreement (AP) TABLE 1 - Meaning of the Kappa indexes of agreement.14
TABLE 2 - Kappa indexes between the examiners and the software, and also among the examiners.
Attribute of Interest E1 X Software E2 X Software E3 X Software E1 X E2 X E3
Anteroposterior discrepancy 0.34 – (F) 0.29 – (F) 0.37 – (F) 0.49 – (M)
Vertical discrepancy 0.75 – (S) 0.37 – (F) 0.67 – (S) 0.53 – (M)
Upper incisors positioning 0.44 – (M) 0.22 – (F) 0.45 – (M) 0.47 – (M)
Lower incisors positioning 0.45 – (M) 0.08 – (P) 0.46 – (M) 0.42 – (M)
The advantage of the use of neural artificial networks in regard to the conventional com-putational programming is its ability to solve problems that do not have direct algorithm solutions or the solutions are very complex, as the cases of predictions and pattern recog-nition, and therefore would demand intense computational processing.
The present model of artificial intelligence was formatted to prevent inefficient cycles of data processing, since it makes partial and pro-gressive decisions in which one of its “synapses”, simultaneously modeling certainty and contra-diction, before providing a final decision. Such strategy increases its capacity of data mining throughout the decision tree.
Sophisticated mathematical models have been developed in various areas of Medicine for drug development,15 for clinical diagnosis,16 and for image diagnosis interpretation.17 In all these situations, the neural networks allows for the recognition of hidden patterns and, as logical and direct consequence, better predictions.
In our model of neural network and paracon-sistent logic, in which we visualized the contex-tualization of cephalometric variables, the “arti-ficial thinking” was presented considerably alike the “human being thinking”. It is interesting to highlight the fact that the agreement among the three examiners, in regard to the skeletal and dental discrepancies and without any in-terference of any electronic diagnosis tool, was just moderate. Such fact exposes an important degree of controversy among subjective opin-ions, even those given by specialists paired by academic education and clinical experience. In the other hand, in regard to the bimaxillary dental projection, measured by the relationship between the upper and lower incisors, the agree-ment is almost perfect, indicating that the ex-aminers can well recognize a pattern of dental protrusion or dental retroclination with better homogeneity than to identify skeletal
discrepan-cies or individual dental discrepandiscrepan-cies in each one of the jaws, maxilla or mandible.
It is also important to point out that the ex-clusion criteria for sample selection was not to include an individual that was not Caucasian. If it was the case, its values comparison with the reference atlas11 would not be correct. The ex-aminers were warned about such bias and they have given their opinion, considering the bimax-illary dental projection case-to-case, for Cauca-sian individuals. If other ethnicities were also considered, for instance afro-Americans, prob-ably the opinions of the examiners about the bimaxillary dental positioning would not be so homogeneous.
In the daily practice, usually borderline sce-narios provoke different opinions among diverse specialists. Therefore, in the case of controversial and subjective opinions, to expect substantial or almost perfect agreement for borderline sce-narios would be incoherent. In support of that expectation, our results suggest that the given opinions and the electronic measurement of the software converge in most of the cases.
It is important to highlight that subjec-tive comparisons, as is the case of the opinions given by the examiners, do not hold a golden standard of answer. There is no right or wrong. Therefore, it can be stated that the software is not better or worse than the specialists in orthodontics in order to detect cephalometric discrepancies. The “machine” diagnosed as it were “one other specialist”.
was more relevant than the other. Theoretically, therefore, the comparison is relative or, if con-servatively interpreted, immeasurable.
However, in certain aspects, as systematiza-tion and time consuming, there is clear advan-tage in the use of an electronic diagnostic system. Because its processing, which is mathematical-computational, is absolutely constant, standard-ized and clearly quicker, since it does not depend upon subjective and, up to certain point, random human opinions.
The project had also as proposal to know the ranking of difficulty to diagnose different types of discrepancies, skeletal or dental. This is the ranking: the software was less effective for the anteroposterior relationships than for the verti-cal and dental discrepancies, as happened with the examiners as well. In the bimaxillary rela-tionships between upper and lower incisors, both the electronic diagnosis, as the opinions of the examiners, were expressively homogeneous.
Another characteristic to be discussed is the nominal allocation. For the anteroposterior dis-crepancy (unit I), 5 classes were determined. For the vertical discrepancy (Unit II) and den-tal discrepancy (Unit III), only 3 classes were established. Naturally, in terms of probability, a better agreement is expected as less options are given to the software or to the examiners. Therefore, the ranking must be understood by the reader with such bias: in the study design the probabilities were not matched before the assessment. Realistically, the nominal classes were established according to the usual
classi-fication given by clinical orthodontists in each one of the described scenarios.
In sum, in general view, the opinions of the examiners were qualitative and subjective, therefore, up to certain point, non-equalized and vulnerable, besides the fact that they demanded long time to be obtained. On the other hand, the software offered quantitative and objective an-swers, better equalized and that were obtained significantly faster than the agreement between specialists.
COnClusIOn
A mathematical-computational model was developed in order to extract hidden cephalo-metric patterns from conventional cephalocephalo-metric data, throughout the quantification of its impre-cision and conflicts. The mathematical modeling refined and contextualized cephalometric values, allowing a sound “electronic thinking”, compara-ble to the opinions of specialists in orthodontics. Therefore, our results support that, in gen-eral, the “electronic opinions” presented by the software are comparable to the human opinions. As an expected limitation, since for malocclu-sion the electronic perception could not be bet-ter than the human perception, the sensibility of the described electronic tool was, as the human, lower for skeletal discrepancies than for antero-posterior dental projections.
ACKnOwledgMents
1. Zadeh LA. Fuzzy sets. Information and Control. 1965;8(3):338-53.
2. Zadeh LA. Fuzzy sets as a basis for a theory of possibility. Fuzzy Sets and Systems. 1978;1:3-28.
3. Akçam MO, Takada K. Fuzzy modeling for selecting headgear types. Eur J Orthod. 2002;24:99-106. 4. Takada K, Sorihashi Y, Stephens CD, Itoh S. An inference
modeling of human visual judgement of sagittal jaw-base relationships based on cephalometry. Part I. Am J Orthod Dentofacial Orthop. 2000 Feb;117(2):140-6.
5. Sorihashi Y, Stephens CD, Takada K. An inference modeling of human visual judgement of sagittal jaw-base relationships based on cephalometry. Part II. Am J Orthod Dentofacial Orthop. 2000 Mar;117(3):303-11.
6. Noroozi H. Orthodontic treatment planning software. Am J Orthod Dentofacial Orthop. 2006 Jun;129(6):834-7. 7. Costa NCA, Subrahmanian VS, Vago C. The paraconsistent
logics Pt. Zeitschr F Math Logik Ground Math. 1991;37:139-48.
8. Costa NCA, Abe JM, Subrahmanian VS. Remarks on annotated logic. Zeitschr F Math Logik Ground Math. 1991;37:561-70.
9. Sylvan R, Abe JM. On general annotated logics, with an introduction to full accounting logics. Bulletin of Symbolic Logic. 1996;2:118-9.
RefeRenCes
10. Abe JM. Paraconsistent artiicial neural networks: introduction. Lecture notes in artiicial intelligence. New
York: Springer;2004.
11. Martins DR, Janson GRP, Almeida RR, Pinzan A, Henriques JFC, Freitas MR. Atlas de crescimento craniofacial. São Paulo: Ed. Santos;1998.
12. Siriwat PP, Jarabak JR. Malocclusion and facial morphology. Is there a relationship? An epidemiologic study. Angle Orthod. 1985 Apr;55(2):127-38.
13. Dahlberg G. Statistical methods for medical and biological students. London: George Allen and Unwin; 1940. 14. Fleiss JL. Statistical methods for rates and proportions. New
York: John Wiley;1981.
15. Weinstein JN, Kohn KW, Grever MR, Viswanadhan VN, Rubinstein LV, Monks AP, et al. Neural computing in cancer drug development: predicting mechanism of action. Science. 1992 Oct 16;258(5081):447-51.
16. Baxt WJ, Application of artiicial neural network to clinical
medicine. Lancet 1995;346:1135-8.
17. Subasi A, Alkan A, Koklukaya E, Kiymik MK. Wavelet neural
network classiication of EEG signals by using AR model with
MLE preprocessing. Neural Netw. 2005 Sep;18(7):985-97.
Contact address
Marinho Del Santo Jr.
Rua Pedroso Alvarenga 162, Cj. 52 - Itaim Bibi CEP: 04.531-000 - São Paulo / SP, Brazil E-mail: marinho@delsanto.com.br