Regional incidence of venous thromboembolism in Brazil
A incidência regional do tromboembolismo venoso no Brasil
Alan Vitor Ohki1
*
, Bonno van Bellen2
Abstract
Background: Several studies conducted in areas with temperate climates have suggested that the incidence of venous thromboembolism (VTE) varies depending on seasonal climatic luctuations. However, no studies have been conducted comparing areas with semi-arid climate with areas with temperate climates. Objectives: To analyze whether there is a correlation between the incidence of VTE in areas with semi-arid climates and areas with temperate climates in Brazil. Methods: Retrospective data were acquired for patients diagnosed with VTE from January 2011 to December 2014 from the Brazilian National Health Service for the following Brazilian states that have semi-arid climates: Alagoas, Ceará, Maranhão, Paraíba, Pernambuco, Piauí, and Rio Grande do Norte (all located in the Northeast Region of Brazil); and the following states with temperate climates: Paraná, Santa Catarina, and Rio Grande do Sul (all located in the South Region of Brazil). Data on climatic variation were obtained from the National Meteorological Institute and population data were obtained from the Brazilian Institute of Geography and Statistics. Results: here was a signiicant correlation in the incidence of VTE cases in areas with lower temperatures (p < 0.001). he South Region exhibited signiicantly lower temperatures than the Northeast Region (p < 0.001) and had a signiicantly higher number of cases of VTE than the Northeast Region (p < 0.001). Conclusions: here are more cases of VTE in areas with temperate climates, where temperatures are lower. However, there is still little information in the literature on seasonal luctuations and incidence of VTE. More studies of this subject are needed.
Keywords: venous thromboembolism; venous thrombosis; seasonality; climate.
Resumo
Contexto: Vários estudos realizados em climas temperados sugerem que há uma variação na incidência de tromboembolismo venoso (TEV) de acordo com as estações climáticas. Entretanto, nenhum estudo foi feito comparando áreas de clima semiárido com áreas de clima temperado. Objetivos: Analisar se existe correlação entre a incidência do TEV em áreas de clima semiárido e de clima temperado no Brasil. Métodos: Foi feito um levantamento de dados retrospectivos de pacientes com diagnóstico de TEV no Sistema Único de Saúde de janeiro de 2011 a dezembro de 2014 provenientes dos seguintes estados com clima semiáridos: Alagoas, Ceará, Maranhão, Paraíba, Pernambuco, Piauí e Rio Grande do Norte, localizados na Região Nordeste do Brasil; e dos seguintes estados com clima temperado: Paraná, Santa Catarina e Rio Grande do Sul, localizados na Região Sul do Brasil. Os dados de variação climática foram obtidos do Instituto Nacional de Meteorologia e os dados populacionais do Instituto Brasileiro de Geograia e Estatística. Resultados: Houve correlação signiicativa na incidência de casos de TEV em regiões de temperaturas mais baixas (p < 0,001). A Região Sul apresentou temperaturas signiicativamente menores que as da Região Nordeste (p < 0,001) e apresentou número signiicativamente maior de casos de TEV do que a Região Nordeste (p < 0,001). Conclusão: Há mais casos de TEV em regiões de clima temperado, onde as temperaturas são mais baixas. No entanto, pouco ainda é conhecido na literatura sobre a lutuação sazonal e a incidência de TEV. Sendo assim, mais estudos são necessários nessa área.
Palavras-chave: tromboembolismo venoso; trombose venosa; sazonalidade; clima.
1 Hospital Beneicência Portuguesa – BP, Postgraduate Sensu Lato in Vascular Surgery Integrated, São Paulo, SP, Brazil.
2 Hospital Beneicência Portuguesa – BP, Postgraduate Sensu Lato in Vascular Surgery Integrated, Integrated Vascular Surgery Service, São Paulo, SP, Brazil. Financial support: None.
Conlicts of interest: No conlicts of interest declared concerning the publication of this article. Submitted: May 03, 2017. Accepted: July 04, 2017.
INTRODUCTION
The global prevalence of venous thromboembolism (VTE) is very high, ranging from 50 to 200 cases per 100,000 inhabitants per year.1-4 Seasonality of VTE
incidence has been reported in various studies conducted in areas with temperate climates.1-12 The majority of
them show that prevalence is higher during periods of lower temperatures.
However, no studies have been conducted that compare areas with semi-arid tropical climates with areas that have temperate climates. The objective of this study was to analyze whether there is a correlation between the incidence of VTE in areas with semi-arid climates and areas with temperate climates in Brazil.
METHODS
Retrospective data were acquired for patients diagnosed with VTE from the Brazilian National Health Service (SUS - Sistema Único de Saúde).13
Patients were selected who had been diagnosed between January 2011 and December 2014 in the following Brazilian states that have semi-arid climates: Alagoas, Ceará, Maranhão, Paraíba, Pernambuco, Piauí, and Rio Grande do Norte (all located in the Northeast Region of Brazil); and the following states with temperate climates: Paraná, Santa Catarina, and Rio Grande do Sul (all located in the South Region of Brazil).
Climatic data for the capital cities of each of the
states listed were obtained from the oficial National
Meteorological Institute (Inmet - Instituto Nacional de Meteorologia),14 covering the same period. Population
data were obtained from the oficial Brazilian Institute
of Geography and Statistics’ (IBGE - Instituto Brasileiro
de Geograia e Estatística).15
Data were subjected to statistical analysis using the Spearman and Mann-Whitney tests.
RESULTS
Table 1 lists descriptive statistics for the temperatures of the states investigated, showing that the median temperatures in the Southern states were lower than the temperatures recorded in the states in the Northeast. Data for some months were not included in the table
because oficial igures were not available (Table 1).
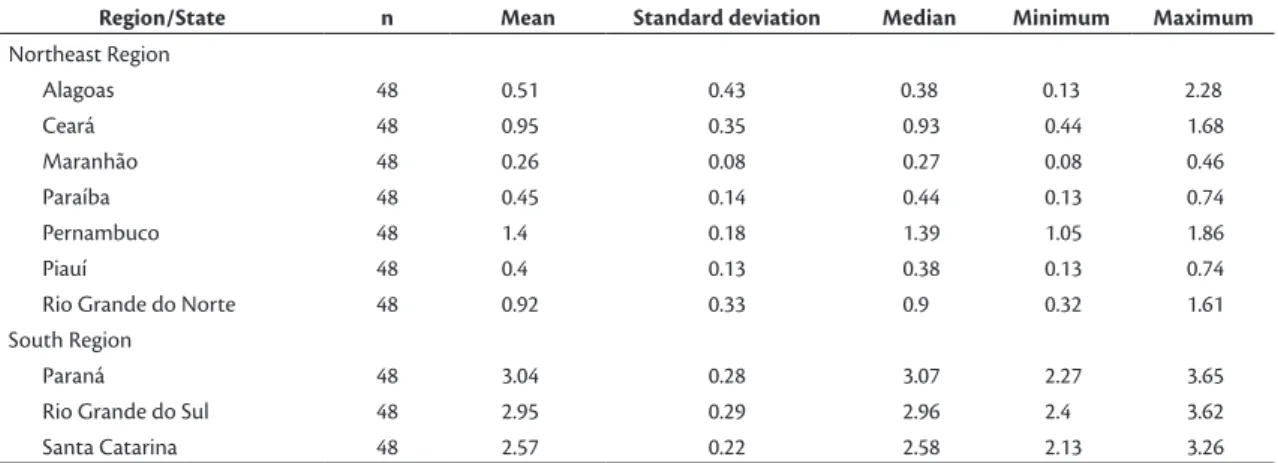
Table 2 lists descriptive statistics for the number of cases of VTE per 100,000 inhabitants in the states investigated. This table shows that the highest median values were for the states in the South Region.
Table 3 lists descriptive statistics for average temperature in each Region (Northeast or South), showing that the states in the South had a lower mean temperature than the states in the Northeast.
The Mann-Whitney nonparametric test revealed a
signiicant difference in temperature between the two regions. The South Region had signiicantly lower
temperatures than the Northeast Region (p < 0.001) (Figure 1).
Population data for the states investigated were obtained from IBGE. The total population of the South Region was 27,384,815 people and the total for the Northeast Region was 36,988,674 people.
Table 4 lists descriptive statistics for the number of cases of VTE per 100,000 inhabitants by Region. This table shows that the median is higher in the South Region than in the Northeast Region.
The Mann-Whitney nonparametric test revealed a
signiicant difference between the Regions in terms
of the number of cases of VTE. The South Region
Table 1. Descriptive statistics for temperatures by state, in degrees Celsius.
Region/State n Mean Standard deviation Median Minimum Maximum
Northeast Region
Alagoas 48 25.21 1.13 25.32 23.31 27.26
Ceará 48 27.3 0.67 27.26 26.05 29.17
Maranhão 48 26.98 0.65 26.96 25.74 28.23
Paraíba 39 26.32 1.06 26.54 24.18 28.21
Pernambuco 48 25.6 1.12 25.79 23.47 27.58
Piauí 47 27.93 1.28 27.58 26.08 30.88
Rio Grande do Norte 48 26.44 1.02 26.68 24.64 28.04
South Region
Paraná 46 18.02 2.73 18.26 12.83 22.78
Rio Grande do Sul 48 19.89 4.08 20.32 12.95 26.49
Santa Catarina 48 21.12 3.21 21.58 15.62 26.44
had a signiicantly higher number than the Northeast
Region (p < 0.001) (Figure 2).
The Spearman’s correlation coeficient revealed a negative and signiicant correlation between temperature
and rate of VTE per 100,000 inhabitants (r = -0.652; p < 0.001) (Figure 3).
Table 4. Descriptive statistics for number of cases of venous thromboembolism per 100,000 inhabitants in each Region.
Region n Mean Standard deviation Median Minimum Maximum
Northeast 336 0.70 0.46 0.53 0.08 2.28
South 144 2.86 0.33 2.82 2.13 3.65
n = number of months for which cases were analyzed in the states in each region.
Figure 1. Variation in mean temperature in the Northeast Region
and the South Region, in degrees Celsius.
Figure 2. Cases of venous thromboembolism per 100,000 inhabitants in the Northeast and South Regions.
Figure 3. Correlation between incidence of cases of venous
thromboembolism per 100,000 inhabitants and temperature in degrees Celsius.
Table 2. Descriptive statistics for number of cases of venous thromboembolism per 100,000 inhabitants of the states investigated.
Region/State n Mean Standard deviation Median Minimum Maximum
Northeast Region
Alagoas 48 0.51 0.43 0.38 0.13 2.28
Ceará 48 0.95 0.35 0.93 0.44 1.68
Maranhão 48 0.26 0.08 0.27 0.08 0.46
Paraíba 48 0.45 0.14 0.44 0.13 0.74
Pernambuco 48 1.4 0.18 1.39 1.05 1.86
Piauí 48 0.4 0.13 0.38 0.13 0.74
Rio Grande do Norte 48 0.92 0.33 0.9 0.32 1.61
South Region
Paraná 48 3.04 0.28 3.07 2.27 3.65
Rio Grande do Sul 48 2.95 0.29 2.96 2.4 3.62
Santa Catarina 48 2.57 0.22 2.58 2.13 3.26
n = number of months analyzed.
Table 3. Descriptive statistics for mean temperatures of each Region, in degrees Celsius.
Region n Mean Standard deviation Median Minimum Maximum
Northeast 326 26.54 1.34 26.68 23.31 30.88
South 142 19.7 3.61 19.63 12.83 26.49
DISCUSSION
Several studies in the literature correlate VTE cases with climatic variation. Stein et al.5 conducted
a study analyzing data from the National Hospital Discharge Survey database covering the period from 1979 to 1999. They analyzed 7,682,000 cases of patients with VTE, 2,457,000 with pulmonary thromboembolism, and 5,767,000 with DVT, but did
not ind any correlation between seasonal variation
and incidence of VTE.5
However, Kleinfelder et al.6 analyzed 955 cases
of VTE from 1996 to 2003 and detected a higher incidence during hot months. In contrast, Brown et al.7
performed a retrospective analysis of 37,336 cases over 20 years in Scotland, reporting a higher incidence of VTE during the coldest month (p < 0.0001). Similar results were observed by Gallerani et al.8
in a prospective study of 1166 cases at the Hospital Geral de Ferrara, in Italy, where VTE incidence was higher in the winter (p < 0.0001). Other researchers, such as Ribeiro et al.,9 Fink et al.,10 Boulay et al.,11
and Dentali et al.,12 also reported higher incidence
rates of VTE cases in the winter.
There are certain factors and hypotheses that can be considered with relation to these observations. During hotter periods, people tend to be more sedentary because of excess heat, increasing immobility.16 During colder
months, development of VTE may also be related to reduced physical activity and to vasoconstriction induced by low temperatures, which reduces blood
low in the lower limbs.6
Additionally, respiratory tract infections during the winter may induce a hypercoagulable state due to
increased ibrinogen levels, which was also observed
by Brown et al.,7 Boulay et al.,12 and Gallerani et al.8
Furthermore, less time exposed to sunlight causes reduced melatonin production and increases coagulability.6
In cold conditions, some coagulation factors are elevated in vitro, such as platelet counts and platelet aggregation rates, while there is also a reduction in plasma volume, which increases the viscosity of the
blood and of ibrinogen, providing conditions that
increase the number of thrombosis cases.11
With regard to liquid consumption, there is no
difference in luid equilibrium between hotter and
cooler temperatures. Liquid consumption is higher in hotter temperatures, but liquid losses are also proportionally higher.17
In our study, states in the North Region of Brazil were excluded from the analysis because of a lack of sample data. Sampling rates are higher in the Northeast Region, but it does appear that there is still a higher
rate of under-notiication of cases than in the data for
the South Region, where there are more resources available for health care. Data on the incidence of VTE were obtained from the SUS, which is Brazil’s
oficial public health system.
After statistical analysis, there was a signiicant
correlation between incidence of VTE cases and
lower temperatures (p < 0.001). Speciically, the
colder the temperature, the higher the incidence
of VTE. The South Region has signiicantly lower
temperatures than the Northeast Region (p < 0.001)
and had a signiicantly higher number of cases of
VTE than the Northeast Region (p < 0.001).
CONCLUSIONS
The incidence of VTE is higher in the states in the South of Brazil, where temperatures are lower. However, there is still little information in the literature
on the correlation between seasonal luctuation and
incidence of VTE. More studies of this subject are therefore needed.
REFERENCES
1. Silverstein MD, Heit JA, Mohr DN, Petterson TM, O’Fallon WM, Melton LJ 3rd. Trends in the incidence of deep vein thrombosis and pulmonary embolism: a 25-year population-based study. Arch Intern Med. 1998;158(6):585-93. PMid:9521222. http://dx.doi. org/10.1001/archinte.158.6.585.
2. Maffei FH. Epidemiologia da trombose venosa profunda e de suas complicações no Brasil. Cir Vasc Angiol. 1998;14:5-8.
3. Fowkes FJ, Price JF, Fowkes FG. Incidence of diagnosed deep vein thrombosis in the general population: systematic review. Eur J Vasc Endovasc Surg. 2003;25(1):1-5. PMid:12525804. http://dx.doi. org/10.1053/ejvs.2002.1778.
4. Naess IA, Christiansen SC, Romundstad P, Cannegieter SC, Rosendaal FR, Hammerstrøm J. Incidence and mortality of venous thrombosis: a population-based study. J Thromb Haemost. 2007;5(4):692-9. PMid:17367492. http://dx.doi.org/10.1111/j.1538-7836.2007.02450.x.
5. Stein PD, Kayali F, Olson RE. Analysis of occurrence of venous thromboembolic disease in the four seasons. Am J Cardiol. 2004;93(4):511-3. PMid:14969640. http://dx.doi.org/10.1016/j. amjcard.2003.10.061.
6. Kleinfelder D, Andrade JL, Schlaad SW, Carvalho FC, Bellen BV. A sazonalidade do tromboembolismo venoso no clima subtropical de São Paulo. J Vasc Bras. 2009;8(1):29-32. http://dx.doi.org/10.1590/ S1677-54492009005000005.
7. Brown HK, Simpson AJ, Murchison JT. The influence of meteorological variables on the development of deep venous thrombosis. Thromb Haemost. 2009;102(4):676-82. PMid:19806252.
8. Gallerani M, Boari B, Toma D, Salmi R, Manfredini R. Seasonal variation in the occurrence of deep vein thrombosis. Med Sci Monit. 2004;10(5):CR191-6. PMid:15114268.
10. Fink AM, Mayer W, Steiner A. Seasonal variations of deep vein thrombosis and its influence on the location of the thrombus. Thromb Res. 2002;106(2):97-100. PMid:12182906. http://dx.doi. org/10.1016/S0049-3848(02)00094-4.
11. Boulay F, Berthier F, Schoukroun G, Raybaut C, Gendreike Y, Blaive B. Seasonal variations in hospital admission for deep vein thrombosis and pulmonary embolism: analysis of discharge data. BMJ. 2001;323(7313):601-2. PMid:11557707. http://dx.doi. org/10.1136/bmj.323.7313.601.
12. Dentali F, Ageno W, Rancan E, et al. Seasonal and monthly variability in the incidence of venous thromboembolism. A systematic review and a meta-analysis of the literature. Thromb Haemost. 2011;106(3):439-47. PMid:21725580. http://dx.doi.org/10.1160/ TH11-02-0116.
13. Datasus [site na Internet]. Brasília, DF: Ministério da Saúde; 2016 [citado 2016 jun 1]. http://www2.datasus.gov.br.
14. Inmet [site na Internet]. Brasília, DF: Ministério da Agricultura, Pecuária e Abastecimento; 2016 [citado 2016 jun 1]. http://www. inmet.gov.br.
15. Ibge [site na Internet]. Rio de Janeiro: Ministério do Planejamento, Orçamento e Gestão; 2016 [citado 2016 jun 1]. www.ibge.gov.br.
16. Mora-Rodriguez R, Ortega JF, Fernandez-Elias VE, et al. Influence of Physical Activity and Ambient Temperature on Hydration: The European Hydration Research Study (EHRS). Nutrients. 2016;8(5):252. PMid:27128938. http://dx.doi.org/10.3390/nu8050252.
17. Malisova O, Bountziouka V, Panagiotakos DB, Zampelas A, Kapsokefalou M. Evaluation of seasonality on total water intake, water loss and water balance in the general population in Greece. J Hum Nutr Diet. 2013;26(Suppl. 1):90-6. PMid:23521514. http:// dx.doi.org/10.1111/jhn.12077.
*
Correspondence
Alan Vitor Ohki Rua Correia de Lemos, 487/21 - Chácara Inglesa CEP 04140-000 - São Paulo (SP), Brazil Tel.: + 55 (11) 98429-6370 E-mail: [email protected]
Author information
AVO - MD from Faculdade de Ciências Médicas da Santa Casa de São Paulo (2009); Medical residency in General Surgery at Hospital Nossa Senhora de Lourdes (MEC); graduate student (board certiication) in Integrated Vascular Surgery at Hospital Beneicência Portuguesa (BP). BVB - MD from Universidade de São Paulo (1969); PhD in Medicine from Universidade de São Paulo (1973); tenured professor of Peripheral Vascular Diseases from Universidade Estadual de Campinas (UNICAMP); chief of Serviço de Cirurgia Vascular Integrada, Hospital Beneicência Portuguesa (BP).
Author contributions
Conception and design: BVB Analysis and interpretation: AVO, BVB Data collection: AVO Writing the article: AVO Critical revision of the article: AVO, BVB Final approval of the article*: AVO, BVB Statistical analysis: AVO Overall responsibility: AVO