Cláudia Helena Soares de Morais FreitasI
Fábio Correia SampaioI
Angelo Giuseppe RoncalliII
Samuel Jorge MoysésIII
I Programa de Pós-Graduação em Odontologia. Departamento de Clínica e Odontologia Social. Universidade Federal da Paraíba. João Pessoa, PB, Brasil II Programa de Pós-Graduação em Saúde
Coletiva. Departamento de Odontologia. Universidade Federal do Rio Grande do Norte. Natal, RN, Brasil
III Programa de Pós-Graduação em Odontologia. Pontifícia Universidade Católica do Paraná. Curitiba, PR, Brasil Correspondence:
Cláudia Helena Soares de Morais Freitas R. Poeta Luis Raimundo B. de Carvalho, 357 Bessa
58037-530 João Pessoa, PB, Brasil E-mail: [email protected] Received: 05/16/2012 Approved: 03/04/2013
Article available from: www.scielo.br/rsp
Methodological discussion
about prevalence of the dental
fluorosis on dental health
surveys
ABSTRACT
OBJECTIVE: To evaluate the inluence of social inequalities of individual and contextual nature on untreated dental caries in Brazilian children.
METHODS: The data on the prevalence of dental caries were obtained from the Brazilian Oral Health Survey (SBBrasil 2010) Project, an epidemiological survey of oral health with a representative sample for the country and each of the geographical micro-regions. Children aged ive (n = 7,217) in 177 municipalities were examined and their parents/guardians completed a questionnaire. Contextual characteristics referring to the municipalities in 2010 (mean income, luorodized water and proportion of residences with water supply) were supplied by the Brazilian Institute of Geography and Statistics – Fundação Instituto Brasileiro
de Geograia e Estatística. Multilevel Poisson regression analysis models were used to assess associations.
RESULTS: The prevalence of non-treated dental caries was 48.2%; more than half of the sample had at least one deciduous tooth affected by dental caries. The index of dental caries in deciduous teeth was 2.41, with higher igures in the North and North East. Black and brown children and those from lower income families had a higher prevalence of untreated dental caries. With regards context, the mean income in the municipality and the addition of luoride to the water supply were inversely associated with the prevalence of the outcome.
CONCLUSIONS: Inequalities in the prevalence of untreated dental caries remain, affecting deciduous teeth of children in Brazil. Planning public policies to promote oral health should consider the effect of contextual factors as a determinant of individual risk.
Dental caries and its consequences continues to be a public health problem in many low and middle income countries and for socially disadvantaged groups in high income countries. However, the incidence and prevalence of dental caries has decreased signiicantly over the last few decades, especially in the young, an evident protective effect which can be attributed to the widespread use of luoride.
The irst research into the use of luoride concentrated on its collective use in drinking water. Such research aimed not only to measure the preventative effects on the prevalence and incidence of dental caries, but also to establish safe levels in order to avoid dental luorosis.13,16 Systematic reviews of the literature of the
last decade reafirm the importance of using luoride to prevent dental caries and recommend balancing the risks and beneits of collective and individual use of luoride (topical use of luoride).14,19,27
Dental luorosis is deined as a change in the minera-lization in the tooth enamel due to prolonged intake of luoride during the period in which the teeth develop.1,2
The majority of cases reported in the literature, inclu-ding in Brazil, indicate mild or very mild occurrence of luorosis which is, therefore, not considered to be a public health problem.3,7,12,13
Dean8 describes the most commonly used method of
clinically and epidemiologically classifying dental luorosis. At the end of the 1970s, increased knowledge of the histological and microscopic characteristics of dental luorosis enabled new methods of classiica-tion to be developed, among them the Thylstrup and Fejerskov index,24 the Tooth Surface Index of Fluorosis
(TSIF),15 and the luorosis Risk Index.20 Selecting the
appropriate index depends on the aim of the study, but the use of different indexes to establish the presence of luorosis is a problem for the reliability and consistency of data on prevalence/incidence.
The SBBrasil 2003 (Condições de Saúde Bucal da
População Brasileira - Oral Health Conditions in the
Brazilian Population) and the Pesquisa Nacional de
Saúde Bucal (Brazilian Oral Health Survey - SBBrasil
2010) are two nationwide surveys into oral health carred out in Brazil, and dental luorosis was one of the health problems investigated. The SBBrasil 2010 was primarily an oral health monitoring strategy based on producing primary data, aiming to reinforce National Oral Health Care policies based on an epidemiologi-cally based health care model.
The aim of this study was to analyze the limitations of the study of dental luorosis in cross-sectional surveys. INTRODUCTION
METHODS
A quantitative based study with a descriptive and analytical approach, with data from the SBBrasil 2003 and SBBrasil 2010 studies. Based on this analysis, aspects of the reliability of the data obtained in the two surveys were discussed, as well as the accuracy of the estimates.
The data from the two above mentioned surveys were obtained from data bases available in the Brazilian Ministry of Health’s General Coordination of Oral Health website. First, the database from the 2003 and 2010 databases were combined in order to analyze trends. The variable “year” was created in order to distinguish between the two databases and the inal database had a total of 146 thousand records. Some of the variables were present in the 2003 survey and not in the 2010 survey, and vice-versa. In this case, if the variable was deemed to be important in the analysis, it was kept in the database and given a zero code in the year in which it did not appear. This was the case, for example, of the weighted variables which were only used in 2010.
As there were no weighted variables in 2003, the conidence intervals were calculated assuming a simple causal sample. In 2010 the conidence intervals were calculated taking into account design and weighting variables. Details of the sample design and the teams’ training process for both surveys can be found in other publications.a,b
The index proposed by Dean8 was used in the
inves-tigation of dental luorosis in 12-year-old children. The outcome variable, the presence of luorosis, was analyzed with a normal condition being considered based on a combination of “normal” and “questionable” scores and the other categories composed the preva-lence of luorosis, following the rules recommended in the 2003 and 2010 studies.
The distribution of the prevalence of luorosis was shown according to the domains of the study (state capi-tals and regions) and the year studied (2003 and 2010). The conidence intervals (95%CI) were also shown for simple prevalence (without considering severity). The data were analyzed using the SPSS version 17 statistics program. The irst analysis of the data was conducted at an individual level (by year and by domain) and the behavior of the trend showed discre-pancies and atypical observations.
In order to analyze the discrepant data (higher and lower), the following cutoff points for the prevalence of luorosis
were established, with the minimum being from close to zero to 1.4% and the maximum being values above 30%, deined based on estimates of the prevalence of luorosis for cities with and without luoridated water. In cities where the water is not luoridated there was expected to be a minimal prevalence of luorosis due to exposure to luoride from other sources, as well as genetic variations and individual variations in luoride intake. Accordingly, cities with luoridated water and regular control did not show a prevalence of luorosis above 30%, even when other sources of luoride are considered.9
Taking into account that there is a degree of imprecision inherent to the index used, the occurrence of random or systematic error ispossible.5 This imprecision may be
due to characteristics particular to the index or linked to deiciencies in the training and instruction process. Therefore, in order to investigate the source of the error, the municipalities with the highest rates of prevalence in 2010 were analyzed, separating the values by census tract. Each examiner was responsible, on average, for three census tracts so that, when analyzed in isolation, the data could indicate bias in one or more examiners or, conversely, show that there was uniform bias between all of them.
Another aspect analyzed concerns the ideal sample size to be used in studies of the prevalence of luorosis. The sample size for the 12-year-olds was calculated so as to estimate, with reasonable precision, rates of prevalence above 20%.c In general, the expected prevalence for
luorosis is well below this, so that, in order to obtain a good estimate “n” needs to be increased. Therefore, simulations were carried out aiming to estimate the minimum sample size necessary to observe the preva-lence of luorosis with more appropriate intervals of conidence. For this simulation, the expression given by the formula (1) was considered, in which the calculation of standard error includes design effect (d).
The SBBrasil 2010 Project followed the standards set by the Declaration of Helsinki and was approved by the National Council on Research Ethics, record no. 15,498, 7th January 2010.
RESULTS
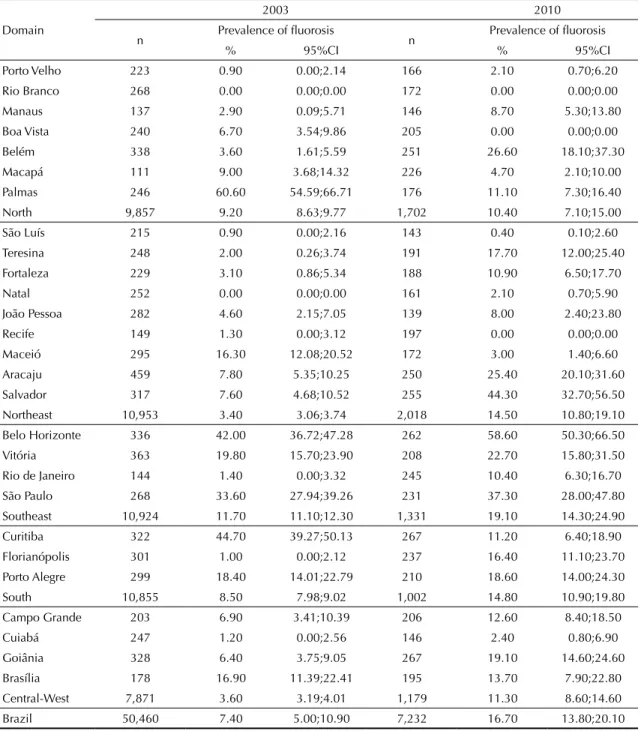
Table 1 shows the distribution of rates of prevalence of luorosis according to the domains of the study (state capitals and regions) and year (2003 and 2010). The 95%CI are also shown for simple prevalence (without considering severity).
Taking 2003 as the base year, Palmas (61%) in the North, Belo Horizonte (42%) in the Southeast and Curitiba (45%) in the South stand out. The prevalence in Palmas, for example, is so high that it caused the mean for the North (where luoridated water supplies are scarce) to approach that of the South East (where all of the state capitals add luoride to tap water). Lack of fluorosis, or very low values should be viewed with caution, especially if the municipality provides luoridated drinking water. This is the case in Florianópolis and Rio de Janeiro in 2003, with rates of prevalence of 1.05 and 1.4% respectively. On the other hand, Maceió, without a luoridated tap water, had a prevalence of 16.3%.
Figures 1 and 2 show the data from Table 1 from diffe-rent perspectives. Figure 1 shows prevalence ordered by year, with considerable variance in the prevalence, from 0% to 61% in 2003 and from 0% to 59% in 2010, highlighting those state capitals with atypical values, either for being very low (no luorosis or, maximum 1.4%) or very high (over 30%).
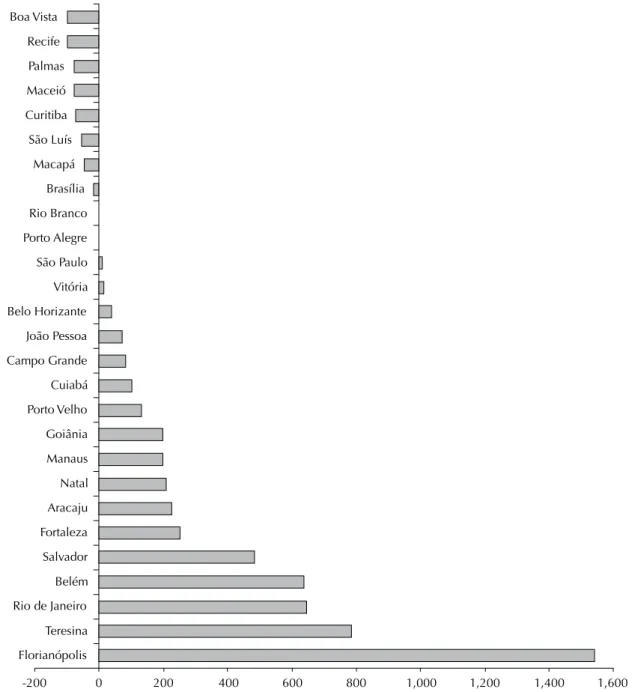
Figure 2 shows the prevalence of luorosis and respec-tive 95%CI according to region and year. Figure 3 shows percentage difference between 2003 and 2010, with the former as the base year. Thus, positive numbers indicate an increase and negative number a decrease in prevalence.
In 2010, there appeared to be greater coherence between the prevalence of luorosis and luoridated water: muni-cipalities without this had lower percentages. However, when the data for 2003 and 2010 are compared (Figure 3), the inconsistencies become evident. There were variations ranging from -100% in Boa Vista, in other words, luorosis of 6.25 literally disappeared in 2010, to 1,540% (15 times higher) in Florianópolis, where luo-rosis of 1% in 2003 climbed to 16.4% in 2010. In four state capitals with luoridated water supplies (Palmas, Curitiba, Macapá and Brasília) there was a reduction in the prevalence of luorosis between 2003 and 2010 and in ive state capitals where the tap water is not luoridated (João Pessoa, Cuiabá, Porto Velho, Manaus and Natal) increases between 74% and 210% were observed. The data in Table 1 and Figure 1 show that, although the rates of prevalence seem to vary greatly between state capitals in terms of percentage points, these largely disappear when the interval estimates are considered. When the values for the prevalence are ordered as shown in Figure 1, it is possible to identify four groups of state capitals in which the prevalence does not vary statistically: (a) Rio Branco, Recife, Boa Vista, São Luís, Natal, Porto Velho, Cuiabá, Maceió, Macapá and João Pessoa, with rates of prevalence varying
between 0% and 8%; (b) Manaus, Rio de Janeiro, Fortaleza, Palmas, Curitiba, Campo Grande, Brasília, Florianópolis and Teresina, with values between 8.7% and 17.7%; (c) Porto Alegre, Goiânia, Vitória, Aracaju and Belém, varying between 18.6% and 26.6%; and (d) São Paulo, Salvador and Belo Horizonte, with rates of prevalence between 37.3% and 58.6%.
When analyzing the prevalence of luorosis and consi-dering the distribution of the tracts in the state capitals, it can be observed that in one of the municipalities, where the general prevalence was 27%, almost all of
this percentage (21%) was located in 1/3 of the 30 assessed tracts, for which the data were obtained by ive examiners. When data considered to be outliers and pertaining to these examiners were excluded the prevalence fell to 6.7%. On the other hand, in another municipality, there was no concentration of high prevalence in any tract. In half of the tracts the values were above the mean (58%) and variation between the examiners was not considered to be signiicant. Table 2 shows standard errors and 95%CI for estimates of prevalence based on different sample sizes for a Table 1. Distribution of prevalence of fluorosis according to study domain and year. SBBrasil 2003 and SBBrasil 2010.
2003 2010
Domain
n Prevalence of fluorosis n Prevalence of fluorosis
% 95%CI % 95%CI
Porto Velho 223 0.90 0.00;2.14 166 2.10 0.70;6.20 Rio Branco 268 0.00 0.00;0.00 172 0.00 0.00;0.00
Manaus 137 2.90 0.09;5.71 146 8.70 5.30;13.80 Boa Vista 240 6.70 3.54;9.86 205 0.00 0.00;0.00 Belém 338 3.60 1.61;5.59 251 26.60 18.10;37.30 Macapá 111 9.00 3.68;14.32 226 4.70 2.10;10.00
Palmas 246 60.60 54.59;66.71 176 11.10 7.30;16.40 North 9,857 9.20 8.63;9.77 1,702 10.40 7.10;15.00 São Luís 215 0.90 0.00;2.16 143 0.40 0.10;2.60 Teresina 248 2.00 0.26;3.74 191 17.70 12.00;25.40
Fortaleza 229 3.10 0.86;5.34 188 10.90 6.50;17.70 Natal 252 0.00 0.00;0.00 161 2.10 0.70;5.90 João Pessoa 282 4.60 2.15;7.05 139 8.00 2.40;23.80 Recife 149 1.30 0.00;3.12 197 0.00 0.00;0.00
Maceió 295 16.30 12.08;20.52 172 3.00 1.40;6.60 Aracaju 459 7.80 5.35;10.25 250 25.40 20.10;31.60 Salvador 317 7.60 4.68;10.52 255 44.30 32.70;56.50 Northeast 10,953 3.40 3.06;3.74 2,018 14.50 10.80;19.10
Belo Horizonte 336 42.00 36.72;47.28 262 58.60 50.30;66.50 Vitória 363 19.80 15.70;23.90 208 22.70 15.80;31.50 Rio de Janeiro 144 1.40 0.00;3.32 245 10.40 6.30;16.70 São Paulo 268 33.60 27.94;39.26 231 37.30 28.00;47.80
Southeast 10,924 11.70 11.10;12.30 1,331 19.10 14.30;24.90 Curitiba 322 44.70 39.27;50.13 267 11.20 6.40;18.90 Florianópolis 301 1.00 0.00;2.12 237 16.40 11.10;23.70 Porto Alegre 299 18.40 14.01;22.79 210 18.60 14.00;24.30
South 10,855 8.50 7.98;9.02 1,002 14.80 10.90;19.80 Campo Grande 203 6.90 3.41;10.39 206 12.60 8.40;18.50 Cuiabá 247 1.20 0.00;2.56 146 2.40 0.80;6.90 Goiânia 328 6.40 3.75;9.05 267 19.10 14.60;24.60
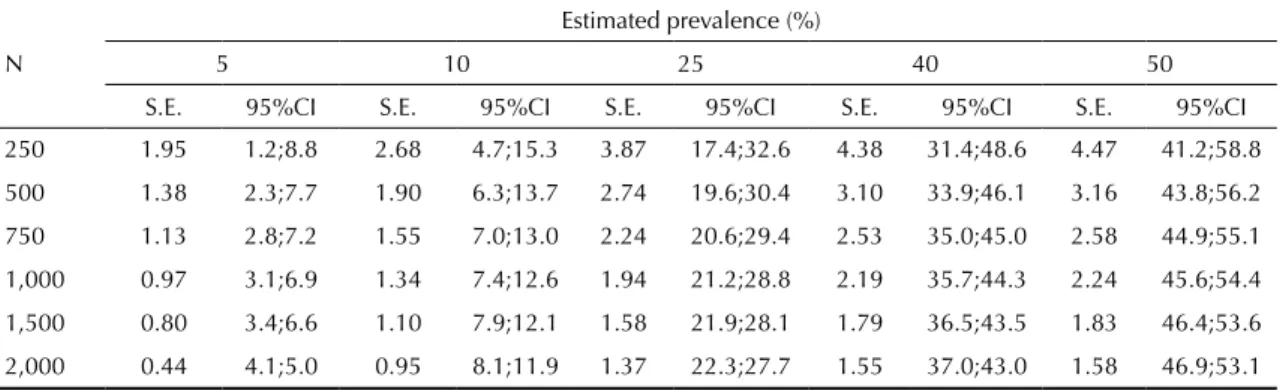
design effect equal to 2. Taking a minimum coeficient of variation of 15% as the parameter for decision making, as in the SBBrasil 2010, the minimum sample size would be1,500 individuals and the conidence interval between 3.4% and 6.6%.
DISCUSSION
In general, it is possible to infer that there is no rationa-lity behind luorosis trends in Brazil. Small variations
may be acceptable, bearing in mind that strategies for controlling luoride in the water may vary between state capitals.
However, these data may indicate, fundamentally, the validity of the data themselves, in other words, an epidemic prevalence (61%) in Palmas is inconceivable. In Belo Horizonte there seemed to be logic in terms of the trend, but the values are very high in both years, even for a city which adds luoride to the water. The
Rio Branco Natal Porto Velho São Luis Florianópolis Cuiabá Recife
Rio Branco Recife Boa vista São Luis Natal Porto Velho Cuiabá Rio de Janeiro
Teresina Manaus Fortaleza Belém João Pessoa Goiânia Boa Vista Campo Grande Salvador Aracaju Macapá Maceió Brasília Porto Alegre Vitória
Maceió Macapá João Pessoa Manaus Rio de Janeiro Fortaleza Palmas Curitiba Campo Grande Brasília Florianópolis Teresina Porto Alegre Goiânia Vitória Aracaju São Paulo
Belo Horizonte Curitiba Palmas
Belém São Paulo Salvador Belo Horizonte
0.0 10.0 20.0 30.0 40.0 50.0 60.0 70.0 80.0 0.0 10.0 20.0 30.0 40.0 50.0 60.0 70.0 80.0 Fluorosis above
30% Fluorosis above
30%
2003 2010
No fluorosis or 1,4%
No fluorosis or 1,4%
Figure 1. Prevalence of fluorosis according to domain and year. SBBrasil 2003 and SBBrasil 2010.
Table 2. Standard errors and confidence intervals for prevalence estimates based on different sample sizes for the design effect of 2.
N
Estimated prevalence (%)
5 10 25 40 50
S.E. 95%CI S.E. 95%CI S.E. 95%CI S.E. 95%CI S.E. 95%CI
250 1.95 1.2;8.8 2.68 4.7;15.3 3.87 17.4;32.6 4.38 31.4;48.6 4.47 41.2;58.8
500 1.38 2.3;7.7 1.90 6.3;13.7 2.74 19.6;30.4 3.10 33.9;46.1 3.16 43.8;56.2
750 1.13 2.8;7.2 1.55 7.0;13.0 2.24 20.6;29.4 2.53 35.0;45.0 2.58 44.9;55.1
1,000 0.97 3.1;6.9 1.34 7.4;12.6 1.94 21.2;28.8 2.19 35.7;44.3 2.24 45.6;54.4
1,500 0.80 3.4;6.6 1.10 7.9;12.1 1.58 21.9;28.1 1.79 36.5;43.5 1.83 46.4;53.6
2,000 0.44 4.1;5.0 0.95 8.1;11.9 1.37 22.3;27.7 1.55 37.0;43.0 1.58 46.9;53.1
same is true, to a lesser degree, of São Paulo. The case of Salvador is emblematic, with an increase from 7.6% in 2003 (an acceptable value for a city which adds luoride to the water) to 44.3% in 2010. Finally, there is no explanation for the case of Florianópolis in which, although the value for 2010 was not that high, it repre-sented a 15 fold increase. In these municipalities there are no records of signiicant alterations in the tap water or of increases in the sources of luoride which justify such marked changes.
The deinition of luorosis and the methodological considerations necessary for its clinical and epidemio-logical diagnosis are signiicant, given the subjectivity of the classiication. Examinations for dental luorosis may contain more variations than those carried out for other oral health conditions.21 The dificulties in
diagnosing and characterizing milder cases of luorosis may be caused by the presence of opacity in the enamel not due to luoride. It is possible that there is confusion in the differential diagnosis between milder forms of luorosis and opacities not caused by luoride.11
Moreover, the diversity of the indexes proposed to measure luorosis, combined with the need for rigorous training for the examiners and the lack of a standardized and less subjective method have been highlighted as the causes of dificulties in comparing studies on the evaluating trends in prevalence,26 and is a problem for
the reliability and consistency of the data.
Various studies measuring luorosis have been carried out using the Dean index, or variations of the Dean and other indexes,3,13,17,18,22 showing various discrepancies
and limitations to the use.21
New research has been developed out in order to establish new methodologies and protocols in epide-miological surveys,23 aiming to improve diagnosis
using photographs. Some studies6,18 conclude that the
method using photographs is more reproducible and reliable than clinical examinations and can be used to diagnose dental luorosis.
Among the limitations of this study, the dificulty of working with two databases constituted from different sample designs and different training procedures stand out. The teams for the SBBrasil 2010 received trai-ning using slides with photographs of various stages of luorosis, so-called training in lux,d whereas in the
SBBrasil 2003 the training followed the traditional method. However, the intra and inter-examiner concor-dance values for the kappa statistic were not divulged in either situation.
Thus, depending on the training process and the characteristics of the examiner, it is possible that the examiners overestimated (Palmas in 2003 and Belo Horizonte in 2010) and underestimated (São Luís) luorosis. This seemed to occur even in different years (in 2003 and in 2010), as in the example of what happened in Palmas (prevalence dropped to 11% form 60%) and in Florianópolis (where there was an increase from 1% to 16.4%).
The discrepancies between the SBBrasil 2003 and the SBBrasil 2010 data are even more pronounced when independent studies published in the literature are introduced for comparison. For example, Aracaju, with a prevalence of 7.8% in 2003 and 25.4% in 2010. In an independent study4 in Aracaju of 196
schoolchil-dren aged between ive and 15 who underwent an oral examination using the Dean index found an 8.16% prevalence of dental luorosis.
Another important aspect concerns the estimative power, a fundamental question in establishing the statistical signiicance of the differences (between years, regions and domains, for example). In addition, the conidence interval of the prevalence is a population estimate and indicates the precision of this value in estimating the true parameter.
The interval estimate is calculated considering standard error and, therefore, is a function of the sample size itself. Thus, low values of prevalence would have the same standard error for a speciic sample size so that the effect is proportionally greater.25 The lower the
prevalence value the greater the proportional interval for a given sample.
In the SBBrasil 2010 the sample of 12-year-olds consi-dered an ideal coeficient of variation (ration between standard error and prevalence) to be below 15%. This means that, for an expected sample of 250 children, a reasonable power of precision can only be observed for North
2003 2010 Northeast
Southeast
South
Central-West
5.0
0.0 10.0 15.0 20.0 25.0 30.0
Figure 2. Prevalence of fluorosis according to region and year. SBBrasil 2003 and SBBrasil 2010.
rates of prevalence above 20%. From the point of view of methodological choice, this is because of the fact that the sample size considered dental caries as the reference health problem.e Although other health problems were
assessed in the SBBrasil 2010, a considerable number of them had higher rates of prevalence so that this sample size proved feasible in generating good estimates for the majority of situations.
In the case of luorosis, a health problem with a low prevalence, taking only the simple value (presence of luorosis without considering levels of severity) will generate estimates with a high coeficient of variation;
in other words, low precision. If levels of severity were included, precision would decrease still further, espe-cially when considering the prevalence of severe and very severe stages. In general, therefore, the power to establish differences between the study domains, with this sample size, is fairly limited.
This also occurs due to the fact that the conidence inter-vals are affected by design effect when the estimate is obtained based on a complex sample design. As can be seen in the formula (1), the standard error is calculated including the square of the design effect (d). In the SBBrasil 2010, the design effect was estimated to be
-200 0 200 400 600 800 1,000 1,200 1,400 1,600
Boa Vista
Recife
Palmas
Maceió
Curitiba
São Luís
Macapá
Brasília
Rio Branco
Porto Alegre
São Paulo
Vitória
Belo Horizante
João Pessoa
Campo Grande
Cuiabá
Porto Velho
Goiânia
Manaus
Natal
Aracaju
Fortaleza
Salvador
Belém
Rio de Janeiro
Teresina
Florianópolis
Figure 3. Percentage differences in the prevalence of fluorosis between 2003 and 2010. SBBrasil 2003 and SBBrasil 2010.
2.0; however, depending on how the ield research was carried out, this value was above that predicted in various state capitals. Allied to this, in some state capitals, the sample size of 250 was not reached, increasing the interval yet further and worsening the estimate. Thus, the formula shows that a combination of low prevalence, small sample size and high design effect produces high standard errors and, consequently, poor accuracy. For example, in the municipality of João Pessoa, with a sample of 139 children, there was an 8% prevalence with an interval of 2.4% to 23.8%, in other words, information which is next to useless.
Thus, the sample size for this health problem, estimated at 1,500 12-year-olds, leads to a discussion regarding the viability and feasibility of carrying out population studies for this health problem. A sample of 1,500 12-year-old children to be visited in their homes, if the same protocol was used as in the SBBrasil 2010, would call for approxi-mately 19 thousand households to be visited (estimating a 2% proportion of the population of 12-year-old children and a mean of four individuals per household). Visiting 19 thousand households means including more than 60 census tracts and carrying out research in all of the residences, without sampling fractions.
Obtaining estimates with poor precision, as well as invalidating the comparative analyses (as exempliied in the case of the state capitals), also makes it impos-sible to carry out other studies which aim to identify associated factors based on ecological type designs, as the points estimate is imprecise.
Another possibility would be to compare data from previous years, such as 2003, in which the study was
carried out based on the same criteria. However, there is the inherent problem of inconsistency in the data; although the data are considered reliable from the point of view of the validity of the index, it would be impossible to make a comparison as different models of analysis were used in the two surveys. The conidence intervals were calculated in different ways, in 2003 as if it were a simple causal sample and in 2010 conside-ring weighting and cluster effects. This means that the 2003 intervals are artiicially lower (proportionally) than those of 2010, as, in this case, the intervals were corrected by weighting “lengthening” the values. Thus, in practice, it is not possible to compare the results for the intervals, nor to carry out statistical tests.
To conclude, it is not possible to analyze trends in dental luorosis in Brazil using the data available from the 2003 and 2010 studies, and these data are merely exploratory indicators of the prevalence of luorosis. In general, the analysis conducted in this article indicates that discussion is needed concerning the technical and economic viabi-lity of investigating dental luorosis in population based surveys for the country as a whole. This type of research should be carried out using local epidemiological studies with appropriate sampling plans.
Thus, it should be emphasized that this article does not aim to discourage epidemiological studies into dental luorosis, nor to invalidate the data produced by the SBBrasil 2003 and SBBrasil 2010. The data have been essential in reinforcing the need for such studies to have speciic and directed sampling plans in order to serve as basic guidance to strategies for controlling luoridation of tap water, as well as monitoring the occurrence of episodes of endemic luorosis.
1. Aoba T, Fejerskov O. Dental fluorosis: chemistry and biology. Crit Rev Oral Biol Med. 2002;13(2):155-70. DOI:10.1177/154411130201300206
2. Beltrán-Aguilar ED, Barker L, Dye BA. Prevalence and severity of dental fluorosis in the United States, 1999-2004. NCHS Data Brief. 2010;(53):1-8.
3. Cangussu MCT, Narvai PC, Castellanos Fernandez R, Djehizian V. A fluorose dentária no Brasil: uma revisão crítica. Cad Saude Publica. 2002;18(1):7-15. DOI:10.1590/S0102-311X2002000100002
4. Carvalho RWF, Valois RBC, Santos CNA, Marcellini PS, Bonjardim LR, Oliveira CCC, et al. Estudo da prevalência de fluorose dentária em Aracaju.
Cienc Saude Coletiva. 2010;15(Supl 1):1875-80.
DOI:10.1590/S1413-81232010000700101
5. Costa AJL, Nadanovsky P. Validade na pesquisa odontológica. In: Luiz RR, Costa AJL, Nadanovsky P, organizadores. Epidemiologia e bioestatística na pesquisa odontológica. São Paulo: Atheneu; 2005. p.125-41.
6. Cruz-Orcutt N, Warren JJ, Broffitt B, Levy SM, Weber-Gasparoni K. Examiner reliability of fluorosis scoring: a comparison of photographic and clinical examination findings. J Public Health Dent. 2012;72(2):172-5. DOI:10.1111/j.1752-7325.2012.00315.x
7. Cypriano S, Pecharki GD, Sousa MLR, Wada RS. A saúde bucal de escolares residentes em locais com e sem fluoretação das águas de abastecimento público na região de Sorocaba, São Paulo, Brasil. Cad Saude Publica. 2003;19(4):1063-71. DOI:10.1590/S0102-311X2003000400028
8. Dean HT. The investigation of physiological effects by the epidemiological method. In: Moulton FR, editor. Fluorine and dental health. Washington (DC): American Association for the Advancement of Science; 1942. p.23-31. (Publication 19).
9. Denbesten P, LI W. Chronic fluoride toxicity: dental fluorosis. Monogr Oral Sci. 2011;22:81-96. DOI:10.1159/000327028
The Pesquisa Nacional de Saúde Bucal 2010 (SBBrasil 2010, Brazilian Oral Health Survey) was financed by the General Coordination of Oral Health/Brazilian Ministry of Health (COSAB/MS), through the Centro Colaborador do Ministério da
Saúde em Vigilância da Saúde Bucal, Faculdade de Saúde Pública at Universidade de São Paulo (CECOL/USP), process
no. 750398/2010.
This article underwent the peer review process adopted for any other manuscript submitted to this journal, with anonymity guaranteed for both authors and reviewers. Editors and reviewers declare that there are no conflicts of interest that could affect their judgment with respect to this article.
The authors declare that there are no conflicts of interest. 10. Ellwood R, O’Mullane D, Clarkson J, Driscoll W.
A comparison of information recorded using the Thylstrup Fejerskov index, Tooth Surface Index of Fluorosis and Developmental Defects of Enamel index.
Int Dent J. 1994;44(6):628-36.
11. Fejerskov O, Manji F, Baelum V, Moller I. Fluorose dentária: um manual para profissionais de saúde. São Paulo: Editora Santos; 1994.
12. Forte FDS, Freitas CHSM, Sampaio FC, Jardim MCAM. Fluorose dentária em crianças de Princesa Isabel, Paraíba. Pesq Odontol Bras. 2001;15(2):87-90. DOI:10.1590/S1517-74912001000200002
13. Frazão P, Peverari AC, Forni TIB, Mota AG, Costa LR. Fluorose dentária: comparação de dois estudos de prevalência. Cad Saude Publica. 2004;20(4):1050-8. DOI:10.1590/S0102-311X2004000400020
14. Holloway PJ. Systematic review of public water fluoridation. Community Dent Health.
2000;17(4):261-2.
15. Horowitz HS, Driscoll WS, Meyers RJ, Heifetz SB, Kingman A. A new method for assessing the prevalence of dental fluorosis: the Tooth Surface Index of Fluorosis. J Am Dent Assoc. 1984;109(1):37-41.
16. Jones S, Burt BA, Petersen PE, Lennon MA. The effective use of fluorides in public health.
Bull World Health Organ. 2005;83(9):670-6.
DOI:10.1590/S0042-96862005000900012
17. Mabelya L, Hof MA, Konig KG, Palenstein Helderman WH. Comparison of two indices of dental fluorosis in low, moderate and high fluorosis Tanzanian populations. Community Dent Oral Epidemiol.
1994;22(6):415-20.
18. Mohamed AR, Thomson WM, Mackay TD. An epidemiological comparison of Dean’s index and the Developmental Defects of Enamel (DDE) index.
J Public Health Dent. 2010;70(4):344-7. DOI:
10.1111/j.1752-7325.2010.00186.x
19. Parnell C, Whelton H, O’Mullane D. Water
fluoridation. Eur Arch Paediatr Dent. 2009;10(3):141-8.
20. Pendrys DG. The fluorosis risk index: a method for investigating risk factors. J Public Health Dent.
1990;50(5):291-8.
21. Pendrys DG. Analytical studies of enamel fluorosis: methodological considerations. Epidemiol Rev.
1999;21(2):233-46.
22. Pereira AC, Moreira BH. Analysis of three dental fluorosis indexes used in epidemiologic trials. Braz
Dent J. 1999;10(1):29-37.
23. Soto-Rojas AE, Martinez-Mier EA, Ureña-Cirett J, Jackson RD, Stookey GK. Development of a standardisation device for photographic assessment of dental fluorosis in field studies. Oral Health Prev Dent. 2008;6(1):29-36.
24. Thylstrup A, Fejerskov O. Clinical appearance of dental fluorosis in permanent teeth in relation to histologic changes. Community Dent Oral Epidemiol. 1978;6(6):315-28.
25. United Nations, Department of Economic and Social Affairs, Statistic Division. Household sample surveys in developing and transition countries. New York; 2005. (Series F, 96).
26. Whelton HP, Ketley CE, McSweeney F, O´Mullane DM. A review of fluorosis in the European Union: prevalence, risk factors and aesthetic issues. Community
Dent Oral Epidemiol. 2004;32(Suppl 1):9-18.
DOI:10.1111/j.1600-0528.2004.00134.x
27. Yeung CA. A systematic review of the efficacy and safety of fluoridation. Evid Based Dent.
ERRATUM
In the article: “Methodological discussion about prevalence of the dental luorosis on dental health surveys” publi-shed by the “Revista de Saúde Pública”, volume 47, 2013, in the Abstract.
Where you read:
OBJECTIVE: To evaluate the inluence of social inequalities of individual and contextual nature on untreated dental caries in Brazilian children.
METHODS: The data on the prevalence of dental caries were obtained from the Brazilian Oral Health Survey (SBBrasil 2010) Project, an epidemiological survey of oral health with a representative sample for the country and each of the geographical micro-regions. Children aged ive (n = 7,217) in 177 municipalities were examined and their parents/guardians completed a questionnaire. Contextual characteristics referring to the municipalities in 2010 (mean income, luorodized water and proportion of residences with water supply) were supplied by the Brazilian Institute of Geography and Statistics – Fundação Instituto Brasileiro de Geograia e Estatística. Multilevel Poisson regression analysis models were used to assess associations.
RESULTS: The prevalence of non-treated dental caries was 48.2%; more than half of the sample had at least one deciduous tooth affected by dental caries. The index of dental caries in deciduous teeth was 2.41, with higher igures in the North and North East. Black and brown children and those from lower income families had a higher prevalence of untreated dental caries. With regards context, the mean income in the municipality and the addition of luoride to the water supply were inversely associated with the prevalence of the outcome.
CONCLUSIONS: Inequalities in the prevalence of untreated dental caries remain, affecting deciduous teeth of children in Brazil. Planning public policies to promote oral health should consider the effect of contextual factors as a determinant of individual risk.
You should read:
OBJECTIVE: To analyze the limitations of studying dental luorosis in cross-sectional studies.
METHODS: Data from the Oral Health of the Brazilian Population (SBBrasil 2003) and the Brazilian Oral Health Survey (SBBrasil 2010) were used. Epidemiological trends for luorosis in 12-year-old Brazilians, aspects of the reliability of the data as well as the accuracy of the estimates are assessed for these two studies. The distribution of prevalence of luorosis was carried out according to the domains of the study (state capitals and regions) and the year in which the study took place. The conidence intervals (95%CI) were also shown for simple prevalence (without taking into account level of severity).
RESULTS: The prevalence of dental luorosis showed considerable variation, between 0% and 61% in 2003 and 0% and 59% in 2010. Inconsistencies were observed in the data in individual terms (for year and for domain) and in the behavior of the trend. Considering the expected prevalence and the data available in the two studies, the minimum sample size should be 1,500 individuals in order to obtain 3.4% and 6.6% conidence intervals, considering the minimum coeficient of variation to be 15%. Given the subjectivity in its classiication, examinations for dental luorosis may show more variation than those for other oral health conditions. The power to establish differences between the domains of the study with the sample of the SBBrasil 2010 is quite limited.