Supply Strategy: A Quasi-Experiment on the Number
And Location of Suppliers
André Luis de Castro Moura Duarte † Insper
Rafael Borges de Souza Ω Insper
Flávio Romero Macau ¥ Universidade Paulista - UNIP Leandro Januario de Souza * Universidade Nove de Julho - UNINOVE
1. INTRODUCTION
The efect of globalized markets and increased competitiveness among companies is the continuous improvement of ways of purchasing raw materials, producing and selling goods and services (QUINTENS, PAUWELS and MATTHYSSENS, 2006). Outsourcing has become a strategic option to attain objectives related to price, quality and satisfaction demanded by clients (GUNASEKARAN and IRANI, 2010). Authors such as DiSerio and Sampaio (2001) and Lima and Campos Filho (2009) point out that even adopting best practices in the manufacturing process does not guarantee that a company is competitive, as it is dependent on the whole supply chain. The supply chain may have a number of conigurations, and there is ample debate on: (i) the ideal number of suppliers for a speciic item and (ii) supplier location (GUARNIERI, 2015).
The ideal number of suppliers has been discussed by Treleven and Schweikhart (1988) as one of a company’s most strategic decisions, shaping its supply chain. With the argument that competition between suppliers is healthy, the authors observed that many companies choose
This article has a Creative Commons License - Attribution 3.0 Not Adapted.
Corresponding author:
† Insper.
E-mail: [email protected]
Ω Insper.
E-mail: [email protected] ¥ Universidade Paulista - UNIP. E-mail: [email protected] * Universidade Nove de Julho - UNINOVE. E-mail: [email protected]
Received: 04/11/2016. Revised: 09/05/2016. Accepted: 09/05/2016. Published Online: 07/01/2017.
DOI: http://dx.doi.org/10.15728/bbr.2017.14.5.5
ABSTRACT
Objective: Evaluate the impact of a second supply source on price, quality and stock levels at the purchasing company. Relevance: he supply strategy deines how many suppliers an item should have and where it should be located. If working with a single supplier may bring relational beneits, working with multiple sources may reduce opportunism risks. If a local supplier reaps beneits on account of its proximity, a global supplier may result in lower costs. Methodology: he quasi-experimental method was used to follow-up a purchasing policy change at an auto parts company, which took on a second supply source for low complexity items. he research collected data on costs, quality and stock coverage for 1,480 items between 2007 and 2012, analysing new supplier’s entrance and location. Results: Introducing a second supplier reduced the price, especially when a new international supplier was introduced. Decreases in quality or increases in stock coverage were not observed.
BBR
14,3
529
to work with multiple sources for the same item. This was questioned with the advanceof lean production philosophy, which considers the construction of close relationships with a reduced number of suppliers as a better approach (HONG and HAYYA, 1992; GANESHAN, TYWORTH and GUO, 1999; JAYARAM, VICKERY and DROGE, 2008). The best strategy for working with suppliers is debated in models that suggest single, dual
and multiple sourcing (eg in LI and DEBO, 2009 and FENG and SHI, 2012).
There is also discussion about the supply source location, whether it is better to rely on local or international irms. To Kotabe and Murray (2004) a global sourcing strategy is a tendency in recent decades, as companies have had positive experiences with its execution in the majority of cases. The possibility of reduced costs is a strong driver (HUANG and HU, 2013; ALVES FILHO et al., 2004). In the car industry the purchase of raw materials is usually the highest cost component for the inal product, to the extent that it represented up to 58% of the total cost in the Brazilian car parts industry in 2013 - a 4% increase in relation to 2012 (SINDIPEÇAS, 2013). Thus, Brazilian companies must be prepared to compete in global markets, taking part in a global supply chain, with the risk of attaining less proitability and decreased importance in the sector.
Studies on the strategy to select and manage supplies which establish the impact of new suppliers entering an established chain allow managers to make better decisions to conigure their supply chains. Thus, the aim of this study is to evaluate how the entrance of a second supply source, both local and international, impacts the price, quality and stock levels of a purchasing company that previously had the policy of working with single suppliers.
This paper is structured as follows. Section 2 introduces the theoretical references about strategic sourcing, presenting the hypothesis. Section 3 describes the research methodology. Sections 4 and 5 present results and discussions. Section 6 draw conclusions, contributions, limitations and future research possibilities.
2. THEORETICAL REFERENCE
To explain how companies obtain a competitive advantage Porter (1985) introduces the value chain concept, where a group of interrelated activities performed by the company consistently add value to clients. Superior strategies are those that produce cost advantages or diferentiation, depending upon the company’s abilities to systematically take the right decisions, assuming tradeofs and evolving beyond operational performance. In its struggle to obtain cost advantages a irm can specialize in its core activities and outsource the rest, focusing its attention in areas where it has superior competence when compared to the open market of products and services (WILLIAMSON, 1981). Outsourcing implies that, to a certain extent, the company starts relying in a number of suppliers to establish costs, assure quality and manage stocks. According to Porter’s (2008) ive forces model, stronger suppliers drive harder bargains, resulting in diiculties for the company to sustain a superior (and attractive) strategic position. Therefore, allowing a supplier to be part of the value chain involve risks, and periodically redesign procurement contracts is an important topic to sustain superior cost advantages.
BBR
14,3
530
may identify suppliers who already have the knowledge, know-how and tools necessary to manufacture such a product (MARION, THEVENOT and SIMPSON, 2007). Outsourcing can also be an option to leverage resources and concentrate skills on what is really central to the buyer’s activity (MANTEL, TATIKONDA and LIAO, 2006).
Outsourcing involves the purchase of a functionality (product or service) from one or more suppliers (HARLAND, 1996; TADELIS, 2007; CORREA, 2010; DOU and SARKIS, 2010; ITO, TOMIURA and WAKASUGI, 2011). The supplier selection strategy should consider the competitive priorities of each product or service (eg cost, quality, reliability, lexibility and speed) and add value for the inal client (CORREA, 2010; GAITHER and FRAZIER, 2001). In addition, when a cooperative path is taken in the chain, suppliers and clients are able to improve the coordination of shipments and production, sharing knowledge and technology to integrate and optimize the chain, providing mutual beneits (LEWIS, HAYWARD and KASI, 2013). The decision to outsource presents risks and opportunities, enhanced by two important strategic questions: (i) the ideal number of suppliers for a speciic item and (ii) supplier location.
For the irst strategic question, regarding the ideal number of suppliers, Trevelen and Schweikhart (1988) introduced the debate on strategic sourcing, identifying the options
of single and multiple sourcing. Single sourcing is the buyer’s option of acquiring all of
his needs for a speciic item or sub-system from a single supplier. This option suggests the development of long-term relationships, with exchanges of knowledge and technology and extensive coordination, beneiting the supply chain. However, multiple sourcing is the
buyer’s selection of more than one supplier for a speciic item or sub-system, maximizing the result by balancing cost and risk variables (FENG and SHI, 2012) – in a premise that using multiple suppliers results in lower costs and dilutes the supply risk. An intermediary path proposed by Yu, Zeng and Zhao (2009) is dual sourcing, with the buyer selecting two suppliers: the main one, with a larger business segment (eg on account of better performance or price); and the other as a support, to minimize risks and retain competitive prices, quality and level of service. The authors argue that it would be possible to maintain a more collaborative relationship with at least one of the suppliers in this way, as well as avoiding opportunist relationships on account of the constant presence of the competitor’s “shadow”.
Tunca and Wu (2013) propose that when competition between multiple suppliers is introduced, there are long-term beneits in the chain, although there is decreased eiciency in the short term. It would be easier to adapt to environmental changes, given the higher number of players, reducing uncertainties in the purchasing process (ADAMS, KHOJA and KAUFFMAN, 2012). On the other hand, for Chung, Talluri and Narasimham (2010) a single supplier is the most advantageous option, even given less favourable price and lexibility. A stronger relationship between the buyer and supplier facilitates information low, with long-term beneits. With no consensus that can be generalized for every situation, buyers must analyse their options regarding suppliers’ capacity, demand uncertainty, cost information and learning curves before taking a decision (LI and DEBO, 2009).
BBR
14,3
531
services with low speciicity can be easily provided by the market, resulting in suppliersthat may better exploit economies of scale. On the other hand, products and services with higher speciicity are harder to obtain, resulting in core competences that are internalized (verticalization) or acquired in a harder procurement environment (ARNOLD, 2000).
For the second strategic question, related to supplier location, changes in recent decades has meant that national borders have stopped being insurmountable barriers to supply chain management, according to the global sourcing concept. It is the practice of identifying
opportunities and acquiring products and services which have the best conditions for price, quality and delivery available in the world or, that is, within or outside of the buyers’ country of origin (LOPPACHER et al., 2006; CORREA, 2010). Purchasing companies increasingly need to develop global strategies which allow them to integrate and coordinate the low of materials, processes, projects, technologies and supplies around the world to retain or raise their position in the market (MONCZKA and TRENT, 1991; STEVENS, 1995). In the case of multinational companies, this strategy could be both centralized, with the main decisions taken by head oices (eg selecting suppliers, negotiation and contracts) and decentralized, with these taken by subsidiaries (LOPPACHER et al, 2006). Li and Debo (2009) reinforce that there are a variety of strategic options to deine the best choice for a supply chain. Establishing this design becomes a central supply strategy activity, whether involving single or multiple, local or global suppliers (ALLON and MIEGHEN, 2010).
In the auto industry, Alves Filho et al (2004) observe that although companies at the end of the chain (e.g. automakers and system providers) trying to coordinate the various links, there are limitations on account of three factors. Firstly, due to the chain’s structure, as right at the irst supplier level, major multinationals, with proprietary technology which serve various competing assemblers, develop their own supplier base, exercising a major inluence on them. Secondly, because the second level suppliers, usually of a smaller scale, serve clients from diferent industries (not just the car industry), adapting in accordance with market opportunities (e.g. capacity directed towards the sector which pays more). Thirdly, because the companies at the third or fourth level are usually large raw material companies (e.g. steel), with major bargaining power which are less likely to adopt speciic practices. Too much trust from a buyer in the car industry could lead to opportunistic behaviour from suppliers, with the risk of price escalation in the single sourcing strategy (GUNDLACH, ACHROL and MENTZER, 1995). However, a new supplier’s entrance could lead the current supplier to lower its prices in order to maintain his market participation/share. For less complex parts internal sourcing is hardly efective (given economies of scale), and value is added by a superior procurement position.
Hypothesis 1: current supplier reduces prices given the entry of a new supplier.
In relation to growing attention to guaranteeing the quality of items produced outside of the country of origin (e.g. products from China), literature does not provide unambiguous evidence of a decrease in quality when the volume of imports increases or even evidence of whether the number of problems with international suppliers is of the same order of magnitude as with local suppliers (GRAY, ROTH and LEIBLEIN, 2009). Porter (1985) states that new entrants frequently have superior operational eiciency, due more technologically advanced equipment with superior productivity. Therefore, new suppliers should be able to provide superior quality at the same price. Kumar, Zampogna and Nansen (2010) express their concerns that there may be a tendency for continuous improvement with single sourcing, while multiple sourcing could result in weaker links and poorer quality. The insertion of a
new supplier, especially an international one, could result in quality-related problems.
BBR
14,3
532
Regarding the importance of global sourcing for company competitiveness, very little
research has been performed on the impacts of the decisions taken (GUNASEKARAN and IRANI, 2010). There is a greater complexity in inventory management when the buyer adopts the strategy of various suppliers, especially if they are global (TREVELEN and SCHWEIKHART, 1988). Therefore, a new supplier’s entrance, especially if it is international, should make the low and management of raw materials diicult, leading the buyer to increase its stock levels for purchases in larger batches. In other words:
Hypothesis 3: purchasing company increases stock levels given the entry of a new supplier.
3. METHODOLOGY
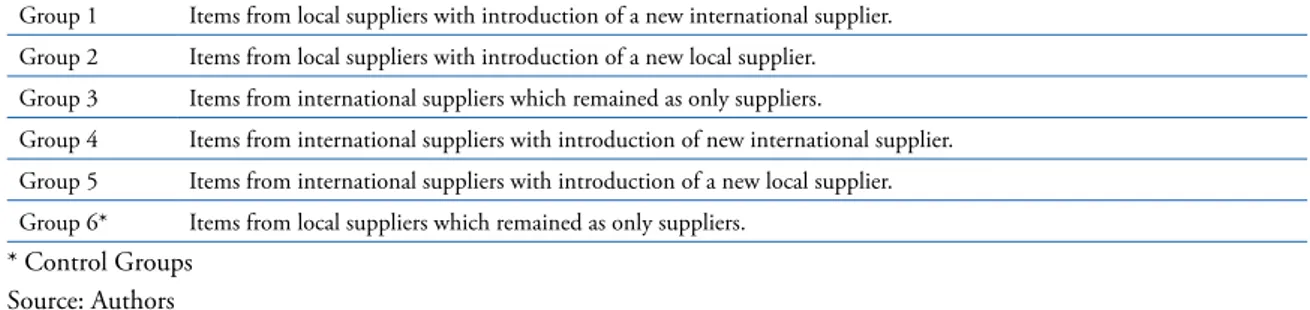
Purchasing strategy analyses should be carried out at the part family level (TREVELEN and SCHWEIKHART, 1988), and purchasing decisions (e.g. make or buy) should analyse both suppliers and items purchased (MANTEL, TATIKONDA and LIAO, 2006). Therefore, this study considers the item as the unit of analysis, more speciically low complexity SKUs (systems and sub-systems comprising large numbers of components were not part of the scope). The database analysed considered highly commodotizable items, acquired by an auto parts multinational located in Brazil, but with global presence and access to global supplies. The data collected refers to the period between October 2007 and September 2012, i.e. ive iscal years of the company. From the total array of purchases a population of 1.480 low complexity items were identiied, which were purchased every year during this period, and divided into six groups depending upon its source (Table 1).
Table 1. Distribution of the groups of items purchased.
Group 1 Items from local suppliers with introduction of a new international supplier.
Group 2 Items from local suppliers with introduction of a new local supplier. Group 3 Items from international suppliers which remained as only suppliers.
Group 4 Items from international suppliers with introduction of new international supplier.
Group 5 Items from international suppliers with introduction of a new local supplier. Group 6* Items from local suppliers which remained as only suppliers.
* Control Groups Source: Authors
BBR
14,3
533
Hypothesis 1: current supplier reduces prices given the entry of a new supplier. Hypothesis 2: current supplier reduces quality given the entry of a new supplier.
Hypothesis 3: purchasing company increases stock levels given the entry of a new supplier.
4. RESULTS
The results of analyses for price, quality and stock variables will be presented and discussed in this section.
4.1. ANALYSIS OF PRICE VARIATION
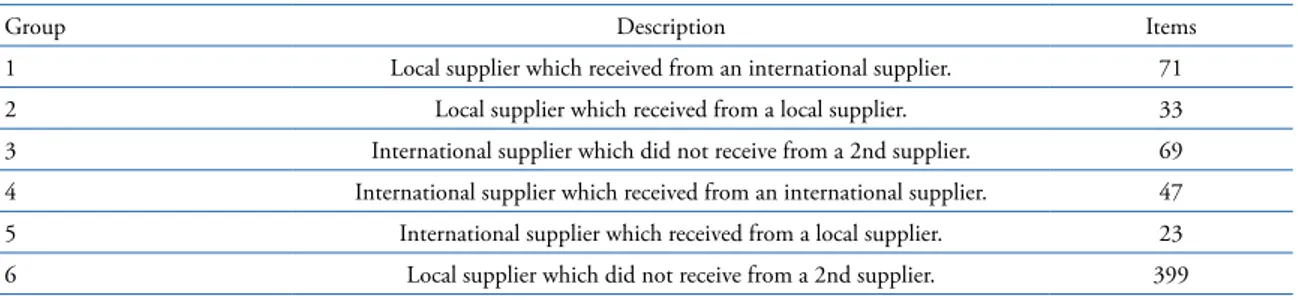
The initial table included 1,480 diferent items to analyse the PRICE practised by suppliers. When handling the data, items supplied in only one of the ive years (-226), with a volume of less than one part per week (-49), with a price variation higher than 200% (-47) indicating an atypical phenomenon (outlier) were removed. Items supplied by other companies from the same group, such as the head oice, subsidiaries and joint ventures, whether local or international (-514) were also eliminated. Missing values from the 2012 supply column (-2) were removed, resulting in a inal sample of 644 items, distributed among the 6 groups in Table 2.
Table 2. Group distribution for price analysis.
Group Description Items
1 Local supplier which received from an international supplier. 71
2 Local supplier which received from a local supplier. 33
3 International supplier which did not receive from a 2nd supplier. 69 4 International supplier which received from an international supplier. 47
5 International supplier which received from a local supplier. 23
6 Local supplier which did not receive from a 2nd supplier. 399
Source: authors.
The price variation for a given item was calculated as the average price practiced during 2012 minus the maximum average annual value practiced between 2007 and 2011, divided by the maximum average annual value practiced between 2007 and 2011:
PRICE VARIATION = [2012 Average – Maximum (2007-2011 averages)]/ Maximum (2007-2011 averages)
The resulting descriptive statistics are described in Table 3. There was an average price reduction in all of the groups, indicating the search for lower costs by the car parts chain, even more so when considering that the values were not corrected for inlation during the period. Distribution of the price variation in each group could be understood as close to normal, even for groups 2 and 6, which present more accentuated kurtosis. The next step was to carry out a single factor ANOVA test (Table 4), which indicated that there were diferences between the price variations in the groups.
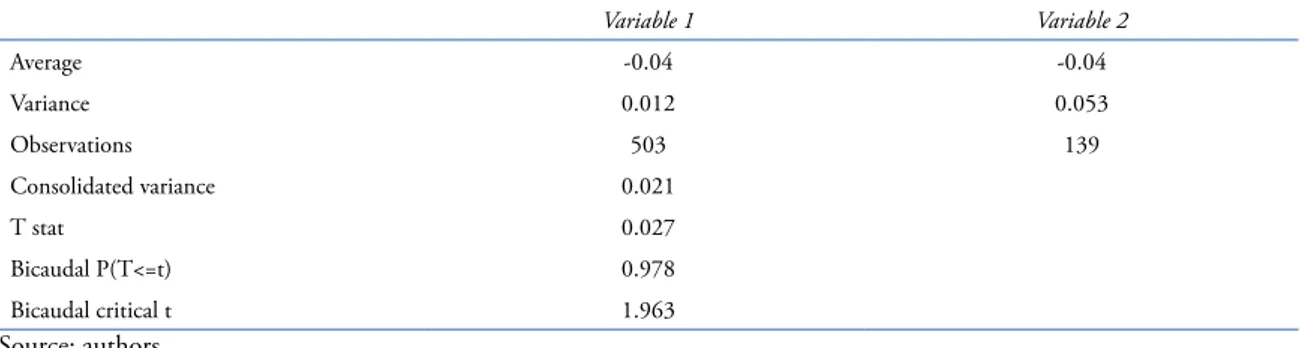
Having noted the diference between averages for at least one of the six groups, it was investigated if there was a diference in price variation between local (1 + 2 + 6) and international suppliers (3 + 4 + 5), independent of a new supplier entering. A statistically signiicant diference between these two sub-groups (Table 5) was not conirmed, i.e. price variation observed in the local supplier sub-group was not statistically diferent from that observed in the international supplier sub-group. A similar average price reduction was observed in both cases. So, international location does not have efect on price variation?
BBR
14,3
534
as single suppliers (Groups 3 + 6). As the hypothesis was refuted (Table 6), it is concluded that the entrance of a new supplier alters the price, i.e. there is a statistically signiicant diference between the groups which acquired or did not acquire a new competitor.
The original H1 was split into H1(a) and H1(b):
H1(a): The current international supplier (Group 3) reduces price given the entry of a second supplier (Groups 4 + 5).
H1(b): The current local supplier (Group 6) reduces price given the entry of a second supplier (Groups 1 + 2).
These split hypotheses were submitted to a T-test (Tables 7 and 8). For H1(a), alternative hypothesis H0 was not refuted, i.e. it is not possible to conirm that the entrance of another supplier altered the price when the previous supplier was international. For H1(b) alternative hypothesis H0 was refuted, i.e. the entrance of another supplier altered the price when the previous supplier was local.
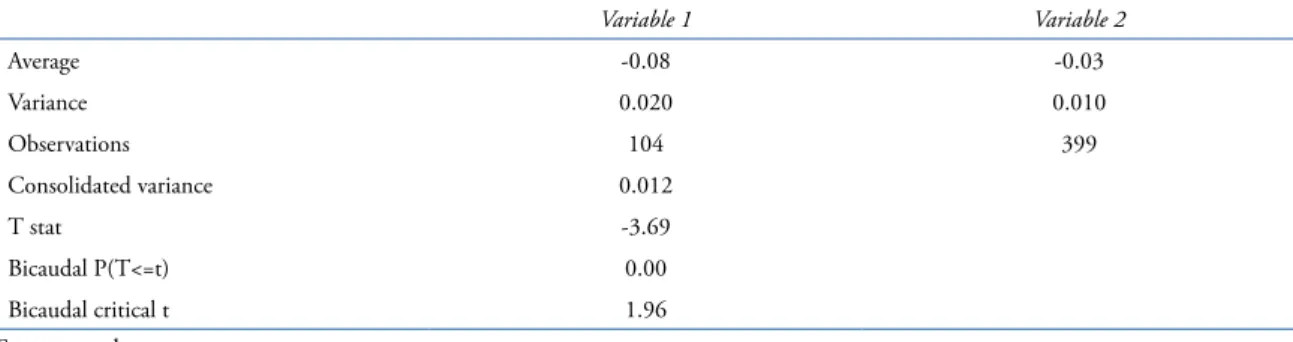
A inal analysis was carried out for this sub-group, evaluating if the entrance of both new international suppliers (1) and new local suppliers (2) had an impact on the price variation for the local supplier. H1(b) was split into H1 (b1) and H1(b2):
H1(b1): current local supplier (Group 6) reduces price given the entrance of a second international supplier (Groups 1).
H1(b2): current local supplier (Group 6) reduces price given the entrance of a second local supplier (Groups 2).
Table 3.Descriptive price variation statistics.
1 2 3 4 5 6
Average -9.5% -4.2% -4.1% -6.4% -0.6% -3.4%
Standard deviation 0.15 0.12 0.23 0.29 0.04 0.10
Sample variance 0.02 0.01 0.05 0.08 0.01 0.01
Kurtosis 1.0 5.4 2.7 -0.6 2.8 7.9
Asymmetry -1.3 -2.4 0.9 -0.6 -1.8 -2.0
Count 71 33 69 47 23 399
Level of reliability (95.0%) 0.03 0.04 0.05 0.08 0.02 0.01
Source: authors.
Table 4. Single factor ANOVA for price variation.
Variation source SQ gl MQ F P-value Critical F
Between groups 0.28 5 0.06 2.66 0.021 2.22
Within the groups 13.30 636 0.02
Total 13.57 641
Source: authors.
Table 5.T-test for price variations between local and international suppliers
Variable 1 Variable 2
Average -0.04 -0.04
Variance 0.012 0.053
Observations 503 139
Consolidated variance 0.021
T stat 0.027
Bicaudal P(T<=t) 0.978
Bicaudal critical t 1.963
BBR
14,3
535
Table 6. T-test for price variation between suppliers which acquired a competitor and those which remained as single suppliers.
Variable 1 Variable 2
Average -0.06 -0.04
Variance 0.034 0.016
Observations 174 468
Consolidated variance 0.021
T stat -2.33
Bicaudal P(T<=t) 0.02
Bicaudal critical t 1.96
Source: authors.
Table 7. T-test for price variation for the entry of a new supplier (4 + 5) versus a single international supplier’s price (3).
Variable 1 Variable 2
Average -0.04 -0.04
Variance 0.056 0.053
Observations 70 69
Consolidated variance 0.054
T stat -0.09
Bicaudal P(T<=t) 0.92
Bicaudal critical t 1.98
Source: authors.
Table 8. T-test for price variation for the entrance of a new supplier (1 + 2) versus the price of a single local supplier (6).
Variable 1 Variable 2
Average -0.08 -0.03
Variance 0.020 0.010
Observations 104 399
Consolidated variance 0.012
T stat -3.69
Bicaudal P(T<=t) 0.00
Bicaudal critical t 1.96
Source: authors.
These split hypotheses were submitted to a T-test (Tables 9 and 10). For H1(b1) alternative hypothesis H0 was refuted, i.e. the entrance of a new international supplier alters the price when the previous supplier was local. For H1(b2) the alternative hypothesis H0 was not refuted, i.e. there are no indications that the entrance of a new local supplier alters the price when the previous supplier is also local.
As a partial conclusion, only the local supplier was sensitive to the price variation with the arrival of new competition, especially when it was international. On average, there is a 9.5% reduction in these circumstances, against a 4.3% reduction in a general situation. Therefore, H1 is partially conirmed, according to which the entrance of a second supplier makes the current supplier reduce its prices.
4.2. ANALYSIS OF QUALITY VARIATION (DEFECTS IN PPM)
BBR
14,3
536
item was calculated as the average number of rejects in parts per million (PPM) for 2012, less the maximum annual average value between 2007 and 2011, divided by the maximum annual average value between 2007 and 2011:
VAR PPM = [2012 average – Maximum (2007-2011 averages)]/ Maximum (2007-2011 averages)
It was not possible to perform the hypothesis test on the PPM, as the kurtosis and variance are extremely high. Logarithmic transformations did not suiciently resolve the problem and, therefore, a simpler approach was applied, with a weaker strength of analysis. For each item it was established if the PPM remained stable (0), deteriorated (-1) or improved (1) in the 2012 average, when compared to the worst moment between 2008 and 2011– thereby creating a dummy variable.
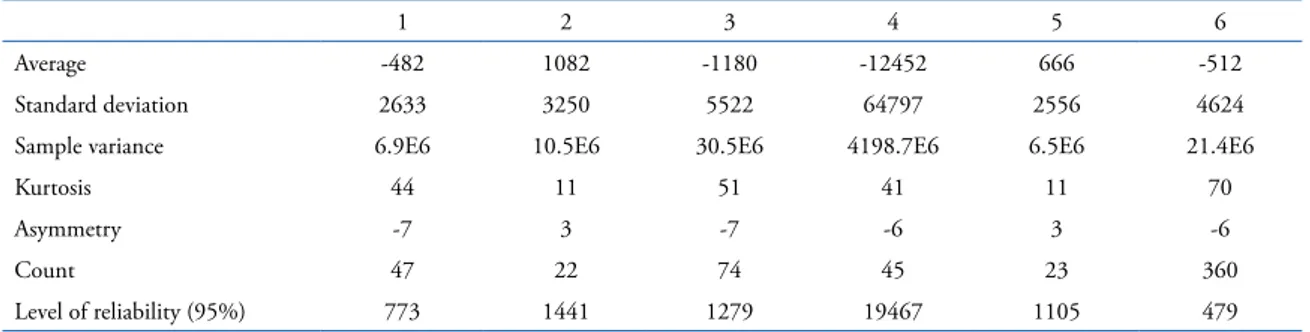
There were varying results (Table 13), indicating a tendency towards stability, except for Group 4 (international suppliers which did not change), where there was an expressive improvement. The following general behaviour were noted regarding quality issues:
Local supplier with new competition from an international supplier had the same (67%) or worse (24%) amount of quality problems.
Local supplier with a new competition from a local supplier had the same (43%) or worse (38%) amount of quality problems.
International supplier which did not change had the same (84%) or worse (16%) amount of quality problems.
International supplier with a new competition from an international supplier had the same (66%) or worse (25%) amount of quality problems.
International supplier with a new competition from a local supplier had the same amount of quality problems (50%), with an undeined trend for the remaining percentage.
Local supplier which did not change had the same amount of quality problems (81%).
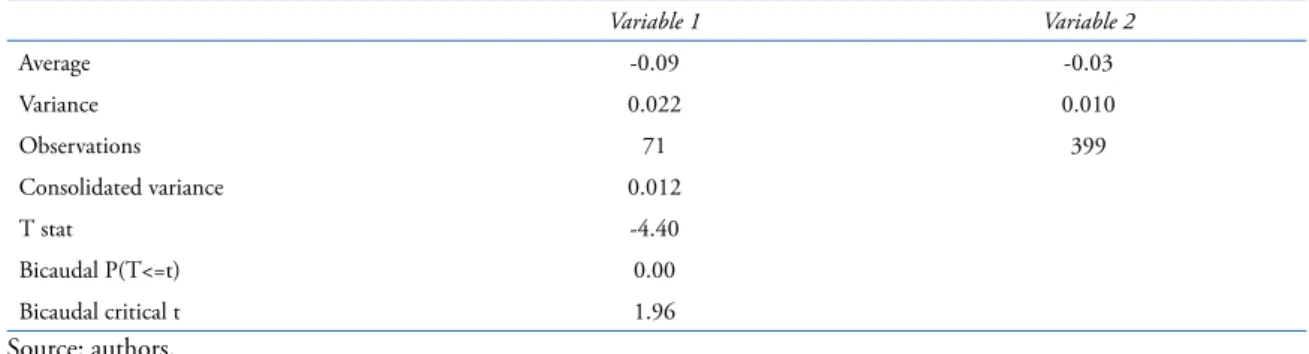
Table 9. T-test for price variation for the entrance of a new international supplier (1) versus a single local supplier (6).
Variable 1 Variable 2
Average -0.09 -0.03
Variance 0.022 0.010
Observations 71 399
Consolidated variance 0.012
T stat -4.40
Bicaudal P(T<=t) 0.00
Bicaudal critical t 1.96
Source: authors.
Table 10. T-test for price variation for the entrance of a new local supplier (2) versus a single local supplier (6).
Variable 1 Variable 2
Average -0.04 -0.03
Variance 0.014 0.010
Observations 33 399
Consolidated variance 0.01
T stat -0.46
Bicaudal P(T<=t) 0.65
Bicaudal critical t 1.96
BBR
14,3
537
Aggregating the data, comparing the group of local suppliers which received competition (Groups 1+2) or otherwise (Group 6), a very slight tendency for quality to deteriorate is observed (Table 14). Similarly, comparing the group of international suppliers which had competition (Groups 4+5) or otherwise (Group 3), a slight tendency for quality to deteriorate is observed (Table 15).
As a partial conclusion, there is no clear impact on quality when inserting a new supplier. The tendency for quality to be maintained where there are no competitors and a slight deterioration when this action takes place is observed both for local and international suppliers. It can be argued that supply quality drops slightly when prices are reduced.
4.3. ANALYSIS OF STOCK COVERAGE
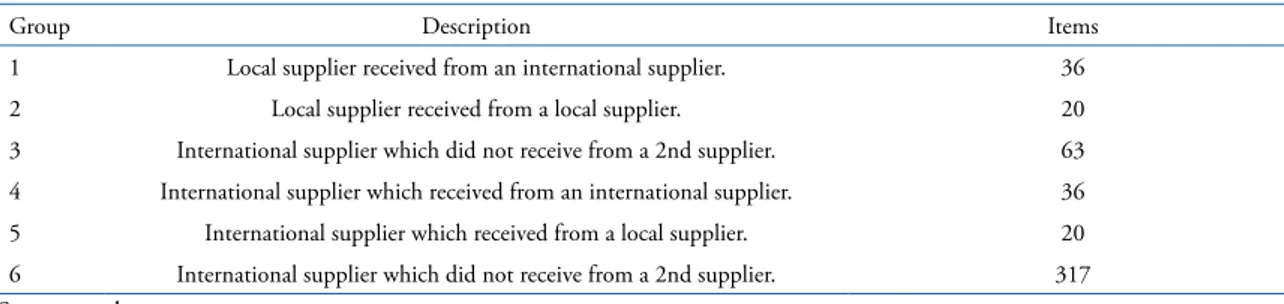
In order to analyse the STOCK coverage practised by suppliers, representing stock coverage days at the purchasing company, the initial table included 1,480 diferent items. The procedures from price and quality were repeated, resulting in a inal sample of 492 items, distributed between the groups in Table 16. The formula used by the company indicates coverage as being the inal quantity divided by the quantity requested, multiplied by 30 days and measured on the day of the inventory. The coverage variation was calculated as:
COVERAGE VARIATION = [2012 average – Maximum (2007-2011 averages)]/ Maximum (2007-2011 averages)
Table 11. Group distribution for quality analysis.
Group Description Items
1 Local Supplier which received from an international supplier. 46
2 Local Supplier which received from a local supplier. 21
3 International supplier which did not receive from a 2nd supplier. 73
4 International supplier which received from an International supplier. 44
5 International supplier which received from a local supplier. 22
6 Local supplier which did not receive from a 2nd supplier. 359
Source: authors.
Table 12. Descriptive statistics for quality variation (PPM).
1 2 3 4 5 6
Average -482 1082 -1180 -12452 666 -512
Standard deviation 2633 3250 5522 64797 2556 4624
Sample variance 6.9E6 10.5E6 30.5E6 4198.7E6 6.5E6 21.4E6
Kurtosis 44 11 51 41 11 70
Asymmetry -7 3 -7 -6 3 -6
Count 47 22 74 45 23 360
Level of reliability (95%) 773 1441 1279 19467 1105 479
Source: authors.
Table 13. PPM variation.
Group 1 Group 2 Group 3 Group 4 Group 5 Group 6
he Same (0) 31 67% 9 43% 61 84% 29 66% 11 50% 289 81%
Deteriorated (-1) 11 24% 8 38% 12 16% 11 25% 5 23% 58 16%
Improved (+1) 4 9% 4 19% 0 0% 4 9% 6 27% 12 3%
BBR
14,3
538
The variation in coverage days was truncated in the following way: when there was a very high reduction (up to zero), the variation was limited to -100% by the formula; when there was a very high variation of over 300% (the maximum value found was 7,912%), the value was eliminated for representing a very atypical situation (outlier). The resulting descriptive statistics for the sample is detailed in Table 17. A diferent behaviour in the group averages is observed. The distribution of stock coverage variation in each group could be adopted as suiciently close to normal, even for groups 1 and 6, which present a slight kurtosis. The next step was to perform a single factor ANOVA test (Table 18), which indicated that there were no diferences between the coverage variations for the 6 groups. Thus, H3 is refuted, where the entrance of a second supplier makes the purchasing company increase its stock.
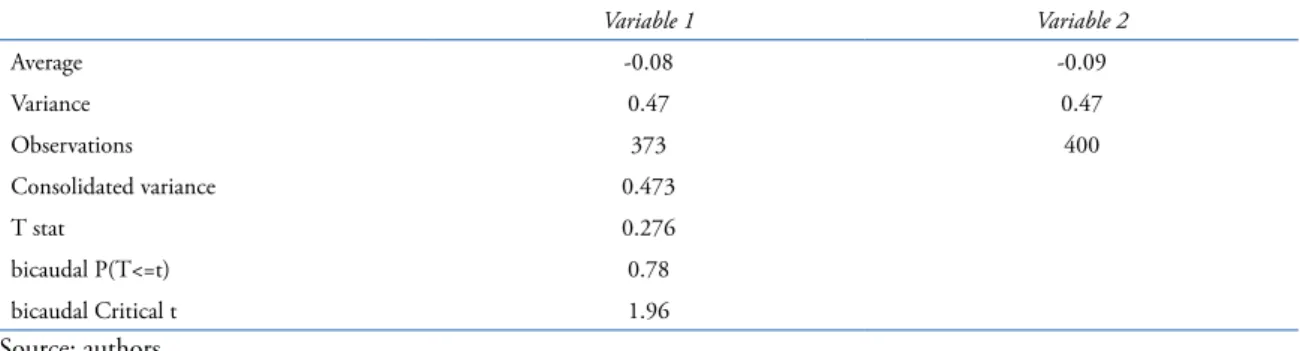
The analysis was taken forward to test if there were stock coverage variances for local or international suppliers in the split templates made for H1 – while remembering that there is an expectation that there are higher stocks when there is an insertion of international players. Table 19 exhibits the T-test to analyse the variation in average stock coverage days for local (1 + 2 + 6) versus international suppliers (3 + 4 + 5). The alternative hypothesis arising from the split of H3 is not refuted, indicating that the coverage variation for a local supplier is no diferent to that of an international supplier.
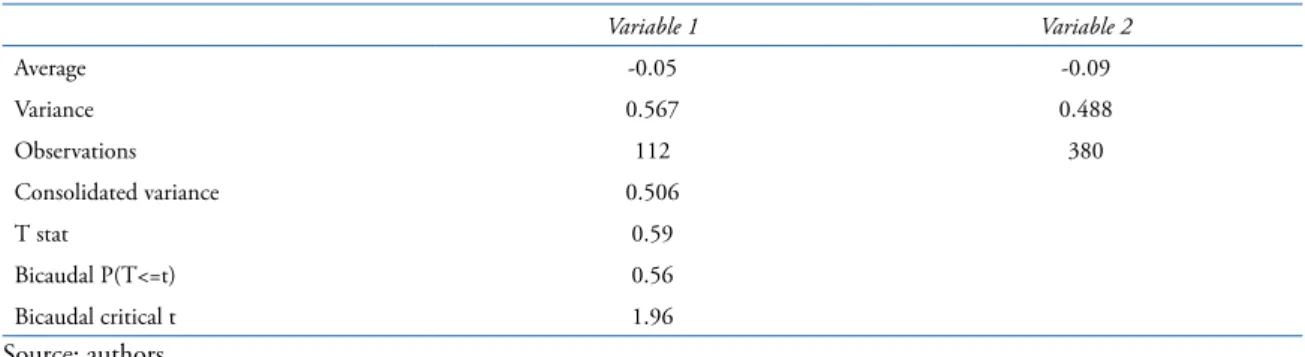
Table 20 exhibits the T-test to observe if the entrance of a supplier (1 + 2 + 4 + 5) alters the coverage variation with single suppliers (3 + 6). The alternative hypothesis is not refuted, indicating that there is no evidence that stronger competition alters the coverage variation, negating H3. Tables 21 and 22 exhibit the tests: for the entrance of a new supplier (4 +
Table 14. PPM variation for local suppliers (dummies).
Groups 1 + 2 Group 6
he Same (0) 40 60% 289 81%
Deteriorated (-1) 19 28% 58 16%
Improved (+1) 8 12% 12 3%
Source: authors.
Table 15. PPM variation for international suppliers (dummies).
Group 3 Groups 4 + 5
he Same (0) 61 84% 40 61%
Deteriorated (-1) 12 16% 16 24%
Improved (+1) 0 0% 10 15%
Source: authors.
Table 16. Group distribution for coverage analysis.
Group Description Items
1 Local supplier received from an international supplier. 36
2 Local supplier received from a local supplier. 20
3 International supplier which did not receive from a 2nd supplier. 63
4 International supplier which received from an international supplier. 36
BBR
14,3
539
5) altering the coverage variation for a single international supplier (3); and the entrance of a new supplier (1 + 2), altering the coverage variation for a single local supplier (6). The alternative hypotheses are not refuted, indicating that there is no evidence that greater competition alters the coverage variation, negating H3. As a partial conclusion, there are no signiicant diferences in stock coverage variation with the entrance of new suppliers.
5. DISCUSSION
The presence of a second supplier willing to ofer lower prices can result in important cost reductions for the buyer (GANESHAN, TYWORTH and GUO, 1999). Thus, hypothesis 1 is observed. Its importance is in the fact that one of the companies’ main objectives, when they decide to buy from two or more sources, is the search to reduce prices on account of stronger competition, with suppliers reducing margins to sustain market shares. This price reduction, higher when an international supplier enters than when it is a national one, is in line with previous studies which show that the purchase of products outside of the country of origin (global sourcing) could bring beneits to purchasing companies, even if it is more to renegotiate with current suppliers than acquiring new ones. When deciding on a single sourcing strategy, the purchasing company is subject to the risk of opportunistic behaviour by its suppliers, which could charge higher prices (TRELEVEN and SCHWEIKHART, 1988; HIJZEN, INUI and TODO, 2006; VILLENA, REVILLA and CHOI, 2011).
Table 17. Descriptive coverage statistics.
1 2 3 4 5 6
Average -18.1% -4.1% -21.6% 9.1% -6.4% -6.8%
Standard deviation 0.691 0.402 0.669 1.050 0.415 0.703
Sample variance 0.477 0.162 0.448 1.102 0.172 0.494
Kurtosis 5.7 0.1 0.9 1.2 1.8 2.9
Asymmetry 1.9 0.8 1.2 1.4 0.6 1.4
Count 36 20 63 36 20 317
Level of reliability (95.0%) 0.23 0.19 0.17 0.36 0.19 0.08
Source: authors.
Table 18. Single factor ANOVA to verify if there is a group with a coverage variation average dissimilar to the others.
Variation source SQ gl MQ F P-value Critical-F
Among groups 2.65 5 0.53 1.05 0.39 2.23
Within the groups 245.56 486 0.51
Total 248,21 491
Source: authors.
Table 19. T-test for coverage variation by local and international suppliers.
Variable 1 Variable 2
Average -0.08 -0.09
Variance 0.47 0.47
Observations 373 400
Consolidated variance 0.473
T stat 0.276
bicaudal P(T<=t) 0.78
bicaudal Critical t 1.96
BBR
14,3
540
Table 20. T-test for coverage variation with the entrance of suppliers.
Variable 1 Variable 2
Average -0.05 -0.09
Variance 0.567 0.488
Observations 112 380
Consolidated variance 0.506
T stat 0.59
Bicaudal P(T<=t) 0.56
Bicaudal critical t 1.96
Source: authors.
Table 21. T-test for the entrance of a new supplier versus a single international supplier.
Variable 1 Variable 2
Average 0,04 -0,22
Variance 0,766 0,448
Observations 56 63
Consolidated variance 0.598
T stat 1.77
Bicaudal P(T<=t) 0.08
Bicaudal critical t 1.98
Source: authors.
Table 22.T-test for the entrance of a new supplier versus a single local supplier.
Variable 1 Variable 2
Average -0.13 -0.07
Variance 0.364 0.494
Observations 56 317
Consolidated variance 0.475
T stat -0.62
Bicaudal P(T<=t) 0.53
Bicaudal critical t 1.96
Source: authors.
Another impact expected is that the quality of products from local suppliers would deteriorate if the purchasing company decided on more sources. This impact was not noted in the data analysed nor supported by the model proposed, thus hypothesis 2 is not observed. Although the presence of new suppliers could complicate and reduce the frequency of communication with the original suppliers, (TREVELEN and SCHWEIKHART, 1988) and closer relationships are fundamental to ensuring product quality (ALVES FILHO et al., 2004), the data showed that the entrance of international suppliers did not mean that the national suppliers reduced their quality levels. This may be explained by the fact that national suppliers have quality management systems that guarantee the repeatability of their productive processes and aim for continuous improvement, thereby guaranteeing that their quality levels do not drop as time elapses, also explaining the general improvement in the quality of the items analysed (relected in the PPM reduction). A further important factor to be highlighted is the fact that the research focused on items of low manufacturing complexity. Another suggestion for future research is to perform similar studies for more complex items.
BBR
14,3
541
Trevelen and Schweikhart (1988) put forward that the purchasing company would havemore diiculties with inventory management in this situation, and Ganeshan, Tyworth and Guo (1999) indicated that such a decision hindered execution of lean production, the data showed that the increase in the inventory level was higher in cases in which the buyer did not have a second supply source. This could be explained by the purchasing company’s greater conidence in maintaining lower stocks when having more than one supplier for the same item, diluting supply chain risks. Replication of this analysis at other companies and performing qualitative research with managers from the area looking for explanations for this observation could be incorporated into future studies. Also, there was no consideration if speciic international location had an efect on price variation. Whether the supplier was in a neighbouring country (e.g. Argentina) or from overseas (e.g. China) is not considered. This is an interesting question that could be assessed by future researches.
Summing up, it can be concluded that when deciding to buy low complexity items from a second supplier buyers obtain cost advantages due to suppliers (both original and the new ones) price reductions - which may be even higher if the new supplier is international. These with no apparent compromise to product quality or inventory levels.
6. CONCLUSION
Not all of the hypotheses presented in this research have been supported, but it can be concluded that the entrance of a second international supplier to provide an item that was initially sourced from a local supplier created important impacts on the car parts industry analysed. Although existing literature alerts of the risk of deteriorating quality from the initial suppliers and the possible need to increase the buyer’s inventory, neither were observed in the data analysis for this study. Caution is advised when taking the decision to buy from a supplier, whether local or international, as although the results suggest that the quality levels from local suppliers and the purchasing company’s stock levels are not negatively impacted, they require great attention and detailed analysis, so that the purchasing company can evaluate the total costs involved in such a decision and thereby guarantee that it is in fact the best way to act. An analysis applying the transaction costs theory could be pertinent, so that more complete conclusions are acquired. This caution is in line with that recommended by Alves Filho et al. (2004), who show that strategic alignment and the tendency towards the equal distribution of gains are limited and companies’ motivations are not always those inferred in literature on supply chain management. It is recommended that the company identiies the strategy which most suits his value proposition and is aligned with its competitive strategy, even if this means combining a single sourcing strategy, with a view towards cooperation and a multiple source strategy, with a view towards competitiveness.
BBR
14,3
542
7. REFERENCES
ADAMS, Jefrey H., KHOJA, Faiza M. and KAUFFMAN, Ralph. An Empirical Study of Buyer-Supplier
Relationships within Small Business Organizations. Journal of Small Business Management, v. 50, n.
1, pp. 20-40, 2012.
Allon, G.; Mieghen, J. A. V. Global Dual Sourcing Tailored Base-Surge Allocation to Near- and Ofshore Production. Management Science, v. 56, n. 1, pp. 110-124, 2010.
ALVES FILHO, Alceu G. et al. Pressupostos da gestão da cadeia de suprimentos: evidências de estudos sobre a indústria automobilística. Gestão e Produção, v. 11, n. 3, pp. 275-288, 2004.
ARNOLD, U. New dimensions of outsourcing: a combination of transaction cost economics and the core competencies concept. European Journal of Purchasing & Supply Management, v. 6, n. 1, p. 23-29, 2000. CHUNG, W.; TALLURI, S.; NARASIMHAM, R. Flexibility or Cost Saving Sourcing Decisions with Two
Suppliers. Decision Sciences, v. 41, n. 3, pp. 623-650, 2010.
CORREA, H. L. Os modelos modulares de gestão de redes de suprimentos. Escola de Administração de Empresas de São Paulo, Relatórios de Pesquisa, n. 29, 2001.
DAVIS, E. W. Global Outsourcing: Have U.S. Managers Thrown the Baby Out with the Bath Water?
Business Horizons, July-August, pp. 58-65, 1992.
DOU, Y. and SARKIS, J. A joint location and outsourcing sustainability analysis for a strategic ofshoring decision.International Journal of Production Research, v. 48, n. 2, pp. 567-592, 2010.
FARRELL, Diana. Beyond ofshoring. Harvard Business Review, v. 82, n. 12, pp. 82-90, 2004.
FENG, Q.; SHI, R. Sourcing from Multiple Suppliers for Price-Dependent Demands. Production and Operation Management, v. 21, n. 3, pp. 547-563, 2012.
GAITHER, Norman; FRAZIER, Greg. Administração da produção e operações. Pioneira Thomson Learning, 2001.
GRAY, John V., ROTH, Aleda V.; LEIBLEIN, Michael J. Quality risk in ofshore manufacturing: an
explanation and empirical test. In: Academy of Management Proceedings, pp. 1-6, 2009.
GUARNIERI, P. Síntese dos Principais Critérios, Métodos e Subproblemas da Seleção de Fornecedores Multicritério. Revista de Administração Contemporânea, v.19, n.1, pp.1, 2015.
GUNASEKARAN, A.; IRANI, Z. Modelling and analysis of outsourcing decisions in global supply chains. International Journal of Production Research, v. 48, n. 2, pp. 301-304, 2010.
GUNDLACH, Gregory T., ACHROL, Ravi S.; MENTZER, John T. The structure of commitment in exchange. The Journal of Marketing, pp. 78-92, 1995.
HARLAND, C. M. Supply Chain Management: Relationships, Chains and Networks. British Journal of Management, v. 7, Special Issue, pp. S63-S80, 1996.
HUANG, J. D.; HU, M. H. Two-stage solution approach for supplier selection A case study in a Taiwan automotive industry. International Journal of Computer Integrated Manufacturing, v. 26, n. 3, pp. 237-251, 2013.
interrelated decisions. In: SUPPLY CHAIN FORUM. A BORDEAUX BUSINESS SCHOOL
PUBLICATION, p. 34, 2006.
ITO, B.; TOMIURA, E.; WAKASUGI, R. Ofshore outsourcing and productivity: evidence from japanese
irm-level data disaggregated by tasks. Review of International Economics, v.19, n. 3, pp. 555-567, 2011.
JAIN, S.; SWARUP, K. Ofshore outsourcing: a strategic approach towards maximizing organization value.Synergy, v. 9, n. 2, pp. 59-71, 2011.
KOTABE, Massaki; MURRAY, Janet Y. Global sourcing strategy and sustainable competitive advantage.
Industrial Marketing Management, v. 33, n. 1, pp. 7-14, 2004.
KUMAR, S.; ZAMPOGNA, P.; NANSEN, J. A closed loop outsourcing decision model for developing
efective manufacturing strategy. International Journal of Production Research, v. 48, n. 7, pp.
1873-1900, 2010.
LEE, A. H. I., A fuzzy AHP evaluation model for buyer-supplier relationships with the consideration of
beneits, opportunities, costs and risks. International Journal of Production Research, v. 47, n. 15, pp.
4255-4280, 2009.
LEWIS, M. O.; HAYWARD, S. D.; KASI, V. The hazards of sole sourcing relationships challenges, practices, and insights. Advanced Management Journal, pp. 28-45, 2013.
LI, C.; DEBO, L. G. Second sourcing vs. sole sourcing with capacity investment and asymmetric information. Manufacturing & Service Operations Management, v. 11, n. 3, pp. 448-470, 2009.
BBR
14,3
543
LOPPACHER, J. S.; LUCHI, R.; CAGLIANO, R.; SPINA, G. Global sourcing and procurement strategy: a model of interrelated decisions. Supply Chain Forum: An International Journal, v. 7, n. 1, 2006.
MANTEL, S. P.; TATIKONDA, M. V.; LIAO, Y. A behavioural study of supply manager decision-making:
factors inluencing make versus buy evaluation. Journal of Operations Management, v. 24, n. 6, pp.
822-838, 2006.
MANTEL, S. P.; TATIKONDA, M. V.; LIAO, Ying. A behavioral study of supply manager decision-making: factors inluencing make versus buy evaluation. Journal of Operations Management, v. 24, n. 6, pp. 822-838, 2006.
MARION, T. J.; THEVENOT, H. J.; SIMPSON, T. W. A cost-based methodology for evaluating product
platform commonality sourcing decisions with two examples. International Journal of Production
Research, v. 45, n. 22, pp. 5285-5308, 2007.
MONCZKA, R. M.; TRENT, R. J. Global sourcing: a development approach. International Journal of Purchasing and Materials Management, v. 27, n. 2, pp. 2-8, 1991.
PORTER, M. E. Competitive advantage: creating and sustaining superior performance. New York: FreePress, 1985.
______________. The ive competitive forces that shape strategy. Harvard Business Review, v. 86, n. 1, pp. 2-17, 2008.
QUINTENS, L.; PAUWELS, P.; MATTHYSSENS, P. Global purchasing: state of the art and research directions. Journal of purchasing and supply management, v. 12, n. 4, p. 170-181, 2006.
SHADISH, W. R.; COOK, T. D.; CAMPBELL, D. T.; Experimental and quasi-experimental designs for generalized causal inference. Wadsworth Cengage Learning, 2002.
STEVENS, J. Global purchasing in the supply chain. Purchasing & Supply Management, v. 1, pp. 22-26, 1995.
TADELIS, S. The Innovative organization: creating value through outsourcing. California Management Review, v. 50, n. 1, pp. 261-277, 2007.
TREVELEN, M.; SCHWEIKHART, S. B. A risk/beneit analysis of sourcing strategies: single vs. multiple sourcing. Journal of Operations Management, v. 7, n. 4, pp. 93-114, 1988.
TUNCA, I. T.; WU, Q. Multiple sourcing and procurement process selection with bidding events. Management Science, v. 55, n. 5, pp. 763-780, 2013.
WEE, H.; PENG, S.; WEE, P. K. Modelling of outsourcing decisions in global supply chains: an empirical
study on supplier management performance with diferent outsourcing strategies. International
Journal of Production Research, v. 48, n. 7, pp. 2081-2094, 2010.
WILLIAMSON, O. E.; The economics of organization: the transaction cost approach. The American Journal of Sociology, v. 87, n. 3, pp. 548-577, 1981.