DOI: 10.1590/1808-057x201703840
Impacts of the regulatory model for market risk capital:
application in a special savings company, an insurance company,
and a pension fund
Betty Lilian Chan
Fundação Escola de Comércio Álvares Penteado, Departamento de Ciências Contábeis, São Paulo, SP, Brazil
Felipe Tumenas Marques
BNP Paribas Cardif, São Paulo, SP, Brazil
Received on 05/27/2016 – Desk acceptance on 06/13/2016 – 3rd version approved on 05/30/2017
ABSTRACT
In line with the regulation brought in by Solvency II, the Superintendence of Private Insurance (Susep) introduced the market risk capital requirement at the end of 2015, with 50% of the minimum capital for this type of risk being required by December 31st 2016 and 100% the following year. his regulatory model consists of calculating parametric value at risk with a 99% conidence level and a three month time horizon, using the net exposure of expected cash lows from assets and liabilities and a covariance matrix updated with market data up to July 2014. One limitation of this regulatory approach is that the updating of the covariance matrix depends on prior approval by the National Council of Private Insurance, which can limit the frequency the covariance matrix is updated and the model’s adherence to the current market reality. As this matrix considers the period before the presidential election, the country’s loss of investment grade status, and the impeachment process, which all contributed to an increase in market volatility, this paper analyses the impacts of applying the regulatory model, considering the market volatility updated to December 31st 2015, for a special savings company (sociedade de capitalização), an insurance company, and an pension fund. Furthermore, the paper discusses the practical implications of the new market risk requirement for managing the investments of the entities supervised by Susep, listing the various assumptions that can be used in the regulated entities’ Asset and Liability Management decision models and possible trade-ofs to be addressed in this process.
1. INTRODUCTION
Diferent stakeholders can have diferent views with regards to the optimal capital structure (proportion of own capital and third-party capital) for companies. Shareholders, aiming to maximize return and minimize risk, tend to prefer the minimum allocation of capital, while other stakeholders, such as funders, prefer the maximum capital possible, since in the event of possible misfortunes over the course of business, the possible loss can be mitigated by a company’s own capital. Within this setting the following question arises: is the market capable of functioning adequately without the State’s interference. his is a big question guiding the discussion between regulation and self-regulation, with the former predicting that government rules should restrict private activity in order to maintain market equilibrium, while the latter argues that the rules should be set by market participants themselves.
Due to the economic, inancial, and social relevance of the inancial and insurance market, the perspective that has stood out, although regulation and self-regulation are to some extent complementary, is the one that argues that it is the State’s job to intervene in the market, by establishing standards, however minimum, to guarantee the stability of the system and correct possible distortions. he more complex the products and services involved, the greater the need for State regulation, in order to uphold commitments made to the most vulnerable (in other words consumers) and maintaining market equilibrium forms part of this.
Along these lines and given the increased complexity of inancial services and scandals involving big corporations, the Basel II Accord emerged (and subsequently Basel III), introducing methodologies for calculating minimum levels required of capital that are more sensitive to risk, allowing a lower capital allocation for institutions that use risk management practices better. his tendency for the insurance market in European Union countries has resulted in Solvency II.
Following the global movement, in Brazil new solvency rules for the insurance market have been issued, initially establishing those for capital allocation to cover
subscription, credit, and operational risks.
In December 2014, CNSP Resolution n. 317 was issued (Superintendence of Private Insurance [Susep], 2014) and subsequently consolidated by CNSP Resolution n. 321 (Susep, 2015) and altered by CNSP Resolution n. 343 (Susep, 2016). It introduced criteria for calculating risk capital based on market risk for insurers (INSs), pension funds (PFs), special saving companies (SSCs), and local reinsurers. he regulatory model consists of calculating parametric value at risk (VaR), considering 99% conidence for a three month time horizon. However, the covariance matrix established in the rule for calculating VaR was updated up to July 2014, prior to the presidential election, the country’s loss of investment grade status, and the impeachment process, which all contributed to an increase in market volatility. Besides this limitation of this regulatory approach, in order to update the covariance matrix to best reflect the underlying reality, a new resolution needs to be approved by the National Council of Private Insurance (CNSP), limiting the frequency of updates and the adequacy of the covariance matrix to the current market reality. Along these lines, given the increase in market volatility, the following question arises: what is the impact of updating the covariance matrix in the VaR calculation for market risk capital purposes?
his article therefore seeks to analyze the results of applying the approach deined by CNSP Resolution n.321 (Susep, 2015), incorporating market volatility up to December 31st 2015, for market risk capital for an SSC, an INS, and an PF. Moreover, the paper will discuss the practical implications of the new market risk requirement for managing the investments of entities supervised by the Superintendence of Private Insurance (Susep).
2. THEORETICAL FRAMEWORK
2.1 Capital Requirement
Since the 1980s, inancial institution and insurance company operations have evolved considerably, particularly with the regulations introduced by the Basel and Solvency accords. he regulations are structured based on the same three pillars:
● Pillar I — Quantitative Requirements: calculation of solvency capital requirements and minimum capital required based on a standard or an internal model.
● Pillar II — Supervisor review: general principles that govern the regulation of risk management and internal controls and process reviews.
● Pillar III — Market discipline: guidelines regarding the transparency and reporting of information related to solvency and inancial situation.
hese pillars seek to incentivize better practices for managing the risks to which INSs, reinsurers, SSCs, and PFs are exposed and can be found both in the recommendations from the International Association of Insurance Supervisors (IAIS, 2005) and in Solvency II of the European Union (Directive of the European Parliament and of the Council [EC], 2009) and in the Basel II accord (Basel Committee on Banking Supervision [BCBS], 2004) for banks.
In Brazil, Susep and CNSP have worked on developing the regulatory and supervisory framework based on the three pillars instituted in Solvency II.
In Pillar I, the regulation for additional capital for risk of insurer and reinsurer damage claims was introduced by CNSP resolutions n. 158 (Susep, 2006) and n. 188 (Susep, 2008), respectively. he criteria for establishing the capital for credit risk originated with CNSP Resolution n. 228 (Susep, 2010) and the capital for operational risk was regulated by CNSP Resolution n. 283 (Susep, 2013).
In 2013, in continuity of the polic•y for implanting supervision based on risk, Susep established a technical group to present the criteria and methodologies for measuring the regulatory risk capital requirement related to the market risk of supervised companies.
According to the presentation from the Susep technical group, carried out on April 26th 2013, the market under supervision accounted for R$ 549 billion in assets, with R$ 462 billion in inancial assets distributed in the following way:
● R$ 424 billion for the insurance segment;
● R$ 1 billion for the PF segment;
● R$ 29 billion for the special savings company segment;
● R$ 8 billion for the local reinsurer segment.
he relevance of the numbers highlights the economic and social importance of these segments in Brazil and explains the regulatory body’s concern with deining the basic metrics to be observed in order to maintain the solvency of the sector.
According to CNSP Resolution n. 317 (Susep, 2014), consolidated by CNSP Resolution n. 321 (Susep, 2015), INSs, PFs, SSCs, and local reinsurers will have to completely adjust to the new capital regulation for market risk by 2017, with the following capital requirement chronogram being established:
a. 0% of the capital for market risk by December 30th 2016;
b. 50% of the capital for market risk between December 31st 2016 and December 30th 2017; and
c. 100% of the capital for market risk by December 31st 2017
his shows that the subject of this study is contemporary and extremely relevant for the companies supervised by Susep.
Moreover, given the relevance of this regulation, CNSP Resolution n. 343 (Susep, 2016) altered the way of calculating adjusted net equity (ANE) to make it more sensitive to variations in the market value of assets and liabilities and suited to the introduction of the capital portion for market risk.
2.2 Asset and Liability Management
he use of the concept of market risk based on the net exposure between assets and their respective liabilities serves as a factor that incentivizes the use of asset and liability management (ALM) practices by the entities under Susep supervision.
key process for risk management, enabling decisions to be taken that are consistent with the behavior of an organization’s assets and liabilities, and making it possible to monitor and control management variables, such as liquidity, solvency, and return, among others. With the new market risk capital requirement issued by Susep, this variable is added to the scope of the ALM process in the supervised entities.
The ALM models can be divided into two main categories: deterministic models and stochastic models. he irst group includes the cash low matching models, which seek a set of assets with a cash low equal to that of the liabilities, and dedication, which seek assets with the closest cash low possible to that of the liabilities (due to the diiculty of inding assets that make cash low matching possible).
he dedication models gave rise to the immunization models (Ryan, 2014), whose core idea is to ind an asset portfolio, at the lowest price possible, whose cash low is greater or equal to that of liabilities.
he measures used for this purpose are normally dollar-duration and convexity; however these measures assume parallel shits in interest rates, which is diicult to ind in practice. More advanced measures, such as key rate duration vectors, have been proposed in the literature (Nawalkha, Soto, & Zhang, 2003); however a recent study (Carcano & Dall’O, 2011) found evidence that the use of more sophisticated models leads to a higher exposure to model errors, reducing the quality of the hedge created by these approaches.
In the second category, that of stochastic models, optimization models are used, considering the possible variations in cash lows and asset and liability values, which take on a stochastic behavior. he scope of this category ranges from the models that consider dynamic programming (Cairns, Blake, & Dowd, 2006) to models based on risk quantiles, such as VaR (Blake, Cairns, & Dowd, 2001).
2.3 Market Risk
Market risk has developed considerably since 1994, with JP Morgan bank publishing the RiskMetrics methodology (Morgan, 1996), in which the VaR metric came to be the reference for calculating market risk both in the academic ield and in the inancial market.
VaR is deined as the highest loss expected for a time horizon and a particular conidence interval. VaR can be calculated in diferent ways, according to the three methodologies irst presented by Risk Metrics: Parametric (which assumes that inancial returns have a known distribution), Historical Simulation (in which the quantile established by the VaR is sought in the historical distribution of the portfolio returns that are being analyzed), and Monte Carlo Simulation (which seeks to simulate the behavior of market prices).
Like the Brazilian Central Bank (BCB), which uses VaR as a metric for the market risk capital requirement for its regulated entities, in the insurance market Susep adopted VaR as a metric for calculating the capital requirement for market risk.
As established by CNSP Resolution n. 317 (Susep, 2014), the required capital for market risk will be the parametric VaR for three months, with 99% confidence.
he covariance matrix for calculating the parametric VaR is estimated using the exponentially weighted moving average (EWMA), based on the parameters of the term structure of interest rates (TSIR) published monthly by the authority itself, and used for the liability adequacy test (LAT) calculation, as well as the Bovespa Index, dollar, and Brazil Commodities Index (BCI) series of returns. he covariance matrix adopted in the current resolution refers to July 2014.
3. INTEREST PROBLEM AND METHODOLOGY
his paper aims to analyze the impacts of the new market risk capital requirement by evaluating the results for an SSC, an INS, and an PF, for December 2015.
As well as the direct impact of the capital requirement on these companies, the possible relection on the need for market risk capital will also be analyzed, where data up to December 2015 update the covariance matrix used
in calculating VaR, given that the current matrix uses data up to July 2014.
in which σ is the variance, λ is the decay factor used to update the information, and r is the return of the series
analyzed. For each item in the matrix, the covariance is estimated using the following correlation formula:
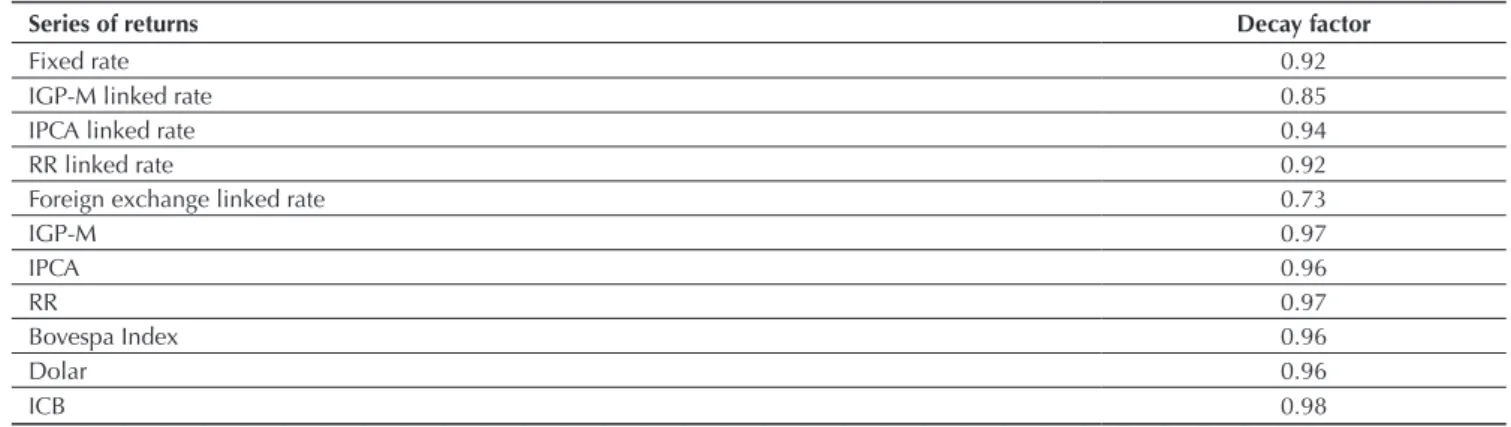
Table 1 Decay factors
Series of returns Decay factor
Fixed rate 0.92
IGP-M linked rate 0.85
IPCA linked rate 0.94
RR linked rate 0.92
Foreign exchange linked rate 0.73
IGP-M 0.97
IPCA 0.96
RR 0.97
Bovespa Index 0.96
Dolar 0.96
ICB 0.98
IGP-M: Brazilian General Market Price Index; IPCA: Brazilian Consumer Price Index; RR: reference rate.
Source: Elaborated by the authors.
converted into:
in which the estimates for volatility σ will be those obtained by the EWMA and the correlation ρ used will be the historical correlation of the series, considering the same period used by Susep to estimate the decay factors.
he decay factors used will be the same published by Susep in the Market Risk Report — Calculation of Factors — GT. he factors are presented in Table 1:
It also bears mentioning that the methodology established in the calculation of the net exposures between assets and liabilities, which are mapped by maturity and risk factor in the VaR calculation, does not consider new business, but merely the risk already assumed until then by the supervised entities (it presupposes run-of companies). Besides VaR, the analyses will also use marginal VaR, which measures how much the VaR would change for a monetary unit change in each exposure, and component
VaR, which measures how much each exposure contributes to total VaR (Alexander, 2009; Gourieroux, Laurent, & Scaillet, 2000).
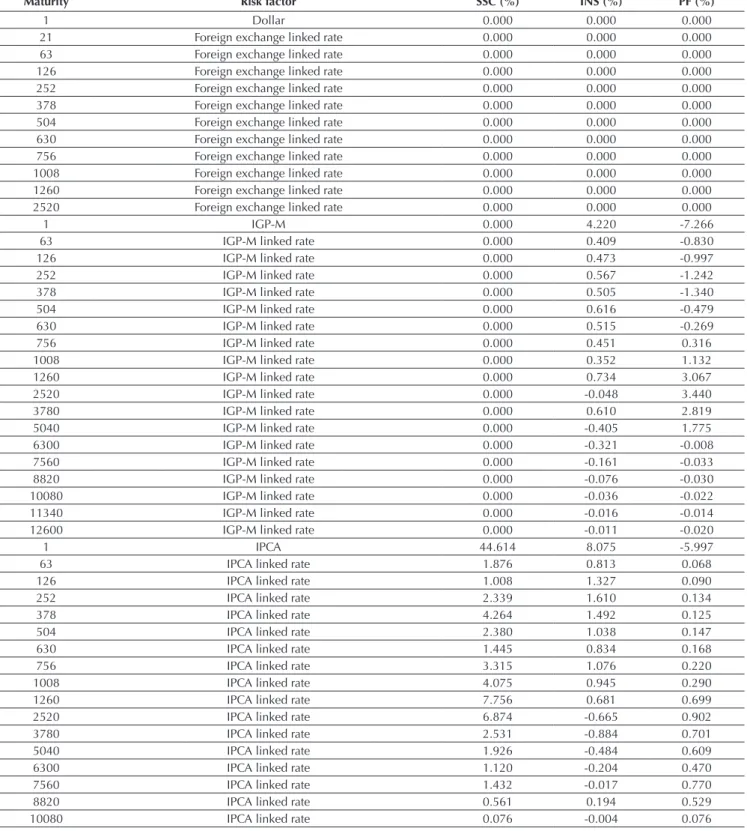
Table 2 Net exposures by risk factor
Maturity Risk factor SSC (%) INS (%) PF (%)
1 Dollar 0.000 0.000 0.000
21 Foreign exchange linked rate 0.000 0.000 0.000
63 Foreign exchange linked rate 0.000 0.000 0.000
126 Foreign exchange linked rate 0.000 0.000 0.000
252 Foreign exchange linked rate 0.000 0.000 0.000
378 Foreign exchange linked rate 0.000 0.000 0.000
504 Foreign exchange linked rate 0.000 0.000 0.000
630 Foreign exchange linked rate 0.000 0.000 0.000
756 Foreign exchange linked rate 0.000 0.000 0.000
1008 Foreign exchange linked rate 0.000 0.000 0.000
1260 Foreign exchange linked rate 0.000 0.000 0.000
2520 Foreign exchange linked rate 0.000 0.000 0.000
1 IGP-M 0.000 4.220 -7.266
63 IGP-M linked rate 0.000 0.409 -0.830
126 IGP-M linked rate 0.000 0.473 -0.997
252 IGP-M linked rate 0.000 0.567 -1.242
378 IGP-M linked rate 0.000 0.505 -1.340
504 IGP-M linked rate 0.000 0.616 -0.479
630 IGP-M linked rate 0.000 0.515 -0.269
756 IGP-M linked rate 0.000 0.451 0.316
1008 IGP-M linked rate 0.000 0.352 1.132
1260 IGP-M linked rate 0.000 0.734 3.067
2520 IGP-M linked rate 0.000 -0.048 3.440
3780 IGP-M linked rate 0.000 0.610 2.819
5040 IGP-M linked rate 0.000 -0.405 1.775
6300 IGP-M linked rate 0.000 -0.321 -0.008
7560 IGP-M linked rate 0.000 -0.161 -0.033
8820 IGP-M linked rate 0.000 -0.076 -0.030
10080 IGP-M linked rate 0.000 -0.036 -0.022
11340 IGP-M linked rate 0.000 -0.016 -0.014
12600 IGP-M linked rate 0.000 -0.011 -0.020
1 IPCA 44.614 8.075 -5.997
63 IPCA linked rate 1.876 0.813 0.068
126 IPCA linked rate 1.008 1.327 0.090
252 IPCA linked rate 2.339 1.610 0.134
378 IPCA linked rate 4.264 1.492 0.125
504 IPCA linked rate 2.380 1.038 0.147
630 IPCA linked rate 1.445 0.834 0.168
756 IPCA linked rate 3.315 1.076 0.220
1008 IPCA linked rate 4.075 0.945 0.290
1260 IPCA linked rate 7.756 0.681 0.699
2520 IPCA linked rate 6.874 -0.665 0.902
3780 IPCA linked rate 2.531 -0.884 0.701
5040 IPCA linked rate 1.926 -0.484 0.609
6300 IPCA linked rate 1.120 -0.204 0.470
7560 IPCA linked rate 1.432 -0.017 0.770
8820 IPCA linked rate 0.561 0.194 0.529
10080 IPCA linked rate 0.076 -0.004 0.076
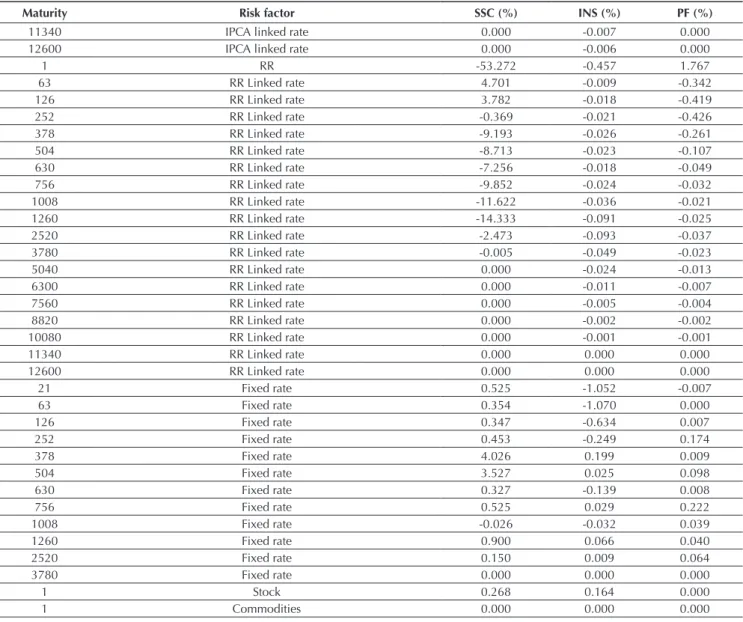
4. RESULTS
he irst stage in the analysis consists of allocating the inancial lows of the assets and liabilities into the risk factors, or ixed maturities, in the net exposure calculation for each factor.
Table 2 Cont.
Maturity Risk factor SSC (%) INS (%) PF (%)
11340 IPCA linked rate 0.000 -0.007 0.000
12600 IPCA linked rate 0.000 -0.006 0.000
1 RR -53.272 -0.457 1.767
63 RR Linked rate 4.701 -0.009 -0.342
126 RR Linked rate 3.782 -0.018 -0.419
252 RR Linked rate -0.369 -0.021 -0.426
378 RR Linked rate -9.193 -0.026 -0.261
504 RR Linked rate -8.713 -0.023 -0.107
630 RR Linked rate -7.256 -0.018 -0.049
756 RR Linked rate -9.852 -0.024 -0.032
1008 RR Linked rate -11.622 -0.036 -0.021
1260 RR Linked rate -14.333 -0.091 -0.025
2520 RR Linked rate -2.473 -0.093 -0.037
3780 RR Linked rate -0.005 -0.049 -0.023
5040 RR Linked rate 0.000 -0.024 -0.013
6300 RR Linked rate 0.000 -0.011 -0.007
7560 RR Linked rate 0.000 -0.005 -0.004
8820 RR Linked rate 0.000 -0.002 -0.002
10080 RR Linked rate 0.000 -0.001 -0.001
11340 RR Linked rate 0.000 0.000 0.000
12600 RR Linked rate 0.000 0.000 0.000
21 Fixed rate 0.525 -1.052 -0.007
63 Fixed rate 0.354 -1.070 0.000
126 Fixed rate 0.347 -0.634 0.007
252 Fixed rate 0.453 -0.249 0.174
378 Fixed rate 4.026 0.199 0.009
504 Fixed rate 3.527 0.025 0.098
630 Fixed rate 0.327 -0.139 0.008
756 Fixed rate 0.525 0.029 0.222
1008 Fixed rate -0.026 -0.032 0.039
1260 Fixed rate 0.900 0.066 0.040
2520 Fixed rate 0.150 0.009 0.064
3780 Fixed rate 0.000 0.000 0.000
1 Stock 0.268 0.164 0.000
1 Commodities 0.000 0.000 0.000
SSC: special savings company; PF: pension fund; INS: insurer; IGP-M: Brazilian General Market Price Index; IPCA: Brazilian Consumer Price Index; RR: reference rate.
Source: Elaborated by the authors.
For the SSC, apparently the company’s strategy is to manage the risk of exposure of liabilities indexed to the reference rate (RR) by allocating into assets indexed to the Brazilian Consumer Price Index (IPCA).
As for the INS, there is no clear standard, given that the positive net exposures are distributed into various categories of risk factors, as well as the negative net exposures.
With regards to the PF, it appears that in order to address the residual liabilities indexed to the RR and to the Brazilian General Market Price Index (IGP-M), the
company allocates into assets indexed to the ixed rate and IPCA rates. It bears mentioning that Table 2 presents the net exposure of each one of the analyzed companies; that is, if the allocation into assets in a particular risk factor is greater than the exposure of obligations, it is not possible to identify that the company has liabilities exposed to that risk factor.
Table 3 Capital requirement for market risk
SSC (%) INS (%) PF (%)
VaR 3.25 0.39 2.18
SSC: special savings company; PF: pension fund; INS: insurer; VaR: value at risk.
Source: Elaborated by the authors.
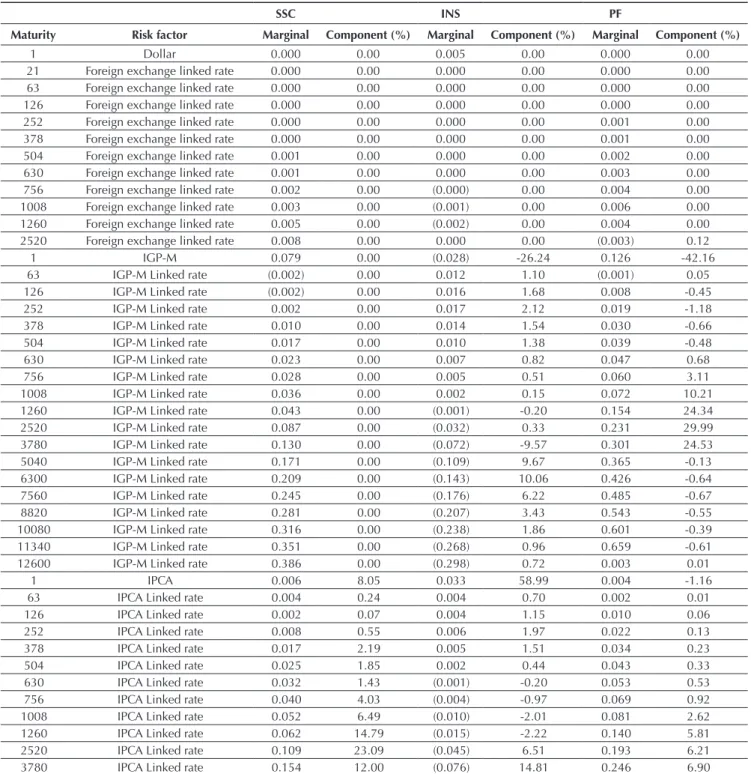
he VaR is only the starting point for a market risk management model, from which it is possible to evaluate the possible impacts on the current position of an entity’s
investments. Using marginal VaR and component VaR, the results for the three companies analyzed are in Table 4.
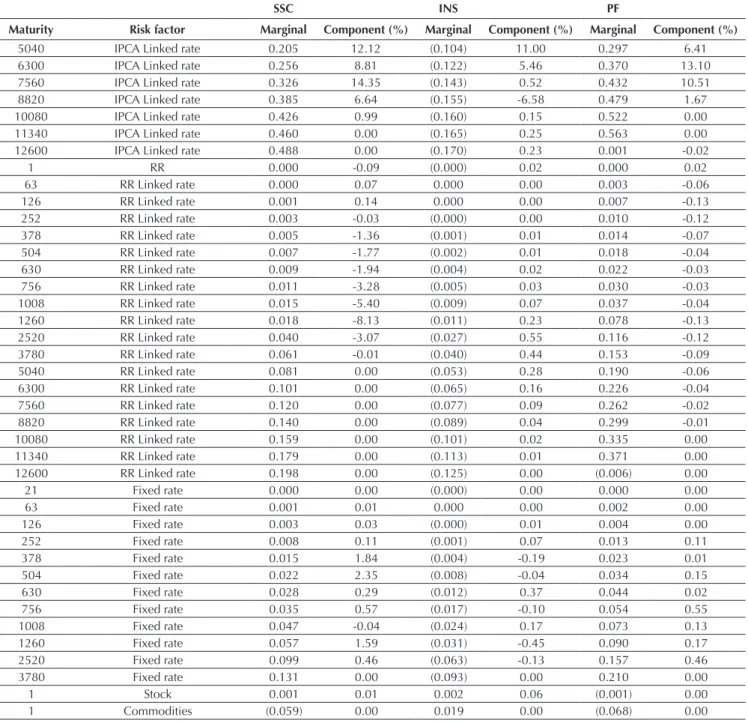
Table 4 Marginal and component value at risk (VaR)
SSC INS PF
Maturity Risk factor Marginal Component (%) Marginal Component (%) Marginal Component (%)
1 Dollar 0.000 0.00 0.005 0.00 0.000 0.00
21 Foreign exchange linked rate 0.000 0.00 0.000 0.00 0.000 0.00
63 Foreign exchange linked rate 0.000 0.00 0.000 0.00 0.000 0.00
126 Foreign exchange linked rate 0.000 0.00 0.000 0.00 0.000 0.00
252 Foreign exchange linked rate 0.000 0.00 0.000 0.00 0.001 0.00
378 Foreign exchange linked rate 0.000 0.00 0.000 0.00 0.001 0.00
504 Foreign exchange linked rate 0.001 0.00 0.000 0.00 0.002 0.00
630 Foreign exchange linked rate 0.001 0.00 0.000 0.00 0.003 0.00
756 Foreign exchange linked rate 0.002 0.00 (0.000) 0.00 0.004 0.00
1008 Foreign exchange linked rate 0.003 0.00 (0.001) 0.00 0.006 0.00
1260 Foreign exchange linked rate 0.005 0.00 (0.002) 0.00 0.004 0.00
2520 Foreign exchange linked rate 0.008 0.00 0.000 0.00 (0.003) 0.12
1 IGP-M 0.079 0.00 (0.028) -26.24 0.126 -42.16
63 IGP-M Linked rate (0.002) 0.00 0.012 1.10 (0.001) 0.05
126 IGP-M Linked rate (0.002) 0.00 0.016 1.68 0.008 -0.45
252 IGP-M Linked rate 0.002 0.00 0.017 2.12 0.019 -1.18
378 IGP-M Linked rate 0.010 0.00 0.014 1.54 0.030 -0.66
504 IGP-M Linked rate 0.017 0.00 0.010 1.38 0.039 -0.48
630 IGP-M Linked rate 0.023 0.00 0.007 0.82 0.047 0.68
756 IGP-M Linked rate 0.028 0.00 0.005 0.51 0.060 3.11
1008 IGP-M Linked rate 0.036 0.00 0.002 0.15 0.072 10.21
1260 IGP-M Linked rate 0.043 0.00 (0.001) -0.20 0.154 24.34
2520 IGP-M Linked rate 0.087 0.00 (0.032) 0.33 0.231 29.99
3780 IGP-M Linked rate 0.130 0.00 (0.072) -9.57 0.301 24.53
5040 IGP-M Linked rate 0.171 0.00 (0.109) 9.67 0.365 -0.13
6300 IGP-M Linked rate 0.209 0.00 (0.143) 10.06 0.426 -0.64
7560 IGP-M Linked rate 0.245 0.00 (0.176) 6.22 0.485 -0.67
8820 IGP-M Linked rate 0.281 0.00 (0.207) 3.43 0.543 -0.55
10080 IGP-M Linked rate 0.316 0.00 (0.238) 1.86 0.601 -0.39
11340 IGP-M Linked rate 0.351 0.00 (0.268) 0.96 0.659 -0.61
12600 IGP-M Linked rate 0.386 0.00 (0.298) 0.72 0.003 0.01
1 IPCA 0.006 8.05 0.033 58.99 0.004 -1.16
63 IPCA Linked rate 0.004 0.24 0.004 0.70 0.002 0.01
126 IPCA Linked rate 0.002 0.07 0.004 1.15 0.010 0.06
252 IPCA Linked rate 0.008 0.55 0.006 1.97 0.022 0.13
378 IPCA Linked rate 0.017 2.19 0.005 1.51 0.034 0.23
504 IPCA Linked rate 0.025 1.85 0.002 0.44 0.043 0.33
630 IPCA Linked rate 0.032 1.43 (0.001) -0.20 0.053 0.53
756 IPCA Linked rate 0.040 4.03 (0.004) -0.97 0.069 0.92
1008 IPCA Linked rate 0.052 6.49 (0.010) -2.01 0.081 2.62
1260 IPCA Linked rate 0.062 14.79 (0.015) -2.22 0.140 5.81
2520 IPCA Linked rate 0.109 23.09 (0.045) 6.51 0.193 6.21
Table 4 Cont.
SSC INS PF
Maturity Risk factor Marginal Component (%) Marginal Component (%) Marginal Component (%)
5040 IPCA Linked rate 0.205 12.12 (0.104) 11.00 0.297 6.41
6300 IPCA Linked rate 0.256 8.81 (0.122) 5.46 0.370 13.10
7560 IPCA Linked rate 0.326 14.35 (0.143) 0.52 0.432 10.51
8820 IPCA Linked rate 0.385 6.64 (0.155) -6.58 0.479 1.67
10080 IPCA Linked rate 0.426 0.99 (0.160) 0.15 0.522 0.00
11340 IPCA Linked rate 0.460 0.00 (0.165) 0.25 0.563 0.00
12600 IPCA Linked rate 0.488 0.00 (0.170) 0.23 0.001 -0.02
1 RR 0.000 -0.09 (0.000) 0.02 0.000 0.02
63 RR Linked rate 0.000 0.07 0.000 0.00 0.003 -0.06
126 RR Linked rate 0.001 0.14 0.000 0.00 0.007 -0.13
252 RR Linked rate 0.003 -0.03 (0.000) 0.00 0.010 -0.12
378 RR Linked rate 0.005 -1.36 (0.001) 0.01 0.014 -0.07
504 RR Linked rate 0.007 -1.77 (0.002) 0.01 0.018 -0.04
630 RR Linked rate 0.009 -1.94 (0.004) 0.02 0.022 -0.03
756 RR Linked rate 0.011 -3.28 (0.005) 0.03 0.030 -0.03
1008 RR Linked rate 0.015 -5.40 (0.009) 0.07 0.037 -0.04
1260 RR Linked rate 0.018 -8.13 (0.011) 0.23 0.078 -0.13
2520 RR Linked rate 0.040 -3.07 (0.027) 0.55 0.116 -0.12
3780 RR Linked rate 0.061 -0.01 (0.040) 0.44 0.153 -0.09
5040 RR Linked rate 0.081 0.00 (0.053) 0.28 0.190 -0.06
6300 RR Linked rate 0.101 0.00 (0.065) 0.16 0.226 -0.04
7560 RR Linked rate 0.120 0.00 (0.077) 0.09 0.262 -0.02
8820 RR Linked rate 0.140 0.00 (0.089) 0.04 0.299 -0.01
10080 RR Linked rate 0.159 0.00 (0.101) 0.02 0.335 0.00
11340 RR Linked rate 0.179 0.00 (0.113) 0.01 0.371 0.00
12600 RR Linked rate 0.198 0.00 (0.125) 0.00 (0.006) 0.00
21 Fixed rate 0.000 0.00 (0.000) 0.00 0.000 0.00
63 Fixed rate 0.001 0.01 0.000 0.00 0.002 0.00
126 Fixed rate 0.003 0.03 (0.000) 0.01 0.004 0.00
252 Fixed rate 0.008 0.11 (0.001) 0.07 0.013 0.11
378 Fixed rate 0.015 1.84 (0.004) -0.19 0.023 0.01
504 Fixed rate 0.022 2.35 (0.008) -0.04 0.034 0.15
630 Fixed rate 0.028 0.29 (0.012) 0.37 0.044 0.02
756 Fixed rate 0.035 0.57 (0.017) -0.10 0.054 0.55
1008 Fixed rate 0.047 -0.04 (0.024) 0.17 0.073 0.13
1260 Fixed rate 0.057 1.59 (0.031) -0.45 0.090 0.17
2520 Fixed rate 0.099 0.46 (0.063) -0.13 0.157 0.46
3780 Fixed rate 0.131 0.00 (0.093) 0.00 0.210 0.00
1 Stock 0.001 0.01 0.002 0.06 (0.001) 0.00
1 Commodities (0.059) 0.00 0.019 0.00 (0.068) 0.00
SSC: special savings company; PF: pension fund; INS: insurer; IGP-M: Brazilian General Market Price Index; IPCA: Brazilian Consumer Price Index; RR: reference rate.
Source: Elaborated by the authors.
For the SSC, the maturities linked to the IPCA, despite not being the ones with the highest marginal VaR, are the ones that contributed most to the entity’s total VaR. In the case of the INS, the maturity with the greatest weight in the total VaR is that of the IPCA rate, while for the pension fund it is the maturities linked to the IGP-M.
hese results were obtained considering the covariance matrix with a July 2014 base date, adopted in CNSP Resolution n. 321 (Susep, 2015); however, the market changes over time, presenting periods of higher and lower
volatility for the various risk factors considered. In order to maintain adherence to the market reality, the information in the covariance matrix should be updated, relecting the supervised entities’ real solvency risk.
Table 5 Required capital with updating of the assumptions
SSC (%) INS (%) PF (%)
VaR 6.37 0.43 2.34
SSC: special savings company; PF: pension fund; INS: insurer; VaR: value at risk.
Source: Elaborated by the authors.
Table 6 Increase in required capital with update
SSC (%) INS (%) PF (%)
VaR 95.70 9.67 7.81
SSC: special savings company; PF: pension fund; INS: insurer; VaR: value at risk.
Source: Elaborated by the authors.
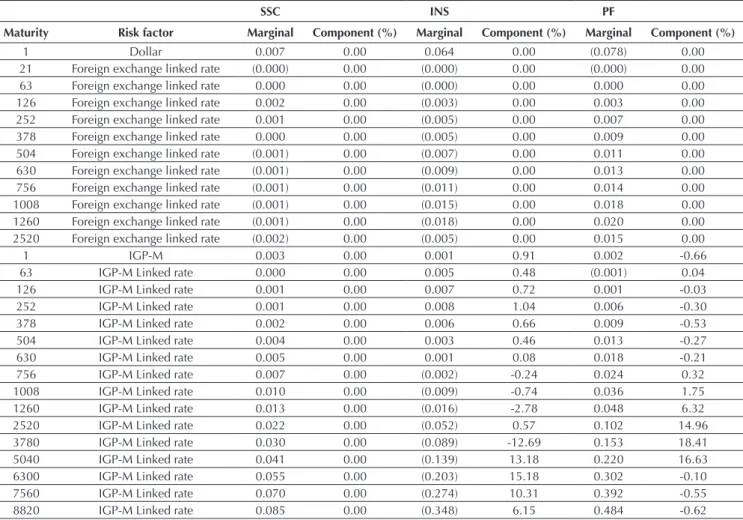
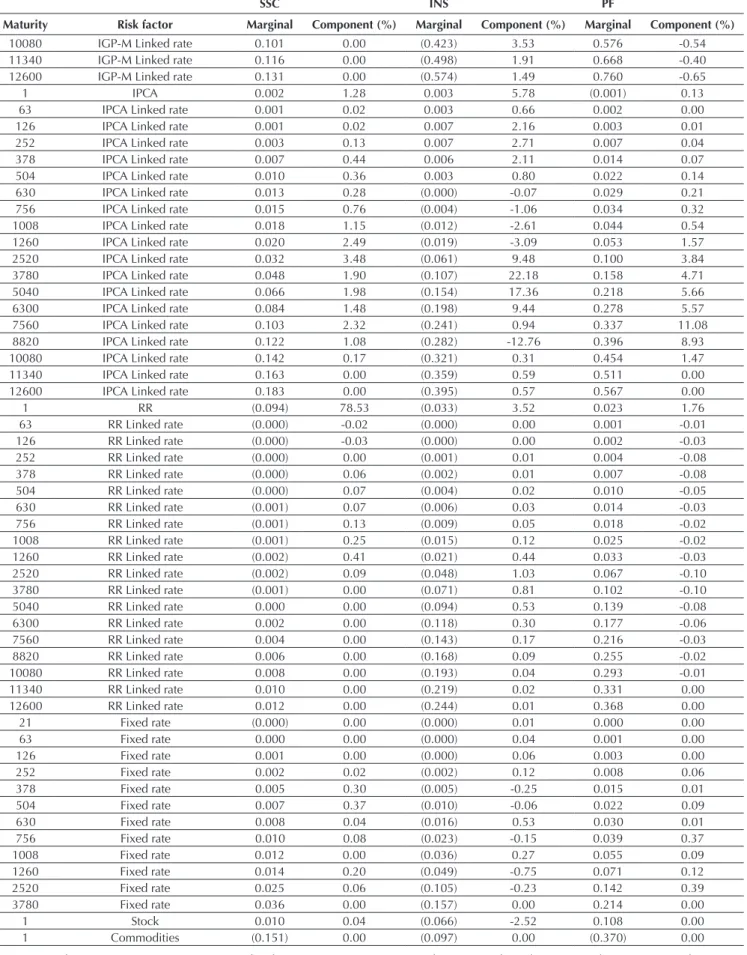
he marginal VaR and the component VaR for the three companies are presented in Table 7.
Table 7 Marginal and component value at risk (VaR) with new matrix
SSC INS PF
Maturity Risk factor Marginal Component (%) Marginal Component (%) Marginal Component (%)
1 Dollar 0.007 0.00 0.064 0.00 (0.078) 0.00
21 Foreign exchange linked rate (0.000) 0.00 (0.000) 0.00 (0.000) 0.00
63 Foreign exchange linked rate 0.000 0.00 (0.000) 0.00 0.000 0.00
126 Foreign exchange linked rate 0.002 0.00 (0.003) 0.00 0.003 0.00
252 Foreign exchange linked rate 0.001 0.00 (0.005) 0.00 0.007 0.00
378 Foreign exchange linked rate 0.000 0.00 (0.005) 0.00 0.009 0.00
504 Foreign exchange linked rate (0.001) 0.00 (0.007) 0.00 0.011 0.00 630 Foreign exchange linked rate (0.001) 0.00 (0.009) 0.00 0.013 0.00 756 Foreign exchange linked rate (0.001) 0.00 (0.011) 0.00 0.014 0.00 1008 Foreign exchange linked rate (0.001) 0.00 (0.015) 0.00 0.018 0.00 1260 Foreign exchange linked rate (0.001) 0.00 (0.018) 0.00 0.020 0.00 2520 Foreign exchange linked rate (0.002) 0.00 (0.005) 0.00 0.015 0.00
1 IGP-M 0.003 0.00 0.001 0.91 0.002 -0.66
63 IGP-M Linked rate 0.000 0.00 0.005 0.48 (0.001) 0.04
126 IGP-M Linked rate 0.001 0.00 0.007 0.72 0.001 -0.03
252 IGP-M Linked rate 0.001 0.00 0.008 1.04 0.006 -0.30
378 IGP-M Linked rate 0.002 0.00 0.006 0.66 0.009 -0.53
504 IGP-M Linked rate 0.004 0.00 0.003 0.46 0.013 -0.27
630 IGP-M Linked rate 0.005 0.00 0.001 0.08 0.018 -0.21
756 IGP-M Linked rate 0.007 0.00 (0.002) -0.24 0.024 0.32
1008 IGP-M Linked rate 0.010 0.00 (0.009) -0.74 0.036 1.75
1260 IGP-M Linked rate 0.013 0.00 (0.016) -2.78 0.048 6.32
2520 IGP-M Linked rate 0.022 0.00 (0.052) 0.57 0.102 14.96
3780 IGP-M Linked rate 0.030 0.00 (0.089) -12.69 0.153 18.41
5040 IGP-M Linked rate 0.041 0.00 (0.139) 13.18 0.220 16.63
6300 IGP-M Linked rate 0.055 0.00 (0.203) 15.18 0.302 -0.10
7560 IGP-M Linked rate 0.070 0.00 (0.274) 10.31 0.392 -0.55
8820 IGP-M Linked rate 0.085 0.00 (0.348) 6.15 0.484 -0.62
grade status. his updating tends to better relect the current scenario, and consequently, better estimate the market risk incurred by the market participants.
With the updating of the covariance matrix, an increase is observed for the market risk capital of the
three companies, due to the increase in volatility for the period, with the impact being more accentuated in the SSC, whose need for capital doubles. he results are presented in Table 5.
Table 7 Cont.
SSC INS PF
Maturity Risk factor Marginal Component (%) Marginal Component (%) Marginal Component (%)
10080 IGP-M Linked rate 0.101 0.00 (0.423) 3.53 0.576 -0.54
11340 IGP-M Linked rate 0.116 0.00 (0.498) 1.91 0.668 -0.40
12600 IGP-M Linked rate 0.131 0.00 (0.574) 1.49 0.760 -0.65
1 IPCA 0.002 1.28 0.003 5.78 (0.001) 0.13
63 IPCA Linked rate 0.001 0.02 0.003 0.66 0.002 0.00
126 IPCA Linked rate 0.001 0.02 0.007 2.16 0.003 0.01
252 IPCA Linked rate 0.003 0.13 0.007 2.71 0.007 0.04
378 IPCA Linked rate 0.007 0.44 0.006 2.11 0.014 0.07
504 IPCA Linked rate 0.010 0.36 0.003 0.80 0.022 0.14
630 IPCA Linked rate 0.013 0.28 (0.000) -0.07 0.029 0.21
756 IPCA Linked rate 0.015 0.76 (0.004) -1.06 0.034 0.32
1008 IPCA Linked rate 0.018 1.15 (0.012) -2.61 0.044 0.54
1260 IPCA Linked rate 0.020 2.49 (0.019) -3.09 0.053 1.57
2520 IPCA Linked rate 0.032 3.48 (0.061) 9.48 0.100 3.84
3780 IPCA Linked rate 0.048 1.90 (0.107) 22.18 0.158 4.71
5040 IPCA Linked rate 0.066 1.98 (0.154) 17.36 0.218 5.66
6300 IPCA Linked rate 0.084 1.48 (0.198) 9.44 0.278 5.57
7560 IPCA Linked rate 0.103 2.32 (0.241) 0.94 0.337 11.08
8820 IPCA Linked rate 0.122 1.08 (0.282) -12.76 0.396 8.93
10080 IPCA Linked rate 0.142 0.17 (0.321) 0.31 0.454 1.47
11340 IPCA Linked rate 0.163 0.00 (0.359) 0.59 0.511 0.00
12600 IPCA Linked rate 0.183 0.00 (0.395) 0.57 0.567 0.00
1 RR (0.094) 78.53 (0.033) 3.52 0.023 1.76
63 RR Linked rate (0.000) -0.02 (0.000) 0.00 0.001 -0.01
126 RR Linked rate (0.000) -0.03 (0.000) 0.00 0.002 -0.03
252 RR Linked rate (0.000) 0.00 (0.001) 0.01 0.004 -0.08
378 RR Linked rate (0.000) 0.06 (0.002) 0.01 0.007 -0.08
504 RR Linked rate (0.000) 0.07 (0.004) 0.02 0.010 -0.05
630 RR Linked rate (0.001) 0.07 (0.006) 0.03 0.014 -0.03
756 RR Linked rate (0.001) 0.13 (0.009) 0.05 0.018 -0.02
1008 RR Linked rate (0.001) 0.25 (0.015) 0.12 0.025 -0.02
1260 RR Linked rate (0.002) 0.41 (0.021) 0.44 0.033 -0.03
2520 RR Linked rate (0.002) 0.09 (0.048) 1.03 0.067 -0.10
3780 RR Linked rate (0.001) 0.00 (0.071) 0.81 0.102 -0.10
5040 RR Linked rate 0.000 0.00 (0.094) 0.53 0.139 -0.08
6300 RR Linked rate 0.002 0.00 (0.118) 0.30 0.177 -0.06
7560 RR Linked rate 0.004 0.00 (0.143) 0.17 0.216 -0.03
8820 RR Linked rate 0.006 0.00 (0.168) 0.09 0.255 -0.02
10080 RR Linked rate 0.008 0.00 (0.193) 0.04 0.293 -0.01
11340 RR Linked rate 0.010 0.00 (0.219) 0.02 0.331 0.00
12600 RR Linked rate 0.012 0.00 (0.244) 0.01 0.368 0.00
21 Fixed rate (0.000) 0.00 (0.000) 0.01 0.000 0.00
63 Fixed rate 0.000 0.00 (0.000) 0.04 0.001 0.00
126 Fixed rate 0.001 0.00 (0.000) 0.06 0.003 0.00
252 Fixed rate 0.002 0.02 (0.002) 0.12 0.008 0.06
378 Fixed rate 0.005 0.30 (0.005) -0.25 0.015 0.01
504 Fixed rate 0.007 0.37 (0.010) -0.06 0.022 0.09
630 Fixed rate 0.008 0.04 (0.016) 0.53 0.030 0.01
756 Fixed rate 0.010 0.08 (0.023) -0.15 0.039 0.37
1008 Fixed rate 0.012 0.00 (0.036) 0.27 0.055 0.09
1260 Fixed rate 0.014 0.20 (0.049) -0.75 0.071 0.12
2520 Fixed rate 0.025 0.06 (0.105) -0.23 0.142 0.39
3780 Fixed rate 0.036 0.00 (0.157) 0.00 0.214 0.00
1 Stock 0.010 0.04 (0.066) -2.52 0.108 0.00
1 Commodities (0.151) 0.00 (0.097) 0.00 (0.370) 0.00
SSC: special savings company; PF: pension fund; INS: insurer; IGP-M: Brazilian General Market Price Index; IPCA: Brazilian Consumer Price Index; RR: reference rate.
With the change in the covariance matrix used, not only the capital requirement changes, but also the evaluation regarding which strategies to use to manage each entity’s VaR.
For the SSC, the main factor contributing to the VaR is the RR, while in the calculation with the matrix up to July 2014 it was the IPCA maturities.
In the case of the INS, the greatest contribution to the VaR changes from the IPCA rate to the intermediate IPCA maturities, with the new matrix. As for the PF, the VaR results indicate the intermediate IGP-M maturities as the greatest contribution to VaR with both matrices.
Given the regulatory model adopted, Susep’s concern is observed in relation to the risk of decay of risk factors and periods between assets and liabilities, given that the VaR calculation is applied to net exposures, which highlights the importance of ALM practices. Currently, market risk management in many of the supervised entities is geared towards evaluating and monitoring the variation in the value of inancial investments in isolation, without observing the behavior of the respective liabilities.
herefore, conservative practices for market risk adopting the restricted perspective of inancial assets (for example, concentrating portfolio investments into low volatility government bonds, such as Financial Treasury Bills) may not be the ones that result in the lowest capital allocation, which represents a new challenge for the risk managers of these companies.
It is worth mentioning, however, that the investment aims of the regulated entities can go beyond simply reducing required capital. It is common to find, for example, investment strategies that aim, via allocation into assets indexed to the IPCA, to address liabilities indexed to the RR, seeking the potential inancial gains to the detriment of the need for market risk capital. Moreover, ALM practices oten consider the assumption of new business instead of a run-of company, despite this being a concept embedded into the regulatory model.
All of these challenges make the current need to use the ALM apparent in order to address the diferent aims encountered, whether these are required by the regulator, or are derived from market operations.
5. CONCLUSIONS
he introduction of market risk capital regulations for INSs, PFs, SSCs, and reinsurers leads to various challenges for the market, not only from a inancial impact perspective, but also for aspects of management and regulation.
he results presented in the cases studied in this paper show that there is an impact for the entities and that this impact can lead to large variations, depending on the assumptions used.
The covariance matrix used for the purposes of calculating the regulatory capital for market risk was updated only up to July 2014 and did not capture the efect of the volatility of the current Brazilian market, which may be underestimating risk, as shown in this paper’s result, given that this date precedes the electoral period and the loss of investment grade status, which are, for example, events that contributed to an increase in volatility.
he inancial impact of the introduction of market risk capital tends to incentivize changes in management practices, especially in relation to the ALM, remembering that asset and liability management is a much broader concept that merely pairing assets and liabilities. here is a need to understand and deine the aim of the ALM, such as: (i) to optimize regulatory capital, (ii) to optimize economic capital, and (iii) to optimize inancial return, observing a capital budget etc. he establishment of an ALM practice was also included in the rule that addresses enterprise risk management (ERM), published in Susep
Circular Letter n. 517 (Susep, 2015), and altered by Susep Circular Letter n. 521 (Susep, 2015).
he rule for market risk capital also tends to inluence the way companies engage in market risk management, which usually only emphasizes inancial assets, coming to incorporate a more holistic view of risk and simultaneously analyzing assets and liabilities. his should even inluence the organizational structures of companies, requiring more interaction between investment and actuarial areas.
herefore, given the relevance of the topic that is the object of this research and its consequences, the need for more research into this is observed.
For future studies, we suggest developing other conceptual studies, such as:
● he solvency time horizon is diferent for each type of risk; therefore, what is the concept of the aggregated view for regulatory capital?
● Is there interest rate risk overlapping between the market risk capital model and the subscription risk one for PFs?
● When will the internal model be regulated?
Correspondence address
Betty Lilian Chan
Fundação Escola de Comércio Álvares Penteado, Departamento de Ciências Contábeis Avenida da Liberdade, 532, 8º andar, Bloco E – CEP: 01502-001
Liberdade – São Paulo – SP – Brasil Email: [email protected]
REFERENCES
Alexander, C. (2009). Market risk analysis, value at risk
models (Vol. 4). Hoboken: John Wiley & Sons. Basel Committee on Banking Supervision. (2004).
International convergence of capital measurement and capital standards: a revised framework. Basel: BCBS.
Blake, D., Cairns, A. J., & Dowd, K. (2001). Pension metrics: stochastic pension plan design and
value-at-risk during the accumulation phase. Insurance:
Mathematics and Economics, 29(2), 187-215. Cairns, A. J., Blake, D., & Dowd, K. (2006). Stochastic
life styling: optimal dynamic asset allocation for
deined contribution pension plans. Journal of
Economic Dynamics and Control, 30(5), 843-877. Carcano, N., & Dall’O H. (2011). Alternative models
for hedging yield curve risk: an empirical
comparison. Journal of Banking & Finance, 35(11),
2991-3000.
Directive of the European Parliament and of the Council. 2009. Directive 2009/138/EC of the European Parliament and of the Council of 25 November 2009. Solvency II.
Gourieroux, C., Laurent, J. P., & Scaillet, O. (2000).
Sensitivity analysis of values at risk. Journal of
Empirical Finance, 7(3), 225-245.
International Association of Insurance Supervisors
(2005). Insurance core principles. Basel: IAIS.
Morgan, J. P. (1996). Risk Metrics Technical Document. Morgan Guarantee Trust Company. Nawalkha, S. K., Soto, G. M., & Zhang, J. (2003).
Generalized M-vector models for hedging interest rate risk. Journal of Banking & Finance, 27(8), 1581-1604.
Ryan, R. J. (2014). he evolution of Asset/Liability
Management (a summary). New York: CFA
Institute.
Superintendence of Private Insurance. Susep Circular
Letter n. 517, July 30th 2015. Retrieved from http://
www2.susep.gov.br/bibliotecaweb/docOriginal. aspx?tipo=1&codigo=35656
Superintendence of Private Insurance. Susep Circular
Letter n. 521, November 24th 2015. Retrieved
from http://www2.susep.gov.br/bibliotecaweb/
docOriginal.aspx?tipo=1&codigo=37077 Superintendence of Private Insurance. (2015).
Relatório Final do GT de Risco de Mercado.
Retrieved from http://www.susep.gov.br/
setoressusep/cgsoa/coris/dicem/grupo-tecnico-de-risco-de- mercado
Superintendence of Private Insurance. CNSP
Resolution n. 158, 2006. Retrieved from http:// www.susep.gov.br/setores-susep/cgsoa/coris/ requerimentos-de-capital/arquivos/resol158-1.pdf
Superintendence of Private Insurance. CNSP
Resolution n. 188, 2008. Retrieved from http:// www.susep.gov.br/setores-susep/cgsoa/coris/ requerimentos-de-capital/arquivos/resol188.pdf
Superintendence of Private Insurance. CNSP
Resolution n. 228, 2010. Retrieved from http:// www2.susep.gov.br/bibliotecaweb/docOriginal. aspx?tipo=1&codigo=27426
Superintendence of Private Insurance. CNSP
Resolution n. 283, 2013. Retrieved from http:// www2.susep.gov.br/bibliotecaweb/docOriginal. aspx?tipo=1&codigo=30628
Superintendence of Private Insurance. CNSP
Resolution n. 317, 2014. Retrieved from http:// www2.susep.gov.br/bibliotecaweb/docOriginal. aspx?tipo=1&codigo=34205
Superintendence of Private Insurance. CNSP
Resolution n. 321, 2015. Retrieved from http:// www2.susep.gov.br/bibliotecaweb/docOriginal. aspx?tipo=1&codigo=35542
Superintendence of Private Insurance. CNSP
Resolution n. 343, 2016. Retrieved from http://