Measuring transient water flow in unsaturated municipal solid waste –
A new experimental approach
J. Capelo
*, M.A.H. de Castro
Federal University of Ceara´, Department of Civil and Environmental Engineering, Campus do Pici, Centro de Tecnologia Bloco 713, Te´rreo, CEP 60451-970, Fortaleza – Ceara´, Brazil
Accepted 21 April 2006 Available online 21 June 2006
Abstract
This research investigated transient water flow in unsaturated municipal solid waste (MSW) packed in columns using neutron scatter-ing. The method developed was able to measure absolute moisture content and moisture variation in a sample of MSW produced in the city of Fortaleza (Brazil) during a simulated tropical rain event. The technique was proven to be efficient, showing that channeling flow accounts for most of the unsaturated flow conditions. The most important effect of micro-porous flow was on water accumulation and small long-term outflow. Furthermore, the definition offield capacityused in soil sciences does not seem to apply to flow in unsaturated MSW; the MSW layers kept increasing in moisture content long after water was allowed through. Finally, the long-term draining exper-iment demonstrated that the macro-porous matrix may not be a continuous medium, which makes experexper-imental procedures that rely on matrix potential in specific points of the solid waste mass inaccurate.
2006 Elsevier Ltd. All rights reserved.
1. Introduction
Landfills are the dominant means of disposing of MSW in Brazil. Because of the relative simplicity of landfilling, it offers low cost, easy management, and therefore is a sited alternative for almost all developing countries. Approxi-mately 73% of the 130,000 metric tons/day of municipal solid waste generated in Brazil in 2000 was placed in muni-cipal landfills (PNSB, 2000). Recycling may play an increasingly important role in MSW management; how-ever, landfilling will still account for a significant portion of MSW disposal long into the future.
One of the greatest concerns on the impacts of an exist-ing or a proposed landfill is the groundwater pollution caused by landfill leachate. Leachate may be composed of liquids that originate from a number of sources, including precipitation, groundwater, consolidation, initial moisture storage, and reactions associated with decomposition of waste materials. The chemical quality of leachate varies
as a function of a number of factors, including the quantity produced, the original nature of the buried waste materials, and the various chemical and biochemical reactions that may occur as the waste materials decompose. Even small amounts of landfill leachate can pollute large amounts of groundwater, rendering it unusable for domestic and many other purposes. Municipal solid waste contains a variety of potentially significant chemical constituents and patho-genic organisms that could be adverse to public health, groundwater quality, and the environment within the area of influence of the landfill. Those chemical constituents include regulated hazardous chemicals such as heavy met-als, VOCs, and chlorinated solvents; conventional pollu-tants, chemicals that cause taste and odors such as H2S,
Fe, Mn, Cl, and ammonia.
Landfills should be designed to prevent any waste or leachate from moving into adjacent areas. Thus, a first step in controlling leachate migration is to limit leachate pro-duction by preventing, to the maximum extent feasible, the entry of external water into the MSW layers. A second step is to collect any leachate that is produced for subse-quent treatment and disposal. Techniques are currently
0956-053X/$ - see front matter 2006 Elsevier Ltd. All rights reserved.
doi:10.1016/j.wasman.2006.04.012
* Corresponding author. Tel.: +11 55 85 3260 2208.
E-mail address:[email protected](J. Capelo).
available to limit the amount of leachate that migrates into adjoining areas. In order to correctly design a leachate col-lection system, one should understand MSW hydraulic properties and leachate flow characteristics.
Many authors have attempted to model flow through MSW (Noble and Arnold, 1991; Al-Yousfi et al., 1992; Ahmed et al., 1992; Khanbilvardi et al., 1995). However, they basically tried to apply the same laws and theories used to model water flow in soils, which proved to be an ineffec-tive approach. Capelo (1999)applied two frequently used models, HELP (Schroeder et al., 1984) and Water Balance Model, to simulate leachate productions in northeastern Brazil, where a semi-arid tropical climate predominates, and compared them to the measured values for leachate generation. The results showed that none of the models sim-ulated accurately either the short-term (rain event or day) or the long-term (month or year) leachate generation.
Therefore, the objectives of this research were to study the transient vertical leachate flow characteristics in unsat-urated MSW using a different experimental approach and to determine the solid waste hydraulic properties in a semi-arid tropical region. The results should provide data essential in developing new mathematical modeling efforts and explain the phenomenon in a more realistic way.
2. Literature review
Many authors have studied water flow in MSW packed columns in order to develop or to verify the accuracy of mathematical models. Korfiatis et al. (1984)used a 56 cm diameter laboratory column packed with a heterogeneous mixture of approximately 6-mo old waste obtained from a MSW landfill to simulate the vertical movement of leach-ate within a landfill. The column was equipped with in situ pressure transducers to determine the relationship between suction pressure and saturation.
Noble and Arnold (1991)evaluated the use of Richards’ equation in the moisture transport within a landfill. One-dimensional water vertical infiltration in landfills was sim-ulated by studying water flux in experimental glass columns (40.7 cm length and 4.7 cm internal diameter) packed with 1.27 cm2of shredded dry newspaper with an overall density of 334.8 kg/m3. They found that Richards’ equation pro-vided a reasonable description of moisture transport and that capillary effects should not be neglected in landfill water transport modeling. However, by using small pieces of newspaper as the simulated MSW, the authors practi-cally eliminated one of the most important flow mecha-nisms in this medium, channeling flow; therefore, their experiment may not represent the actual behavior of water in a real landfill.
Zeiss and Major (1992)used a column study to measure patterns of moisture flow in MSW. Each column consisted of two 200 L drums welded together to give a total column height of 1.8 m and an internal diameter of 0.57 m. The columns were filled with hand-picked MSW with particle sizes ranging from 2.9 to 15.3 cm and an average diameter
of 9.05 cm. Waste density, porosity, field capacity, appar-ent hydraulic conductivity, and flow channeling were ana-lyzed as a function of compaction. Flow was detected by sensor plates, which consisted of a circular frame grid hold-ing twenty 1.5 cm diameter and 1.5 cm high cups disposed along the whole column cross section area. Two wires, sep-arated by a small distance, ran into each cup. Leachate flow was detected when it filled the cups and closed the cir-cuit, activating a light emitting diode (LED) control panel. Their experiment was successful in confirming that chan-neling flow was predominant in MSW; however, the appa-ratus was not able to measure solid waste moisture content along the experimental run, making the hydraulic charac-teristics found, such as conductivity and field capacity, questionable.
Zeiss and Uguccioni (1994) used the same columns as theZeiss and Major (1992)study described above to eval-uate mechanisms and patterns of leachate flow, with special attention to macro-pore effects (channeling). The columns were filled with hand-picked MSW with particle sizes rang-ing from 8 to 22 cm. Moisture flow sensor plates and tensi-ometers were installed at three levels within the waste mass.
Zeiss and Uguccioni (1997) attempted to confirm chan-neling, characterize flow regimes, and determine the effects of infiltration rate and waste density on flow parameters. Additionally, the key flow parameters of practical field capacity, pore-size distribution index, effective storage, hydraulic conductivity, breakthrough times, and discharge rate were measured. Eight rectangular-steel containers (1.8 m·1.6 m·1.5 m) filled with residential MSW and
equipped with tensiometers and a grid of flow sensor cups (as described by Zeiss and Uguccioni, 1994) were used in this study. Breakthrough times at 15–30 min (with two out-liers of 25 and 40 h) occurred at times similar to previous studies while the apparent initial unsaturated hydraulic conductivity was slightly higher than in previous studies.
The experimental apparatus used byZeiss and Ugucci-oni in 1994 and 1997(moisture flow sensor plates and ten-siometers) measured water content in a particular point of the MSW and did not reflect a representative measurement of the layer moisture content. Moreover, tensiometers may not be an effective instrument to indicate water content in real MSW due to the restricted area that may occur between the tensiometers porous cup and the coarse MSW particles (Yuen et al., 2000).
substantially in time and space within the same landfill. Those limitations compromise the practical validity of this experimental procedure.
A neutron probe has been widely used for estimating volumetric water content in soils. The probe emits fast neu-trons from a radioactive source, which are thermalized or slowed down by successive elastic collisions with hydrogen atoms in the medium. Since hydrogen atoms in soils are generally components of water molecules, the proportion of thermalized neutrons is related to the water content. This method has the advantage of measuring a large sam-ple volume and the possibility of scanning at several depths to obtain a profile of moisture distribution.
The use of neutron probe to measure moisture content in soils has been widely studied and is a common practice in agricultural, engineering, and hydrological applications. However, little reliable information on the application of this method when it comes to a different media, such as MSW, is available.
Recently, Yuen et al. (2000) developed an extensive investigation on the use of a neutron probe in measuring MSW moisture. First, a feasibility assessment was devel-oped in order to identify if the technique was viable for this purpose; then, the method limitations were identified in a laboratory scale, and finally a field application was carried out. Two major error sources were observed in the field trial: bound hydrogen effect and errors incurred during the gravimetric-to-volumetric moisture content conversion.
They concluded, however, that neutron probe could be considered useful and practical in measuring the absolute moisture of municipal solid waste, provided the proper cal-ibration curves are available and neutron capture elements are not excessively present. These limitations are not signif-icant if moisture variation is to be measured.
3. Methodology
3.1. Column preparation
Three leaching columns were constructed using concrete cylinders (60 cm internal diameter·3 m high) to simulate
vertical water movement (Fig. 1). At the bottom of each col-umn, a draining system consisting of a perforated 5 cm PVC pipe buried in a 10 cm thick layer of crushed brick was built to allow water removal. In the center of each column, an aluminum pipe 5 cm in diameter and 3 m long was installed before solid waste was packed. Fig. 1 shows a simplified sketch of the experimental columns.
A representative sample of new MSW was collected in the sanitary landfill of Fortaleza, Ceara (Brazil). Objects larger than 20 cm were manually removed from the sample. The sample was manually homogenized, weighed and packed in successive layers of 20 cm until reaching a den-sity of 550 kg/m3, the same density used to pack MSW in the Fortaleza sanitary landfill. Effects of MSW biodegrada-tion were not considered because of the relatively short
duration of the experiment (2 mo). Some indication of
the composition of the MSW used in the experiment can be made from a previous study as shown inTable 1( EML-URB, 1996).
3.2. Neutron probe calibration
The solid waste sample collected was relatively dry due to the region’s weather characteristics at the time of the exper-iment. Its initial volumetric water content, referred to as residual volumetric water content (hr), was determined
gravimetrically. Residual volumetric water content is defined in this study as the lowest moisture that MSW can achieve in a natural condition. The gravimetric determina-tion was done by placing samples into an oven at 105C
for 24 h and calculating the weight difference before and
Fig. 1. Simplified sketch of the experimental column.
Table 1
Fortaleza city, Brazil, MSW characterization
Waste category Composition (% v/v)
Food and yard waste 38.14
Paper 6.98
Cardboard 7.58
Plastics 10.69
Rubber 0.83
Ferrous metals 3.03
Non-ferrous metals 0.89
Glass 2.15
Wood 2.33
Textiles 3.45
Leather 0.39
Construction waste 3.84
Coconut shells 8.68
after the drying process. The samples were collected from the MSW used to pack the columns. An average residual volumetric water content ofhr= 0.13 (v/v) with a variation
coefficient of 17.41% was detected. The determined residual volumetric water content seems to agree with values (7–18% v/v) found byBenson and Wang (1998).
A TROXLER
Neutron Probe series 3300 was used to indirectly measure, in a non-destructive form, the MSW moisture during a simulated precipitation event. The neu-tron probe was mounted on the superior extremity of the aluminum pipe installed previously. Readings were carried out at the depths of 30, 60, 90, 120, 150, 180, 210, and 240 cm from MSW superior surface.
After the MSW was packed, the experimental columns were exposed to heat from the sun, and therefore to high temperatures (±40C), for about five weeks to verify if
the residual water content could still be reduced. No pre-cipitation was registered in that period. Very little variation in the MSW water content (average of 4%) was observed. Therefore, the residual volumetric water content found in the gravimetric experiment was considered to be a consis-tent value. To derive the calibration curve, count ratio was used instead of standard count. This procedure was used so that possible changes in the counting time would not invalidate the calibration curve. The use of count ratio also minimizes errors due to equipment electronic and radi-ation instabilities (Stone, 1990).
The spherical cloud radius (radius through which 98% of the slow neutrons pass before reaching the detector) is a function of volumetric water content and decreases with the increase in the moisture (Fig. 1). The following equa-tion expresses the relaequa-tion between the cloud radius and water content for soils, as specified by the neutron probe manufacturer:
R¼2800:27M;
whereRis the radius of measurement in mm andMis the water content in kg/m3.
This equation covers 98% of the sample volume mea-sured and is valid for water contents between 0 and 640 kg/m3. Because of the MSW composition, this radius should be substantially smaller than in soils but no data is available in the scientific literature.
In the initial measurements, the count ratio (CR) varied from one layer to another, although the MSW was assumed to be at the same residual volumetric water con-tent. These variations were attributed to the different types of materials present such as plastics and organic matter that also would be detectable by the neutron probe. This phenomenon was also observed by Yuen et al. (2000). Therefore, to overcome this characteristic, it was necessary to develop a calibration equation for each 30 cm layer of the three columns.
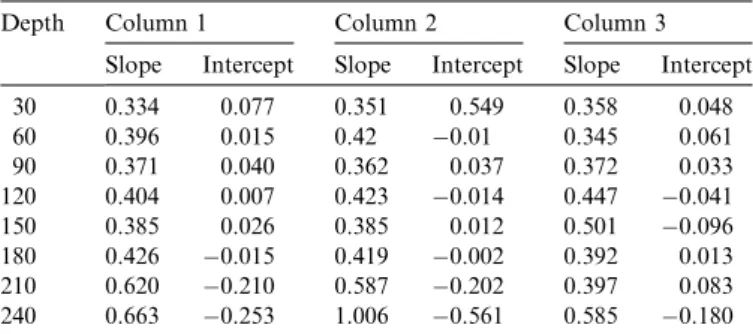
A linear relationship between water content and neutron probe reading (count ratio – CR) was assumed, as sug-gested byStone (1990). The calibration curves were found in the following manner:
1. A measuredcount ratiovalue was attributed to the resid-ual volumetric water content (hr= 0.13 v/v) for each
column and depth.
2. The moisture at full saturation was found by flooding the MSW columns and measuring the amount of water that each one held at the end of the experiment. It was made sure that no air was trapped inside the three col-umns. The average measured value washs= 0.41 v/v.
3. A measuredcount ratiovalue was attributed to full sat-uration (hs) for each column and depth.
4. A straight line intercepting both points (CR at hr and
CR at hs) was plotted defining the calibration equation
for each depth. The curve coefficients are presented in
Table 2.
3.3. Rain simulation
An aspersion system was installed with the objective of simulating precipitation over the MSW, adding water in a controlled and distributed form. This system was composed of a submerged pump, tanks for water storage, tubing, flow meter and control valves. During the rain simulation, the draining system at the column bottom was maintained closed so water would accumulate from the bottom up.
Only one rain simulation run was possible in each col-umn. The simulated rainfall was applied continuously until the end of the experiment. Once fully saturated, the MSW could only be dried out to the residual moisture values (hr)
if removed from the column. The simulated rain intensities applied were controlled through a valve and measured with a flow meter. The effects of rain simulation in the MSW were registered by the neutron probe during 390 min in col-umn one and 160 min in colcol-umns two and three. Neutron probe readings were taken approximately every 25 min; each reading took an average time of 30 s for every layer. The applied flow density was 9.50 cm/h in column one and 14.25 cm/h in columns two and three. Those flow den-sities were chosen in order to mimic the average precipita-tion intensity present in the studied sanitary landfill area.
Fig. 2shows the experimental apparatus used for the rain simulation. After the rain simulation ended, the columns were flooded in order to find the moisture at saturation (hs) and the saturated hydraulic conductivity, and to
initi-ate the free draining experiments.
Table 2
Calibration curve coefficients
Depth Column 1 Column 2 Column 3
Slope Intercept Slope Intercept Slope Intercept
30 0.334 0.077 0.351 0.549 0.358 0.048
60 0.396 0.015 0.42 0.01 0.345 0.061
90 0.371 0.040 0.362 0.037 0.372 0.033
120 0.404 0.007 0.423 0.014 0.447 0.041
150 0.385 0.026 0.385 0.012 0.501 0.096
180 0.426 0.015 0.419 0.002 0.392 0.013
210 0.620 0.210 0.587 0.202 0.397 0.083
The saturated hydraulic conductivity (Ks) was
deter-mined by using the method of unitary profile described by Libardi (2000). This method can be briefly described in this form:
1. The column was flooded up to the solid waste surface. 2. The bottom draining system valve was open and,
simul-taneously, water was added to the top of the column maintaining an equal flow rate for about 90 min and the same water level in the column.
3. After stabilizing the liquid column height, the inflow rate was divided by the column transversal area result-ing in the hydraulic conductivity (Ks).
After the hydraulic conductivity measurements were carried through, the columns were drained by stopping water inflow. During this procedure, neutron probe
mea-surements of solid waste volumetric water content were carried through in columns one and two.
4. Results and discussion
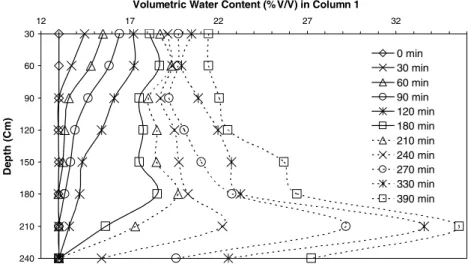
Volumetric water content versus depth is plotted in
Fig. 3for rain simulation in column one. A gradual mois-ture increase can be observed until the 120 initial min initi-ating in the superior layer and moving downward to the successive layers, similar to what is called in soil science a
wetting front. A particular difference observed in this case is that the moisture of the upper layers continues to increase as the wetting front advances. From minute 180 up to the end of the experiment (390 min), the moisture increase follows a different pattern. Water content starts building up between layers 180 and 210 cm instead of accu-mulating from the bottom up as it would be expected. This accumulation in an intermediary layer was caused by less favorable flow conditions, such as smaller permeability or presence of materials with high water moisture absorption capacity. As mentioned before, in contrast to soil science infiltration theories (Green and Ampt, 1911; Philip, 1957), the upper layers continued to increase in moisture even after infiltrated water was allowed to flow through.
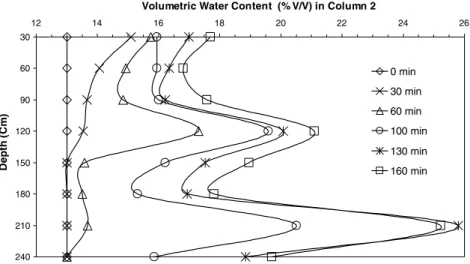
The experimental runs in columns two and three were shorter than in column one (160 min). Volumetric water content versus depth during rain simulation was plotted inFigs. 4 and 5for columns 2 and 3, respectively. A similar behavior as that observed in column one was experienced in columns two and three. Moisture kept increasing in a determined layer while infiltrated water was allowed to flow through it. Layers with smaller permeability were also encountered at depths of 120 and 210 cm in column two and 180 cm in column three.
The water absorption capacity pattern observed in the MSW columns is in accordance with the conclusions obtained by Korfiatis et al. (1984). The authors demon-strated that solid waste field capacity increases with time during the infiltration process.
Fig. 2. Experimental apparatus used to simulate rain.
Volumetric Water Content (% V/V) in Column 1
30
60
90
120
150
180
210
240
12 17 22 27 32
De
pt
h (
C
m
)
0 min 30 min 60 min 90 min 120 min 180 min 210 min 240 min 270 min 330 min 390 min
The saturated hydraulic conductivities, determined by the unitary profile method described previously, wereKs=
1.71·1004cm/s for column one, K
s= 1.68·1004cm/s
for column two, and Ks= 1.76·1004cm/s for column
three. These values are consistently close to data obtained by other authors (Chen and Chynoweth, 1995; Oweis et al., 1990). It is important to point out that, differently from unsaturated flow runs, the experiments in fully satu-rated media apparently behaved in accordance with Darcy’s law, which was also verified byKorfiatis et al. (1984).
Darcy‘s law is well understood and accepted as valid in the cases of laminar flow, normally observed in micropores. In the cases of larger pores, flow becomes turbulent and the fluid velocity does not have a linear relation with hydraulic gradient. There exists an addi-tional head loss with velocity increase and proporaddi-tionality of the coefficient decreases with hydraulic gradient. Rey-nolds number can approximately determine the limit between laminar and turbulent flow. Laminar flow is guaranteed if Re< 1 and turbulent flow if Re> 10 (
Bou-wer, 1978). Therefore, flow in porous materials can behave as Darcian or Non-Darcian flow depending on the applied water velocity.
With the saturated hydraulic conductivity found, it was possible to calculate the Reynolds number for the saturated flow in the columns. A density of 996.31 kg/m3and a vis-cosity of 0.000833 kg/m.s for water at 28C were used.
The pore average diameter was obtained from the work of Zeiss and Uguccioni (1997). A linear relation was assumed between MSW density and the average pore diam-eter in order to calculate the Reynolds number for a variety of diameters (Table 3). It is observed that the Reynolds numbers were well below one, a characteristic of Darcian flow.
After the rainfall and the saturated hydraulic conductiv-ity experiments ceased, free draining of water was con-ducted by opening the bottom valve in columns one and two. In column one, as it can be observed in Fig. 6, the excessive water drained at a very fast rate up to 160 min. After seven days of free draining, moisture was relatively
Volumetric Water Content (% V/V) in Column 2
30
60
90
120
150
180
210
240
12 14 16 18 20 22 24 26
De
p
th
(Cm
)
0 min
30 min
60 min
100 min
130 min
160 min
Fig. 4. Change in volumetric water content during rain simulation in column 2.
Volumetric Water Content (% V/V) in Column 3
30
60
90
120
150
180
210
240
12 14 16 18 20 22 24 26
Depth (Cm)
0 min
30 min
60 min
100 min
130 min
160 min
lower, around 23% v/v, between layers 90 and 240 but did not change significantly from the top to layer 90.
In column two, the free draining experiment initiated at full saturation (40.64% v/v) down to an average moisture of about 21% v/v on the 14th day, as shown inFig. 7. A fast moisture decrease of about 50% (from 40.64% to 23.00%) in layer 30 cm was observed in the first minute
of free draining. Moisture decreased very little after this first minute until 40 min. At 2.2 min it was observed that layer 180 cm maintained its initial saturation despite the significant moisture decrease in the upper and lower layers. It is important to observe that the moisture profile format after 40 min remained constant until day 14, a phenome-non also verified in column one.
The observed moisture profiles in the free draining experiments of both columns indicate that water is retained at two major levels of retention. The first one, more subject to gravity, was responsible for the fast water draining at the initial moments suggesting channeling flow through highly interconnected large empty spaces, as reported by Zeiss and Uguccioni (1994). The second one was responsible for most of the long-term moisture accumulation in the solid waste and for the slow draining over longer periods, characterizing the presence of a matrix with small dimen-sion pores. This two-domain behavior was also observed
Volumetric Water Content (%V/V) in Column 1
30
60
90
120
150
180
210
240
18 20 22 24 26 28 30 32 34
D
e
pt
h (
C
m
)
0 min
40 min
105 min
160 min
7 days
Fig. 6. Change in volumetric water content during the free draining experiment in column 1.
Volumetric Water Content (% V/V) Column 2
30
60
90
120
150
180
210
240
18 20 22 24 26 28 30 32 34 36 38 40 42
D
e
ph (
C
m
)
0 min
1 min.
2.2 min.
4.2 min.
40 min.
14 days
Fig. 7. Change in volumetric water content during the free draining experiment in column 2. Table 3
Reynolds number calculated for different pore diameters, using experi-mental saturated hydraulic conductivities
MSW densities (kg/m3) Pore diameter (cm) Re
250 1.90 3.89E02
300 1.58 3.24E02
350 1.13 2.31E02
400 0.71 1.45E02
450 0.39 8.03E03
in the work ofRosqvist and Destouni (2000) and Rosqvist et al. (2003).
5. Conclusions
The experiment developed was capable of measuring absolute moisture content and the variation of volumetric water content in MSW samples during a simulated precip-itation event in a non-destructive form. This provides a large range of possibilities for future research. Further-more, this technique could be also applied in large-scale dry cell landfills and bioreactor landfills to measure solid waste moisture content. However, experimental and ana-lytical errors involved in the new method, such as the effect of MSW density and porosity variations along the columns in the residual water content at saturation, influence of the sample size defined by the neutron cloud radius in the residual water content measurements, and validity of the neutron probe calibration curves must be further studied.
The observed water flow behavior does not agree with the physical models borrowed from conventional soil sci-ence. A determined layer does not need to reach a definitive saturation, calledfield capacityin the literature, in order to allow water through it. In fact, the definition offield capac-ity seems to be poorly applicable in the case of moisture flow through MSW.
While the MSW was fully saturated, the water flow in all three columns behaved as compatible with Darcy’s flow. However, Darcy’s law apparently does not physically rep-resent the water flow in non-saturated MSW due to the presence of greatly interconnected macro-pores or prefer-ential pathways (Bordier et al., 1997).
MSW heterogeneity was evident in all experimental runs despite having been subjected to the same compacting pro-cedure. This behavior can be related to larger compacting rates applied in the inferior layers or to the presence of less permeable types of materials. In any case, this phenome-non is also observed in large-scale landfills and should be considered in any modeling effort.
In the free draining experiment, the presence of well interconnected preferential pathways was also verified. Preferential pathways contributed to the total flow to a greater extent than the micro-porous matrix. It is also important to consider that, as observed by Moore et al. (1997), the micro-porous matrix basic role was to store water in the solid waste by absorbing part of the inflow applied at the surface.
After a long period of free draining, uniform water con-tent along the columns was not achieved. MSW-porous matrix discontinuity could be the cause of this pattern. This discontinuity could be caused by a spatially heterogeneous distribution of micro-porous material intercalated by mate-rials with larger pores or even by the empty spaces that formed the channels. If so, experimental procedures that use matrix potential as an indirect way of measuring mois-ture content, such as tensiometers, may not be appropriate methods.
Acknowledgements
This research was founded by CAPES Foundation and G & F Ltd. Their support is essential for the development of new technology and science in Brazil.
References
Ahmed, S., Khanbilvardi, R.M., Fillos, J., Gleason, P.J., 1992. Two-dimensional leachate estimation through landfills. Journal of Hydrau-lic Engineering 118 (2), 306–322.
Al-Yousfi, B.A., Pohland, F.G., Vasuki, N.C., 1992. Design of landfill leachate recirculation systems based on flow characteristic. In: Proceedings of the 47th Purdue University Industrial Waste Confer-ence. Purdue University, West Lafayette, IN, 191-100.
Benson, C.H., Wang, X., 1998. Soil water characteristic curves for solid waste. Environmental Geotechnics Report 98-13. Environmental Geotechnics Program. Dept. of Civil and Environmental Engineering University of Wisconsin-Madison, Madison, WI 53706.
Bordier, C., Rathle, J.e., Zimmer, D., 1997. Hydraulic functioning and clogging diagnosis of leachate collection systemProceedings Sardinia 97, 6th International Landfill Symposium, vol. III. CISA Publisher, Cagliari, pp. 361–372.
Bouwer, H., 1978. Groundwater Hydrology. MacGraw-Hill, New York. Capelo, J., 1999. Caracterizac¸a˜o quanti-qualitativa do percolado gerado
no aterro sanita´rio metropolitano oeste em Caucaia. (Characterization of the leachate generated at the metropolitan west sanitary landfill in Caucaia) Master of Science Thesis, Dept. of Civil and Environmental Engineering, Universidade Federal do Ceara, Brazil.
Chen, T., Chynoweth, D.P., 1995. Hydraulic conductivity of compacted municipal solid waste. Bioresource Technology 51, 205–212. EMLURB, 1996. Caracterizac¸a˜o dos Resı´duos So´lidos da Cidade de
Fortaleza. (Solid waste characterization of the city of Fortaleza) Prefeitura Municipal de Fortaleza. Official report.
Gawande, N.A., Reinhart, D.R., Thomas, P.A., McCreanor, P.T., 2003. Municipal solid waste in situ moisture content measurement using an electrical resistance sensor. Waste Management 23, 667–674. Green, W.H., Ampt, G.A., 1911. Studies in soil physics. The flow of air
and water through soils. Journal of Agricultural Science 4, 1–24. Khanbilvardi, R.M., Ahmed, S., Gleason, P.J., 1995. Flow investigation
for landfill leachate (FILL). Journal of Environmental Engineering 121 (1), 45–57.
Korfiatis, G.P., Demetracopoulos, A.C., Bourodimos, E.L., Nawy, E.G., 1984. Moisture transport in a solid waste column. Journal of Environmental Engineering 110 (4), 789–796.
Libardi, P.L., 2000. Dinaˆmica da a´gua no solo (Dynamic of water in soil) – 2a ed. Piracicaba, SP, pp. 270–271.
Moore, R., Dahl, K., Yazdani, R., 1997. Hydraulic characteristics of municipal solid waste: Findings of the Yolo County bioreactor landfill project. In: Proceedings of the Thirteenth International Conference on Solid Waste Technology and Management, Philadelphia, PA. Noble, J.J., Arnold, A.E., 1991. Experimental and mathematical modeling
of moisture transport in landfills. Chemical Engineering Communica-tions 100, 95–111.
Oweis, I.S., Smith, D.A., Ellwood, R.B., Greene, D., 1990. Hydraulic characteristic of municipal refuse. Journal of Geotechnical Engineering 116 (4), 539–553.
Pesquisa nacional de saneamento Ba´sico – PNSB, 2000. Comenta´rios sobre os resultados apresentados no tema de Limpeza Urbana pelo Consultor J.H. Penido Monteiro. (Comments on solid wastes issues presented by J.H. Penido Monteiro) J.H. Penido Monteiro, April 2002. Philip, J.R., 1957. The theory of infiltration 1. The infiltration equation
and its solution. Soil Science 83, 345–357.
Rosqvist, H., Dahlin, T., Fourie, A., Rohrs, L., Bengtsson, A., Larsson, M. 2003. Mapping of leachate plumes at two landfill sites in South Africa using geoelectrical imaging techniques. In: Proceedings of the Ninth International Waste Management and Landfill Symposium, Cagliari, Sardinia, Italy.
Schroeder, P.R., Gibson, A.C., Smolen, M.D., 1984. The hydrologic evaluation of landfill performance (HELP) model – User’s guide for version I, EPA/530-SW-84-009.1, USEPA Office of Solid Waste and Emergency Response, Washington, DC.
Stone, J.F., 1990. Neutron physics considerations in moisture probe design. In: Proceedings of the National Conference on Irrigation and Drainage.
Yuen, S.T.S., McMahon, T.A., Styles, J.R., 2000. Monitoring in situ moisture content of municipal solid waste landfills. ASCE Journal of Environmental Engineering 126 (12), 1088–1095.
Zeiss, C., Major, W., 1992. Moisture flow through municipal solid waste: patterns and characteristics. Journal of Environmental Systems 22 (3), 211–231.
Zeiss, C., Uguccioni, M., 1994. Mechanisms and patterns of leachate flow in municipal solid waste landfills. Journal of Environmental Systems 23 (3), 247–270.