Article
, Vol. 29, No. 12, 2586-2594, 2018Printed in Brazil - ©2018 Sociedade Brasileira de Química
*e-mail: luiz.madureira@ufsc.br
Evaluation of Benzene Derivatives Migration from Solid Residuals by Alternative
Leaching Process Using HS-SPME GC-MS
Jocinei Dogninia and Luiz A. S. Madureira*,b
aInstituto Serviço Nacional de Aprendizagem Industrial (SENAI) de Tecnologia Ambiental,
Rua Harry Pofhal, 111, 89037-650 Blumenau-SC, Brazil
bDepartamento de Química, Universidade Federal de Santa Catarina,
Campus Universitário Trindade, CP 476, 88040-900 Florianópolis-SC, Brazil
Solid residues generated by the petroleum industry are often classified as hazardous, in part due to the lack of adequate analytical methods for their characterization, given their gluey and highly viscous nature. In this study, an alternative to the method described by the United States Environmental Protection Agency (US EPA) method 1311, replacing the zero headspace extraction (ZHE) approach with solid-phase microextraction followed by analysis via gas chromatography-mass spectrometry was developed, for the determination of aromatic chlorinated and non-chlorinated volatile organic compounds. The method was validated according to national and international regulations, with a working range of 2.00 to 90.00 µg L-1 and limit of detection varying
from 0.12 to 0.41 µg L-1. Spiked matrices were analyzed and recovery values ranged from 79.7 to
98.4%. The analysis of real samples revealed levels below limit of quantification for chlorobenzene derivatives (2.00 µg L-1) and for the non-chlorinated aromatic compounds < 19.85 µg L-1, proving
to be a viable alternative to overcome the difficulties encountered with filtration techniques.
Keywords: chlorobenzene derivatives, leached extract, solid-phase microextraction, waste classification
Introduction
The total production of petroleum in Brazil is approximately 2.6 million barrels a day and this type of industry generates a high amount of solid waste. These solid wastes are generally considered hazardous because they contain high concentrations of hydrocarbons, heavy metals and other toxic compounds.1,2
The toxicity of industrial solid wastes needs to be known in order to select the correct destination depending on the content of potential environmental contaminants.3
In this regard, leaching tests can provide information on which hazardous organic and inorganic compounds are present in these wastes. In Brazil, the leaching process is described and regulated by the Brazilian Association of Technical Standards (Associação Brasileira de Normas Técnicas, ABNT) NBR 10005/2004,4 which is similar
to the United States Environmental Protection Agency (US EPA) method 1311,5 as described in the US EPA
SW-846 compendium.6
Volatile aromatic compounds and chlorobenzenes can be present in hazardous solid wastes generated in the petrochemical industry, since they can be formed during the petroleum cracking process.7,8 Thus, since these wastes
are a good source of energy and are often incinerated, they need to be quantified according to regulatory requirements. The presence of chlorobenzene derivatives in a solid residue may result in the production of dioxins and furans during the solid waste incineration process. According to resolution 316/2012 published by the Brazilian National Environment Council (Conselho Nacional do Meio Ambiente, CONAMA),9 atmospheric emissions from
unconventional sources must be approved based on the results of a burning test. One of the criteria for approval is the absence of dioxins and furans.10,11
the leaching step using zero headspace extraction (ZHE), in which the final step of the process is the pressurization of the ZHE system to obtain the filtered liquid.12 In view
of this, it is important to develop new methods that can overcome these difficulties for the characterization of volatile organic compounds in the leaching extract of gluey waste materials. The solid-phase microextraction (SPME) technique coupled to gas chromatography (GC) has shown great potential to deal with this complex matrix problem.13,14
Experimental
Chemicals, materials and samples
Two standard mix solutions containing monochloro-benzene (MCB), 1,2-dichloromonochloro-benzene (1,2-DCB), 1,3-dichlorobenzene (1,3-DCB), 1,4-dichlorobenzene (1,4-DCB), 1,2,3-trichlorobenzene (1,2,3-TCB), 1,2,4-trichlorobenzene (1,2,4-TCB), 1,3,5-trichlorobenzene (1,3,5-TCB), 1,2,3,4-tetrachlorobenzene (1,2,3,4-TrCB), 1 , 2 , 3 , 5 - t e t r a c h l o r o b e n z e n e ( 1 , 2 , 3 , 5 - T r C B ) , 1,2,4,5-tetrachlorobenzene (1,2,4,5-TrCB), pentachloro-benzene (PCB), hexachloropentachloro-benzene (HCB), pentachloro-benzene, toluene, ethylbenzene and xylenes were purchased from AccuStandard (M-8121 1000 µg mL-1 and M-502-10X
2000 µg mL-1). The stock standard solution (20 mg L-1)
was prepared in 10 mL vial with methanol. All solutions were kept in a freezer at –18 oC.
Reagent grade glacial acetic acid (99.7%) and sodium hydroxide (99%) were purchased from Sigma-Aldrich. Water type I was prepared with a Milli-Q water purification system (Millipore).
The extractive solution for solid waste leaching was prepared using a 1000 mL volumetric flask adding 5.7 mL of glacial acetic acid (0.57% v v-1) and 64.3 mL of
sodium hydroxide at 1.0 mol L-1 (6.43% v v-1) adjusted to
pH 4.93 ± 0.05, keeping the solution refrigerated at 4 oC.
The solution is used to simulate the leached extract formed in landfills.4
Four samples of petroleum sludge were collected for analysis to represent real samples from the oil industry. These samples were kept frozen in closed bottles to minimize the volatilization of the target analytes.
Blank matrix
In order to obtain a matrix free of the analytes and used during all the validation steps, approximately 50 g of solid residue collected from a petroleum hydroprocessing unit was placed in a porcelain cap and heated in an oven
at 120 oC for 12 h with occasional stirring. After that, the
treated dried material was macerated and homogenized keeping it with a viscous consistency.
Extraction method
Due to the complexity of the matrix and the potential for interference, the headspace (HS)-SPME mode was selected for the simultaneous extraction and pre-concentration of the analytes. The experimental model with the orthogonal central composite design, 3 central points, was used to optimize the extraction time and temperature, and the desorption temperature.15,16
The extraction temperature varied from 20 to 60 oC,
the extraction time from 10 to 50 min with exposed fiber and desorption temperature from 230 to 270 oC. The
distribution of the points employed was –α; –1; 0; 1; +α,
where α = 1.667. These working ranges were based on
previous studies with soil samples using HS-SPME.17,18
Approximately 0.50 g of treated dried residue were weighed in 22 mL headspace vials and spiked with 5 µg of each compound, followed by the addition of 10.0 mL of the extractive solution. The extraction process for the laboratory-spiked blank matrix was carried out using the CombiPal auto-sampler system (CTC). The thermal equilibrium time used prior to fiber exposure was 30 min. In order to maintain the chemical properties of the extraction solution described by the US EPA method 1311,5 effects
such as salting out and pH were not considered during the optimization of the experiments. Influence of agitation was not evaluated because the automatic sampler broke the fiber carrier at both 100 and 250 rpm.
The selection of the stationary phase for the SPME was based on the extraction yield, obtained by examining the integrated peak areas of the analytes. Two commercially available fibers housed in a manual holder obtained from Supelco were tested: 100 µm polydimethylsiloxane (PDMS) and 85 µm polyacrylate (PA) coating fibers. Experiments were performed in triplicate with the central point conditions of the experimental design.
The Statistica 10 software (StatSoft)19 was used to
perform the statistical treatment of the data and the design of the experimental model for method optimization.
Prior to extraction, the homogenized waste residues were weighed (ca. 0.50 g) in a 22 mL headspace vial, immediately mixed with 10.0 mL of extractive solution and closed. The vial was submitted to a rotational shaking of 30 ± 2 rpm for 18 ± 2 h at 25 oC. Subsequently, the extracts
Gas chromatography-mass spectrometry (GC-MS) analysis
Gas chromatographic analysis was performed on a Varian 431-GC (Agilent Technologies) coupled to a Varian ion trap mass spectrometer (model 210-MS). The chromatographic data were recorded using Varian MS Workstation software. The injector was operated in splitless mode for 1 min with helium 6.0 (White Martins) as the carrier gas (1.2 mL min-1).
The chromatographic conditions employed were optimized to reduce the run time in relation to the procedure (US EPA method 8250C)20 used by the environmental
analysis laboratory of the Instituto SENAI Tecnologia Ambiental accredited by the Brazilian National Institute of Metrology, Quality and Technology (Instituto Nacional de Metrologia, Qualidade e Tecnologia, Inmetro) with International Organization for Standardization (ISO) 17025.21
Analytes were separated on a 30 m × 0.25 mm i.d. × 1.4 µm film thickness HP-624UI gas chromatographic column (J&W Scientific) with the following oven temperature program: initial temperature 80 oC, increase from 80 to
240 oC at a rate of 10 oC min-1 and hold for 15 min, with a
total time of 31 min. The injector temperature was 260 oC.
The transfer line, trap and manifold temperatures were 240, 150 and 40 oC, respectively.
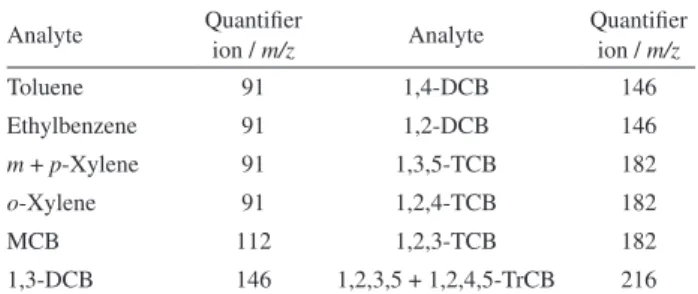
The MS was operated in electron ionization (EI) mode (70 eV), with 20 µA emission current for 30 ms. The total ion count employed was 20,000 and analysis was performed in full scan mode ranging from m/z 70 to 290. The system was operated by MS Workstation 7.0.2 software, and the quantification of the analytes was carried out based on the extracted ion chromatogram (EIC) considering the base peaks of each compound (Table 1).
For benzene, 1,2,3,4-tetrachlorobenzene, pentachloro-benzene and hexachloropentachloro-benzene no subsequent experiments were performed due the lack of sensibility and repeatability responses over the working range.
Method validation
The validation of the method was based on the DOQ-CGCRE-008 procedure22 of the Brazilian
accreditation body, ABNT NBR ISO 17025,21 Inmetro
and the Association of Official Analytical Chemists (AOAC) guidance document.23 The following figures of
merit were validated: selectivity, linearity, working range, limit of quantification (LOQ), limit of detection (LOD), repeatability, accuracy and recovery.
For the selectivity, seven uncontaminated matrix were analyzed employing all extraction steps and the non-appearance of signals related to the compounds indicated good selectivity.
Calibration curve was performed with four replicates using concentrations of 2.00, 10.00, 30.00, 50.00, 70.00 and 90.00 µg L-1. These values were selected to give points
well distributed along the working range, as required by AOAC.23 For each compound the determination coefficients
and equations of the analytical curves were determined. In addition to validating the proposed equations, statistical treatment of the residuals of the curves was performed.
The figures of merit repeatability and accuracy were evaluated together. Four replicates of a spiked blank were submitted to the whole process and analyzed at three levels. The results were evaluated according to the amplitudes of variation, relative standard deviation (RSD), limit of repeatability, and the relative errors of each replicate lower than 10%.
Seven replicates of the first calibration point (2.0 µg L-1)
in the extractive solution were analyzed. The results were submitted to the same criteria of repeatability and accuracy to validate the LOQ. For the LOD, the calculation recommended by Inmetro22 and AOAC23 was performed
using Student’s t-distribution multiplied by the standard deviation of the LOQ values. For the recovery, duplicates of four random samples were spiked with 50.0 µL of the 5000 µg L-1 stock solution, resulting in a 25 µg L-1 solution.
Results and Discussion
The gluey solid waste samples were first submitted to the extraction procedure as described by the EPA5 and
ABNT4 official methods. Due to the need for filtration of
the samples that are not 100% solid, the crude samples were submitted to the filtration step to separate the liquid fraction. At this stage, filter obstruction was observed and separation was not possible. In order to overcome this difficulty, 25.0 g of semi-solid homogenized sample was added to the ZHE with 500 mL of extraction solution. The ZHE was closed and pressurized at 50 psi. At the end Table 1. List of m/z fragments used as quantifier ions in the method
Analyte Quantifier
ion / m/z Analyte
Quantifier ion / m/z
Toluene 91 1,4-DCB 146
Ethylbenzene 91 1,2-DCB 146
m + p-Xylene 91 1,3,5-TCB 182
o-Xylene 91 1,2,4-TCB 182
MCB 112 1,2,3-TCB 182
1,3-DCB 146 1,2,3,5 + 1,2,4,5-TrCB 216
of the extraction time an obstruction of the filter pad was observed and separation of the filtered extract was again not possible. Due to these difficulties, an alternative method is proposed for the determination of benzene derivatives in solid residues.
In order to improve the method described in ABNT NBR 10005/2004,4 the extractions were carried out using
the same extraction solution and the same proportion of extraction solution and solid residue, as described in the method, without optimizing these parameters.
The peak area counts obtained for each compound in the experiments with PDMS and PA fibers are represented in Figure 1. The results were as expected, with higher affinity of the more polar compounds for PA and the nonpolar ones for PDMS.12-18
The fiber selection was based on the overall best performance (i.e., larger chromatographic peak areas). The selection of the PA fiber was consistent with the findings of Santos et al.,17 who conducted a study comparing PDMS
and PA for the extraction of chlorobenzenes in soil using HS-SPME.
An experimental design with a central composite model was used to verify the best conditions for the extractions. In the analysis of variance (ANOVA), the determination coefficients were verified for the analytes, which were higher than 0.70, and the p-value was higher than 0.05 (lack-of-fit). According to the ANOVA results, most compounds presented the variables temperature and extraction time as the most significant in the statistical test.15
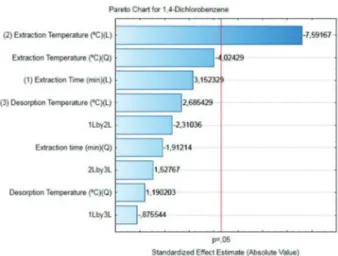
In addition to ANOVA, a Pareto graph (Figure 2) was obtained, in which most of the compounds were found to
be more strongly affected by the extraction temperature, considering a confidence interval of 95%. This was expected, since it is known that in the HD-SPME technique there is a competition between the volatilization of the analytes and adsorption/desorption, with a temperature increase favoring desorption and volatilization. Thus, the optimization of this parameter is important to obtain good extraction efficiency.
During the statistical treatment, the residuals were verified by the graphs obtained for the predicted values vs. residuals and observed vs. predicted values. These were validated because they present randomness and linearity, respectively. The values for the residuals were submitted to the Kolmogorov-Smirnov and Shapiro-Wilk normality tests, and a normal distribution of the values was verified, since p > α.24
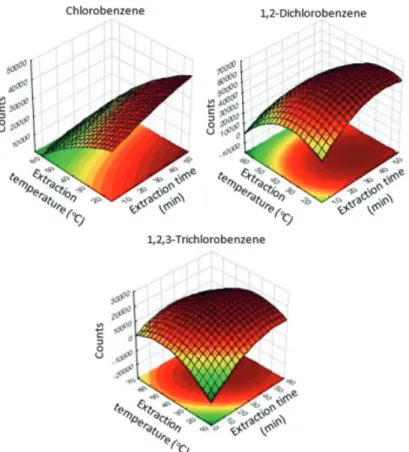
To better visualize the behavior of each compound with the variation of the extraction conditions, the response surfaces of the compounds were obtained based on the two most influent conditions: fiber exposure time and extraction temperature (Figure 3). For the analytes with different responses, the geometric means of the compound areas were not applied. The compromise conditions were obtained using statistical prediction tool.
When comparing the surface responses for extraction time and temperature, it can be observed that compounds with higher vapor pressure are favored in extractions with low temperature. In contrast, compounds with lower vapor pressure showed better response when higher temperatures were employed.
The surface responses of the desorption temperature are not shown since this variable is not significant according to the ANOVA test, p > 0.12. Thus, to obtain better extraction conditions, a statistical prediction tool from Statistica 10 was Figure 1. Comparison of peak area counts for three analyses using
polyacrylate (PA) and polydimethylsiloxane (PDMS) coating fibers. Conditions: 30 min of fiber exposure at 40 and 250 oC for desorption.
used to evaluate the data, obtaining an optimal condition for all analytes. The best conditions achieved were: extraction time 50 min, extraction temperature 30 oC and desorption
temperature 240 oC. The optimized extraction condition
was applied to the subsequent experiments.
As a first step in the validation process, blank tests (Figure 4) with matrices containing the analytes of interest were carried out in order to verify possible interferences. The test showed no matrix effects, thus indicating the specificity of the method.
Figure 3. Response surface obtained from central composite design for peak area counts for chlorobenzene (MCB), 1,2-dichlorobenzene (1,2-DCB) and 1,2,3-trichlorobenzene (1,2,3-TCB) as a function of the fiber exposure time (x axis) by the extraction temperature (y axis).
For all analytes, the determination coefficients (R2) were
higher than 0.995 (considered as the acceptance criterion for linearity). A second-order polynomial model was used with weight 1 / x to give greater importance to the points of lower concentration and the predicted value for the points of the curve was analyzed, which should be between 80 and 120% of error.22,23 The calibration curve obtained is
shown in Figure 5.
A normality test was performed on the residuals values to validate the equations obtained and the results are shown in Table 2. The statistical analysis of the residuals provided
p-values > 0.05 and a Wcalculated value higher than the Wα
value of 0.916, thus indicating that the hypothesis H0 is valid
and the distribution is normal. This verification is required by the guidelines for this type of study.22,23
Four replicates of three concentrations, 20.0, 40.0 and 60.0 µg L-1, within the working range, were analyzed to
determine the repeatability of the method. The results are shown in Table 3.
The criteria adopted to validate the repeatability of the method was that the amplitude should be lower than the repeatability limit, as described by Inmetro,22 and that the
RSD would be less than 15%, as established by AOAC.23
Thus, by evaluating the three levels of magnitude it is possible to observe that all of the criteria were met, and thus acceptable repeatability verified.
For the accuracy, we determined the relative error for each analyte and obtained values ranging from 90 to 110%.22 As criteria for the LOQ, the same procedure
described for the accuracy and repeatability was adopted, except for the lower concentration of the curve, 2.0 µg L-1,
which was analyzed seven times. The results are reported in Table 4. The test was applied to obtain results that can be achieved experimentally, unlike the values obtained from calculations based on the signal to noise ratio.
For the LOQ to be validated, an RSD of less than 15%, amplitude less than the limit of repeatability, and relative error between 80 and 120% were also adopted as criteria, which were met for all compounds.22,23
The LOD was calculated according to the equation described by Inmetro,22 which considers 5 times the
standard deviation of LOQ (Table 5). Since the objective of the study was to develop a quantitative method, the LOD was estimated with the equation described in the validation guidelines.
Three replicates of four real samples were analyzed using the proposed method. Representative aliquots of the same samples were also spiked with 25.0 µg L-1 and again
analyzed to verify the recovery of the method. The results shown in Table 5 reveal that values of 70 to 125% were obtained, in agreement with the range suggested by the official guidelines.22,23 Thus, the method was considered
validated.
Table 2. Equations of calibration curves and statistical results obtained for the proposed method
Compound Equation R2 Residuals normality test
W p-value
MCB y = 0.00043x2 + 0.14049x 0.9996 0.9313 0.1044
1,3-DCB y = 0.00149x2 + 0.06138x 0.9985 0.9239 0.1040
1,4-DCB y = 0.00248x2 + 0.15935x 0.9975 0.9532 0.3654
1,2-DCB y = 0.00124x2 + 0.15962x 0.9987 0.9733 0.7488
1,3,5-TCB y = 0.00244x2 + 0.05651x 0.9990 0.9451 0.2119
1,2,4-TCB y = 0.00021x2 + 0.01512x 0.9992 0.9474 0.1852
1,2,3-TCB y = 0.00094x2 + 0.01406x 0.9985 0.9343 0.1508
1,2,3,5 + 1,2,4,5-TrCB y = 0.019554x2 – 0.02187x 0.9988 0.9557 0.4069
Toluene y = 0.00717x2 + 0.25166x 0.9977 0.9519 0.2383
Ethylbenzene y = 0.00607x2 + 0.12330x 0.9976 0.9522 0.2612
m + p-Xylene y = 0.03413x2 + 0.51486x 0.9975 0.9641 0.6015
o-Xylene y = 0.00945x2 + 0.27736x 0.9992 0.9354 0.1290
R2: determination coefficient; W: Shapiro-Wilk test; p-value: probability value; MCB: monochlorobenzene; DCB: dichlorobenzene; TCB: trichlorobenzene;
TrCB: tetrachlorobenzene.
Table 3. Repeatability results obtained from the statistical treatment of the data for 20.00, 40.00 and 60.00 µg L-1
Compound 20.00 µg L
-1 40.00 µg L-1 60.00 µg L-1
Mean / (µg L-1) RSD / % Mean / (µg L-1) RSD / % Mean / (µg L-1) RSD / %
MCB 18.72 ± 1.37 2.95 38.65 ± 1.91 1.98 60.44 ± 3.05 2.03
1,3-DCB 19.40 ± 2.53 5.26 41.99 ± 2.23 2.14 60.27 ± 2.48 1.67
1,4-DCB 19.79 ± 2.63 5.34 40.46 ± 3.92 3.89 59.26 ± 3.55 2.41
1,2-DCB 19.02 ± 2.41 5.11 39.50 ± 1.56 1.59 60.35 ± 4.29 2.87
1,3,5-TCB 18.71 ± 1.59 3.43 40.27 ± 6.75 6.76 60.36 ± 2.51 1.68
1,2,4-TCB 20.09 ± 2.14 4.27 40.34 ± 4.82 4.80 60.17 ± 2.88 1.93
1,2,3-TCB 19.99 ± 2.23 4.50 38.08 ± 1.94 2.04 59.64 ± 2.26 1.52
1,2,3,5 + 1,2,4,5-TrCB 36.84 ± 2.81 3.08 76.15 ± 4.92 2.60 118.12 ± 4.07 1.39
Toluene 19.97 ± 2.58 5.21 42.24 ± 1.32 1.26 59.42 ± 3.67 2.48
Ethylbenzene 20.83 ± 4.20 8.09 39.21 ± 1.07 1.11 59.23 ± 0.89 0.60
m + p-Xylene 36.35 ± 3.85 4.25 76.87 ± 9.16 4.79 123.52 ± 3.60 1.18
o-Xylene 19.71 ± 2.43 4.95 39.58 ± 4.00 4.07 62.34 ± 3.48 2.24
RSD: relative standard deviation; MCB: monochlorobenzene; DCB: dichlorobenzene; TCB: trichlorobenzene; TrCB: tetrachlorobenzene.
Table 4. Results for LOQ and LOD obtained from the statistical treatment of the data
Compound Mean / (µg L-1) RSD / % Amplitude / (µg L-1) Repeatability limit LOD / (µg L-1)
MCB 1.99 ± 0.17 3.63 0.18 0.25 0.18
1,3-DCB 2.01 ± 0.12 2.73 0.16 0.19 0.13
1,4-DCB 2.01 ± 0.17 3.33 0.17 0.23 0.16
1,2-DCB 1.99 ± 0.42 8.31 0.40 0.57 0.41
1,3,5-TCB 2.07 ± 0.35 6.64 0.34 0.47 0.34
1,2,4-TCB 2.02 ± 0.27 5.55 0.31 0.39 0.27
1,2,3-TCB 2.06 ± 0.32 6.09 0.33 0.43 0.31
1,2,3,5 + 1,2,4,5-TrCB 4.35 ± 0.25 2.22 0.28 0.33 0.12
Toluene 2.08 ± 0.15 3.01 0.18 0.22 0.15
Ethylbenzene 1.96 ± 0.30 6.28 0.33 0.43 0.30
m + p-Xylene 4.42 ± 0.40 3.56 0.42 0.54 0.19
o-Xylene 2.00 ± 0.27 5.65 0.29 0.39 0.28
RSD: relative standard deviation; LOD: limit of detection; MCB: monochlorobenzene; DCB: dichlorobenzene; TCB: trichlorobenzene; TrCB: tetrachlorobenzene.
Table 5. Average results (n = 3) obtained for the analysis of four oil sludge samples and the mean recovery values of the spiked replicates
Compound Sample 1 / (µg L-1) Sample 2 / (µg L-1) Sample 3 / (µg L-1) Sample 4 / (µg L-1) Recovery / %
MCB < LOQ < LOQ < LOQ < LOQ 93.21 ± 16.83
1,3-DCB < LOQ < LOQ < LOQ < LOQ 97.52 ± 22.64
1,4-DCB < LOQ < LOQ < LOQ < LOQ 89.74 ± 14.52
1,2-DCB < LOQ < LOQ < LOQ < LOQ 89.25 ± 15.19
1,3,5-TCB < LOQ < LOQ < LOQ < LOQ 89.43 ± 1.56
1,2,4-TCB < LOQ < LOQ < LOQ < LOQ 98.43 ± 15.99
1,2,3-TCB < LOQ < LOQ < LOQ < LOQ 84.39 ± 20.78
1,2,3,5 + 1,2,4,5-TrCB < LOQ < LOQ < LOQ < LOQ 89.00 ± 10.20
Toluene < LOQ 10.02 ± 0.67 < LOQ < LOQ 94.29 ± 9.58
Ethylbenzene < LOQ 19.06 ± 2.83 8.44 ± 1.44 < LOQ 96.92 ± 17.65
m + p-Xylene 2.48 ± 0.20 13.31 ± 1.84 4.16 ± 0.52 < LOQ 89.21 ± 9.56
o-Xylene 6.34 ± 1.19 19.85 ± 1.79 6.60 ± 1.76 5.36 ± 0.82 79.73 ± 10.33
With the exception of benzene, non-chlorinated aromatic volatile compounds were quantified in the 4 oil sludge samples (Table 5) and chlorinated compounds were not detected up to the LOQ. According to the Brazilian legislation, the waste samples analyzed, based on these tests, would be classified as type II, non-hazardous waste.25
Considering the flammability of these types of residues and other characteristics not discussed in this study, they would be classified as type I, hazardous waste, according to the current legislation.
Since incineration is a common destination for petrochemical residues, concentrations of chlorobenzenes below the LOQ is an important aspect, since this minimizes the amount of dioxins and furans that could be formed during the incineration process.
Conclusions
A multiresidue method for the analysis of volatile compounds by HS-SPME GC-MS in solid waste was developed using a proportion of solid residue and extractive solution for the leaching phase, as well as orbital agitation time and speed, equivalent to the leaching method.
The advantages of the proposed method include the fact that the extraction is performed inside the vial, minimizing inherent difficulties in the current methodology for the leaching of more complex samples. Also, the use of an SPME fiber in the analytical method increases the selectivity and sensitivity.
With the proposed method, the solid waste leached extract presented a working range of 2.0 to 90.0 µg L-1
with linearity (R²) of the compounds between 0.9975 and 0.9996. The repeatability was adequate (RSD < 10.0%) throughout the working range, with a limit of detection of 0.12 to 0.41 µg L-1. Recovery from real samples was
higher than 76.02%. Thus, this method was validated for the proposed application, since all parameters evaluated are in accordance with the requirements of the current guidelines.
In addition, it was possible to overcome the difficulties associated with applying the methodology described in ABNT NBR 100054 and EPA method 13115 to pasty
residues like the samples analyzed in this study. Since these samples cannot be analyzed using the standard procedure it was not possible to compare the results for the two methods.
Acknowledgments
The authors are grateful to Serviço Nacional de Aprendizagem Industrial (SENAI) for financial support, Petróleo Brasileiro S.A. (Petrobras) and Conselho Nacional
de Desenvolvimento Científico e Tecnológico (CNPq; grant 307759/2016-4).
References
1. https://tradingeconomics.com/brazil/crude-oil-production, accessed in July 2018.
2. Elektorowicz, M.; Habibi, S.; Can. J. Civ. Eng. 2005, 32, 164. 3. Bernardo, M. S.; Gonçalves, M.; Lapa, N.; Barbosa, R.; Mendes,
B.; Pinto, F.; Gulyurtlu, I.; Talanta2009, 80, 104.
4. ABNT NBR 10005: Procedimento para Obtenção de Extrato
Lixiviado de Resíduos Sólidos, ABNT: Rio de Janeiro, 2004.
5. United States Environmental Protection Agency (US EPA);
Method 1311. Toxicity Characteristic Leaching Procedure; US
EPA: Washington, 1992, 1-35.
6. United States Environmental Protection Agency (US EPA);
SW-846 Compendium, available at
https://www.epa.gov/hw-sw846/sw-846-compendium, accessed in July 2018. 7. http://www.eurochlor.org/media/49375/8-11-4-19_marine_
ra_124_trichlorobenzene.pdf, accessed in July 2018. 8. Meek, M. E.; Giddings, M.; Gomes, R.; J. Environ. Sci. Health,
Part C: Environ. Carcinog. Ecotoxicol. Rev. 1994, 12, 409. 9. Conselho Nacional do Meio Ambiente (CONAMA); Resolution
Number 316, Dispõe sobre Procedimentos e Critérios para o Funcionamento de Sistemas de Tratamento Térmico de Resíduos; CONAMA, Brasília, 2002. Available at http://www.mma.gov.br/ port/conama/legiabre.cfm?codlegi=338, accessed in July 2018. 10. Vidonish, J. E.; Zygourakis, K.; Masiello, C. A.; Sabadell, G.;
Alvarez P. J. J.; Engineering2016, 2, 426.
11. Liu, H.; Kong, S.; Liu, Y.; Zeng, H.; Procedia Environ. Sci.
2012, 16, 661.
12. Frena, M.; Madureira, L. A. S.; Tonietto, A. E.; J. Braz. Chem. Soc. 2013, 24, 1530.
13. Souza-Silva, E. A.; Jiang, R.; Rodríguez-Lafuente, A.; Gionfriddo, E.; Pawliszyn, J.; TrAC,Trends Anal. Chem. 2015,
71, 224.
14. Merkle, S.; Kleeberg, K. K.; Fritsche, J.; Chromatography2015,
2, 293.
15. Leardi, R.; Anal. Chim. Acta2009, 652, 161.
16. Bezerra, M. A.; Santelli, R. E.; Oliveira, E. P.; Villar, L. S.; Escaleira, L. A.; Talanta2008, 76, 965.
17. Santos, F. J.; Sarrión, M. N.; Galceran, M. T.; J. Chromatogr. A1997, 771, 181.
18. Saraji, M.; Mehrafza, N.; Microchim. Acta2015, 182, 841. 19. Statsoft, Inc.; Statistica, version 10; Statsoft, Inc., Tulsa, OK,
2010.
20. US EPA; Method 8250C, GC-MS for Semivolatile Organics:
Packed Column Technique; US EPA, 1986.
21. ABNT NBR ISO/IEC 17025: Requisitos Gerais para
Competência de Laboratórios de Ensaio e Calibração, ABNT:
22. Instituto Nacional de Metrologia, Qualidade e Tecnologia (Inmetro); DOQ-CGCRE-008: Orientação sobre Validação de Métodos Analíticos; Inmetro: Rio de Janeiro, 2016.
23. Association of Official Analytical Chemists (AOAC); Official Methods of Analysis, AOAC Guidelines for Single Laboratory
Validation of Chemical Methods for Dietary Supplements and
Botanicals; AOAC: Washington, 2002.
24. Lopes, M. M.; Branco, V. T. F. C.; Soares, J. B.; Transportes
2013, 21, 59.
25. ABNT NBR 10004: Resíduos Sólidos - Classificação; ABNT: Rio de Janeiro, 2004.
Submitted: February 23, 2018
Published online: July 18, 2018