1984-0462/$ - see front matter © 2014 Sociedade de Pediatria de São Paulo. Published by Elsevier Editora Ltda. All rights reserved.
REVISTA PAULISTA
DE PEDIATRIA
www.spsp.org.brORIgInAL ARTIcLE
Nutritional status, metabolic changes and white blood cells
in adolescents
☆Thatianne Moreira Silva Oliveira
a,*, Franciane Rocha de Faria
a, Eliane Rodrigues de Faria
b,
Patrícia Feliciano Pereira
a, Sylvia C.C. Franceschini
a, Silvia Eloiza Priore
aaUniversidade Federal de Viçosa (UFV), Viçosa, MG, Brazil bUniversidade Federal do Espírito Santo (UFES), Alegre, ES, Brazil
Received 10 February 2014; accepted 23 April 2014
KEywORdS Obesity; Adolescent; Risk factors; Leukocyte count
Abstract
Objective: To analyze the relationship between the peripheral blood white cells, metabolic changes, and nutritional status of adolescents with and without excess weight and body fat.
Methods: This cross-sectional study evaluated the body mass index (BMI) and percentage body fat (%BF) in 362 adolescents from 15 to 19 years of age, of both sexes. White blood cell count, platelet count, uric acid, fasting glucose, insulin, and lipid profile were measured. The inclusion criteria were agreement to participate in the study and signature of the informed consent. Exclusion criteria were: presence of chronic or infectious disease; use of medications that could cause changes in biochemical tests; pregnancy; participation in weight reduction and weight control programs; use of diuretics and laxatives; or the presence of a pacemaker. The following statistical tests were applied: Kolmogorov-Smirnov test, Student’s t or Mann-Whitney test, Pearson or Spearman correlation tests, and chi-squared test, considering p<0.05.
Results: Overweight was observed in 20.7% of adolescents. The total cholesterol (Tc) had a higher percentage of inadequacy (52.2%), followed by high-density lipoprotein (HDL) (38.4%). There was a positive correlation between white cells and serum lipids, insulin, body fat, and BMI. Monocytes were negatively correlated with BMI, and rods with BMI, body fat, and insulin.
Conclusions: nutritional status is related to an inflammatory process, and adolescents with excess weight or body fat presented higher amounts of white blood cells.
© 2014 Sociedade de Pediatria de São Paulo. Published by Elsevier Editora Ltda. All rights reserved.
☆Study conducted at Universidade Federal de Viçosa, Viçosa, Mg, Brazil. *corresponding author.
Introduction
Adolescence corresponds to the stage of life between childhood and adulthood, from 10 to 19 years of age, during which physical, psychological, and social changes occur, with focus on growth, with an increase in weight and height and sexual maturation.1,2
This is one of the critical periods for the onset of obesity. Approximately 70% of obese adults started to gain weight during adolescence.4 Although obesity is associated with
several medical complications in adults, the implications of obesity in children and adolescents are yet to be clearly defined.3.4
The prevalence of obesity shows increasingly high numbers. It is estimated that in 2030, there will be a worldwide increase of 25% and 32% in cases of overweight and obesity, respectively.5 According to the Pan American
Health Organization (PAHO), obesity affects all age ranges.5
However, in recent decades, the number of overweight adolescents has increased by approximately 70% in the U.S. and by 240% in Brazil.5,6
Obesity, which should be considered a low-level inflammatory condition, is a pro-inflammatory state with hypertrophy and hyperplasia of adipocytes related to metabolic and cardiovascular disorders, such as type 2 diabetes, hypertension, atherosclerosis, dyslipidemia, and acute and chronic inflammatory processes. This is due to the fact that the white adipose tissue produces cytokines or adipocytokines involved in this process.7-10
White blood cells or leukocytes are immune defense system cells and are closely linked to the thrombogenic and inflammatory profile, and their levels are associated with metabolic and cardiovascular disorders caused by obesity.11,12 The change in concentrations of serum lipids
can lead to thrombus formation inside arteries and veins, leading to the aggregation of inflammatory markers such as platelets and leukocytes.7.13 The levels of neutrophils and
eosinophils, as well as monocytes and lymphocytes in obese children, may be important in understanding the evolution of inflammation and disease.3
Therefore, this study aimed to correlate white blood cells to metabolic and nutritional alterations in adolescents with and without excess weight and body fat.
Method
This was a cross-sectional study conducted in the city of Viçosa, state of Mg, between 2011 and 2012, in adolescents aged 15 to 19 years, of both genders, enrolled in public and private schools in the urban area of the municipality.
The sample of 362 adolescents was calculated using Epi Info software, release 6.04 (centers for Disease control and Prevention georgia, United States), based on a specific formula for cross-sectional studies. This study considered a population of 3,608 adolescents in the study age range, a prevalence of 50%, as the study considered as outcome
Estado nutricional, alterações metabólicas e células brancas na adolescência
Resumo
Objetivo: Analisar a relação entre as células brancas do sangue periférico e as alterações metabólicas e estado nutricional de adolescentes com e sem excesso de peso e gordura corporal.
Métodos: Avaliou-se, em estudo transversal, o Índice de Massa corporal (IMc) e o percentual de gordura corporal (%gc) em 362 adolescentes de 15 a 19 anos de idade, de ambos os sexos. Os critérios gerais de inclusão foram: ter aceitado participar da pesquisa e assinado o termo de consentimento livre e esclarecido. Os critérios de exclusão foram: relatar a presença de doenças crônicas ou infecciosas; usar medicamentos que pudessem causar alteração nos exames bioquímicos; ter engravidado; ter participado de programas de redução e controle de peso; usar diuréticos/laxantes ou usar marcapasso. Realizou-se leucograma, contagem de plaquetas, ácido úrico, glicemia de jejum, insulina e perfil lipídico. Utilizaram-se os testes Kolmogorov-Smirnov, t de Student ou Mann Whitney, correlação de Pearson ou de Spearman e qui-quadrado, considerando significante p<0,05.
Resultados: Excesso de peso foi verificado em 20,7% dos adolescentes. O colesterol total (cT) apresentou maior porcentagem de inadequação (52,2%), seguido da lipoproteína de alta densidade (HDL) (38,4%). Encontraram-se correlações positivas entre células brancas e lipídeos séricos, insulina, gordura corporal e IMc. Os monócitos apresentaram correlação negativa com IMc e os bastonetes com IMc, gordura corporal e insulina.
Conclusões: O estado nutricional está relacionado com um quadro inflamatório, sendo que adolescentes com excesso de peso e/ou de gordura corporal apresentaram maiores quantidades de células brancas.
© 2014 Sociedade de Pediatria de São Paulo. Publicado por Elsevier Editora Ltda. Todos os direitos reservados.
multiple cardiovascular risk factors, acceptable variability of 5%, and a confidence level of 95%.
Adolescents were chosen by drawing lots. Sample selection occurred in all high schools of the municipality. The principals were contacted and were informed about the objectives and methodology of the project, whereupon permission was requested to invite the adolescents to participate in the study. Parents or guardians of students younger than 18 received the informed consent, as well as students aged 18 years and older, and those interested in participating in the study signed it.
The screening for the selection of suitable volunteers was performed according to the general inclusion criteria, as follows: age between 15 and 19 years; accepting to take part in the research, signing the informed consent. Exclusion criteria were: presence of chronic or infectious diseases; regular use of medications that could cause changes in biochemical tests; pregnancy; having participated in programs of weight reduction and control; use of diuretics/ laxatives; or use of a pacemaker.
Anthropometric assessment was performed by nutritionists from the Department of Health of Universidade Federal de Viçosa (UFV). Weight was obtained using a portable electronic digital scale with a maximum capacity of 150kg. Height was determined using a vertical stadiometer with a maximum height of 2.13m. Measurements were performed in duplicate, using the mean value of two measurements. After the data was obtained, the body mass index (BMI) was calculated and the corresponding percentiles according to age and gender was used to classify the nutritional status of adolescents, as proposed by the World Health Organization (WHO).14
To assess the percentage of body fat, a vertical tetrapolar bioelectrical impedance device with eight-point tactile electrodes was employed. The examination was performed in the morning after participants fasted for 12 hours, according to the evaluation protocol.15 The percentage
of body fat was analyzed according to the classification proposed by Lohman.16
A 2-meter long inelastic measuring tape was used to measure waist circumference, obtained at the lowest horizontal circumference, and hip circumference, with both measures obtained in duplicate and using the mean value of the two measurements.
The biochemical assessment was conducted in the Laboratory of clinical Analysis of the Health Division of UFV. White blood cell (WBc) and platelet counts, uric acid, fasting glucose and insulin levels, and lipid profile (total cholesterol [Tc], triglycerides [Tg], low density lipoprotein [LDL], high density lipoprotein [HDL], and very low density lipoprotein [VLDL]) were assessed.
The samples with 12 mL of blood were collected in disposable vials by venipunctture in the morning, after a 12-hour fast. WBc and platelet counts were measured by flow cytometry method and uric acid by the enzymatic colorimetric method in automated cobas Mira Plus equipment (Roche¨ - Indiana, United States) and classified according to gender and age, using the reference values of the Bioclin-Quibasa kit (Bioclin-Quibasa _ Minas gerais, Brazil), routinely used in the laboratory, which are 2.0-7.0mg/dL for males and 1.5-6.0mg/dL for females.17 The
cutoff points used in the classification of dyslipidemia
were recommended by I guideline for the Prevention of Atherosclerosis in childhood and Adolescence.18
Altered fasting glucose were considered when levels were >100mg/dL, according to the recommendation of the American Diabetes Association.19 For the analysis of
hyperinsulinemia, fasting plasma insulin >
15μU/mL was considered altered.19 Insulin resistance
was calculated by Homeostasis Model Assessment - Insulin Resistance (HOMA-IR), and was considered indicative of insulin resistance when HOMA-IR 33.16.19
The values found for waist circumference, hip circumference, WBcs, platelets, and uric acid were classified using a cutoff of 390th percentile, as cutoff points for adolescents are yet to be established.
Blood pressure (BP) was measured using an automatic BP monitor, and the cutoff points used were those recommended by the Brazilian Society of cardiology, according to the guidelines of the VI Brazilian guidelines on Arterial Hypertension.20
The data were entered into an Excel 2007 spreadsheet and the analysis was performed using SPSS®, release 17.0 (chicago, United States) and Epi-Info software, release 3.5.1 (centers for Disease control and Prevention, georgia, United States). The Kolmogorov-Smirnov test; Student’s t-test or the Mann-Whitney test; Pearson’s or Spearman’s correlation; and the chi-squared test were used. Significance level was set at p<0.05.
The study was approved by the Ethics committee on Human Research of UFV (Ref. no. 0140/2010).
Results
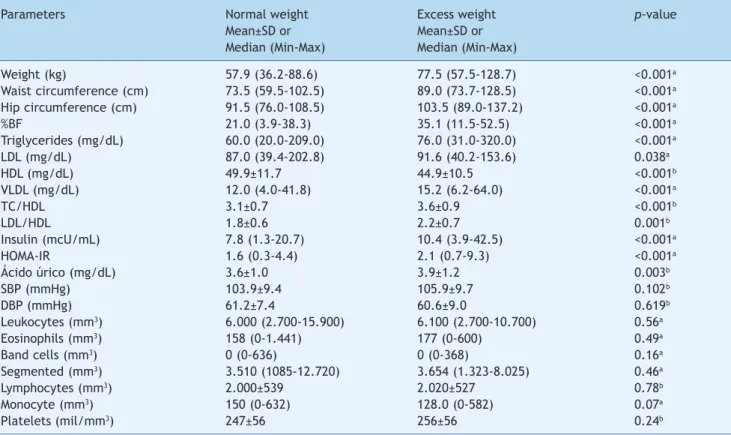
The study included 362 adolescents with a mean age of 17.3 ± 1.2 years. According to the nutritional status classification, adolescents were divided between the normal weight and the excess weight group; as well as the group with and without excess body fat. Regarding the classification of nutritional status by BMI, females accounted for 55% of the normal weight group and 52% of the excess weight group. As for the percentage of body fat, females represented 29% of the group without excess body fat and 79% of the group with excess body fat. Table 1 shows the anthropometric and biochemical variables in relation to nutritional status defined by BMI. Higher values of all parameters were found in adolescents with excess weight, with the exception of HDL, which was lower. Leukocytes, eosinophils, band cells, segmented neutrophils, lymphocytes, and monocytes showed no significant differences between adolescents with normal and excess weight.
Table 2 shows the anthropometric and biochemical variables in relation to body fat percentage. Higher values were for all variables in adolescents with excess body fat, with the exception of glucose, uric acid, and systolic blood pressure (SBP), which showed higher values in adolescents without excess body fat.
Table 4 shows the correlation between white blood cells and platelets with serum lipids, body fat, and insulin, and all variables showed positive correlations with the exception of monocytes, which were negatively correlated with BMI, as well as band cells with BMI, body fat, and insulin.
The nutritional status of the adolescents was associated only with HDL (p<0.001), Tg (p=0.004), Tc/HDL (p=0.001), and uric acid (p=0.039). The group of adolescents with excess weight was more likely to have low HDL (OR=2.43, 95% cI=1.4-4.23, p<0.001), hypertriglyceridemia (OR=2.44, 95 cI%=1.24-4.79, p=0.004) and hyperuricemia (OR=2.1, 95% cI=0.96-4.56, p=0.039) (Table 5).
Only the lipid profile (Tc, p=0.02; Tg, p<0.001, LDL p=0.02, and VLDL, p=0.01), insulin (p<0.001), leukocytes (p=0.003), and segmented neutrophils (p=0.02) were associated with excess adiposity; it may be that adolescents with excess weight could have a greater chance of having dyslipidemia, hyperinsulinemia, and a more marked inflammatory state (Table 6).
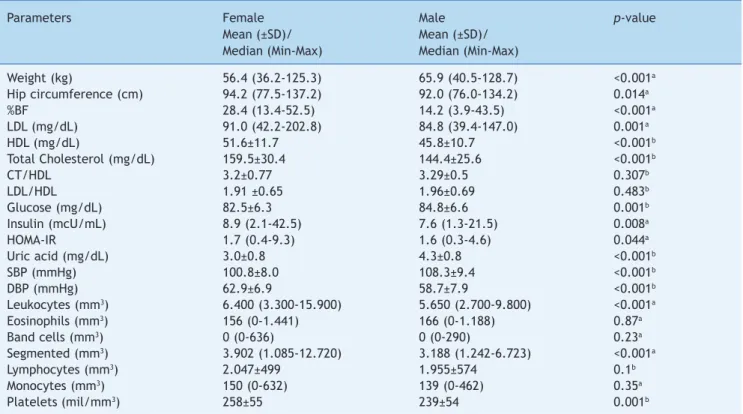
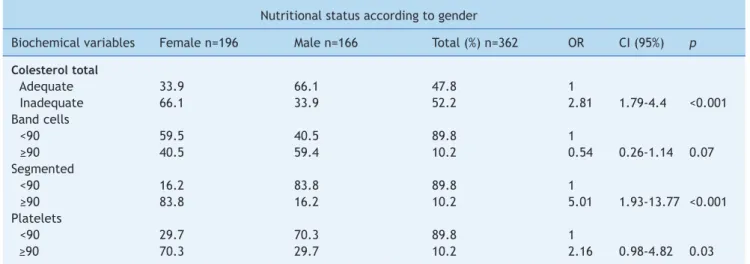
The nutritional status of adolescents in relation to gender showed an association only with Tc (p<0.001), band cells (p=0.07), segmented neutrophils (p<0.001), and platelets (p=0.03). The female adolescents had a greater chance of having hypercholesterolemia and a more acute inflammatory state, as they had higher levels of cholesterol, neutrophils, and platelets (Table 7).
discussion
The 2008-2009 Family Budget Survey (FBS) showed that among males aged 10-19 years of age, the frequency of excess weight increased from 3.7% (1974-75) to 21.7% (2008-09); and in females, the increase of excess weight was 7.6% to 19.4% in the same age group.21 The increasing
prevalence of overweight and obesity at increasingly younger ages has been a concern of researchers and health care professionals, as excess weight increases the risk of cardiovascular diseases.5
In the present study, it was observed that the group with excess weight showed higher prevalence of low HDL levels, hypertriglyceridemia, high Tc/HDL ratio, and hyperuricemia.
The association between dyslipidemia and obesity, previously only seen in adults, has been documented in children and adolescents. According to Priore et al4
overweight students are 2.4 to 7.1-fold moore likely to have higher levels of Tc, LDL, and Tg; and 12.6-fold more likely to have hyperinsulinemia. However, mean values of HDL were lower among those with excess weight,4 results
similar to those obtained in the present study.
currently, it is known that abdominal fat seems to be more associated with dyslipidemia, arterial hypertension, and impaired glucose metabolism, with waist circumference
Table 1 comparison of body composition and biochemical variables between groups of adolescents with normal weight and those with excess weight. Viçosa, Mg, Brazil.
Parameters normal weight Excess weight p-value
Mean±SD or Mean±SD or
Median (Min-Max) Median (Min-Max)
Weight (kg) 57.9 (36.2-88.6) 77.5 (57.5-128.7) <0.001a
Waist circumference (cm) 73.5 (59.5-102.5) 89.0 (73.7-128.5) <0.001a
Hip circumference (cm) 91.5 (76.0-108.5) 103.5 (89.0-137.2) <0.001a
%BF 21.0 (3.9-38.3) 35.1 (11.5-52.5) <0.001a
Triglycerides (mg/dL) 60.0 (20.0-209.0) 76.0 (31.0-320.0) <0.001a
LDL (mg/dL) 87.0 (39.4-202.8) 91.6 (40.2-153.6) 0.038a
HDL (mg/dL) 49.9±11.7 44.9±10.5 <0.001b
VLDL (mg/dL) 12.0 (4.0-41.8) 15.2 (6.2-64.0) <0.001a
Tc/HDL 3.1±0.7 3.6±0.9 <0.001b
LDL/HDL 1.8±0.6 2.2±0.7 0.001b
Insulin (mcU/mL) 7.8 (1.3-20.7) 10.4 (3.9-42.5) <0.001a
HOMA-IR 1.6 (0.3-4.4) 2.1 (0.7-9.3) <0.001a
Ácido úrico (mg/dL) 3.6±1.0 3.9±1.2 0.003b
SBP (mmHg) 103.9±9.4 105.9±9.7 0.102b
DBP (mmHg) 61.2±7.4 60.6±9.0 0.619b
Leukocytes (mm3) 6.000 (2.700-15.900) 6.100 (2.700-10.700) 0.56a
Eosinophils (mm3) 158 (0-1.441) 177 (0-600) 0.49a
Band cells (mm3) 0 (0-636) 0 (0-368) 0.16a
Segmented (mm3) 3.510 (1085-12.720) 3.654 (1.323-8.025) 0.46a
Lymphocytes (mm3) 2.000±539 2.020±527 0.78b
Monocyte (mm3) 150 (0-632) 128.0 (0-582) 0.07a
Platelets (mil/mm3) 247±56 256±56 0.24b
Table 2 comparison of body composition and biochemical variables between groups of adolescents with and without excess body fat. Viçosa, Mg, Brazil.
Parameters Without excess BF With excess BF p-value
Mean±SD or Mean±SD or
Median (Min-Max) Median (Min-Max)
BMI (kg/m2) 20.5 (17.0-26.3) 22.7 (17.8-45.7) <0.001a
Waist circumference (cm) 72.0 (59.5-98.5) 80.5 (63.0-128.5) <0.001a
Hip circumference (cm) 89.5 (76.0-106.0) 97.0 (79.5-137.2) <0.001a
Triglycerides (mg/dL) 58.0 (20.0-189.0) 66.0 (31.0-320.0) <0.001a
LDL (mg/dL) 84.8 (39.4-202.8) 91.4 (40.2-201.4) <0.001a
VLDL (mg/dL) 11.6 (4.0-37.8) 13.2 (6.2-64.0) <0.001a
Tc/HDL 3.1±0.7 3.4±0.8 <0.001b
LDL/HDL 1.8±0.6 2.0±0.7 0.001b
glucose (mg/dL) 84.4±6.4 82.8±6.5 0.021b
Total cholesterol (mg/dL) 146.6±26.3 158.7±30.8 <0.001b
Insulin (mcU/mL) 7.0 (1.3-18.0) 9.5 (2.8-42.5) <0.001a
HOMA-IR 1.4 (0.2-4.1) 1.9 (0.6-9.3) <0.001a
Uric acid (mg/dL) 3.8±1.0 3.5±1.1 0.004b
SBP (mmHg) 106.0±9.6 102.5±9.0 <0.001b
DBP (mmHg) 60.0±7.5 62.0±7.7 0.014b
Leukocytes (mm3) 5.700 (2.700-10.300) 6.300 (3.200-15.900) <0.001a
Eosinophils (mm3) 135 (0-1.188) 184 (0-1.441) 0.004a
Band cells (mm3) 0 (0-318) 0 (0-636) 0.029a
Segmented (mm3) 3.240 (1.085-7.828) 3.843(1.408-12.720) <0.001a
Lymphocytes (mm3) 1.956±552 2.053±516 0.08b
Monocytes (mm3) 159 (0-434) 134 (0-632) 0.07a
Platelets (mil/mm3) 2.391±55 259±55 0.001b
aMann-Whitney test; bStudent’s t-test; %BF, percentage of body fat; BMI, body mass index; Tc, total cholesterol; LDL, low
density lipoprotein; HDL, high density lipoprotein; VLDL, very low density lipoprotein; HOMA-IR, Homeostasis Model Assessment - Insulin Resistance; SBP, systolic blood pressure; DBP, diastolic blood pressure.
Table 3 comparison of body composition and biochemical variables between genders. Viçosa, Mg, Brazil.
Parameters Female Male p-value
Mean (±SD)/ Mean (±SD)/
Median (Min-Max) Median (Min-Max)
Weight (kg) 56.4 (36.2-125.3) 65.9 (40.5-128.7) <0.001a
Hip circumference (cm) 94.2 (77.5-137.2) 92.0 (76.0-134.2) 0.014a
%BF 28.4 (13.4-52.5) 14.2 (3.9-43.5) <0.001a
LDL (mg/dL) 91.0 (42.2-202.8) 84.8 (39.4-147.0) 0.001a
HDL (mg/dL) 51.6±11.7 45.8±10.7 <0.001b
Total cholesterol (mg/dL) 159.5±30.4 144.4±25.6 <0.001b
cT/HDL 3.2±0.77 3.29±0.5 0.307b
LDL/HDL 1.91 ±0.65 1.96±0.69 0.483b
glucose (mg/dL) 82.5±6.3 84.8±6.6 0.001b
Insulin (mcU/mL) 8.9 (2.1-42.5) 7.6 (1.3-21.5) 0.008a
HOMA-IR 1.7 (0.4-9.3) 1.6 (0.3-4.6) 0.044a
Uric acid (mg/dL) 3.0±0.8 4.3±0.8 <0.001b
SBP (mmHg) 100.8±8.0 108.3±9.4 <0.001b
DBP (mmHg) 62.9±6.9 58.7±7.9 <0.001b
Leukocytes (mm3) 6.400 (3.300-15.900) 5.650 (2.700-9.800) <0.001a
Eosinophils (mm3) 156 (0-1.441) 166 (0-1.188) 0.87a
Band cells (mm3) 0 (0-636) 0 (0-290) 0.23a
Segmented (mm3) 3.902 (1.085-12.720) 3.188 (1.242-6.723) <0.001a
Lymphocytes (mm3) 2.047±499 1.955±574 0.1b
Monocytes (mm3) 150 (0-632) 139 (0-462) 0.35a
Platelets (mil/mm3) 258±55 239±54 0.001b
aMann-Whitney test; bStudent’s t-test; %BF, percentage of body fat; BMI, body mass index; LDL, low density lipoprotein; HDL,
Oliveira
TM et al
Table 4 correlations between body fat, serum lipids, and white blood cells and platelets. Viçosa, Mg, Brazil
Variables BMI Wc Hc %BF Tg LDL HDL Tc glucose Insulin HOMA- Leuko Eosi Mono Band Seg Lympho Platelets
kg/m² cm cm mg/dLmg/dL mg/dL mg/dL mg/dL mcU/mL IR mm³ mm³ mm³ mm³ mm³ mm³ mil/mm³
BMI (kg/m²) -- 0.840a 0.837a 0.485a 0.195a 0.096 -0.213a 0.069 0.022 0.317a 0.303a 0.096 0.099 -0.166a -0.110b 0.122a 0.038 0.064
Wc (cm) -- 0.822a 0.523a 0.278a 0.153a -0.255a 0.114b 0.029 0.321a 0.308a 0.101 0.118b -0.117b -0.046 0.113b 0.051 0.090
Hc (cm) -- 0.582a 0.194a 0.135a -0.146a 0.093 -0.019 0.350a -0.328a 0.083 0.076 -0.210a -0.145a 0.139a -0.015 0.081
%BF -- 0.205a 0.229a 0.031 0.284a -0.066 0.398a 0.366a 0.241a 0.113b -0.094 -0.117b 0.260a 0.101 0.190a
Tg (mg/dL) -- 0.295a -0.218a 0.400a 0.099 0.392a 0.380a 0.055 0.068 -0.036 -0.024 -0.032 0.171a 0.170a
LDL (mg/dL) -- 0.014 0.911a -0.008 0.112b 0.109b 0.033 0.040 <0.001 -0.025 -0.015 0.178a 0.179a
HDL (mg/dL) -- 0.355a -0.038 -0.144b -0.118b 0.106b 0.019 0.012 0.047 0.102 0.045 0.055
Tc (mg/dL) -- 0.003 0.170a 0.159a 0.074 -0.029 0.009 0.024 0.013 0.208a 0.213a
glucose (mg/dL) -- 0.216a 0.359a -0.115b -0.007 -0.027 -0.004 -0.148a 0.045 -0.035
Insulin (mcU/mL) -- 0.984a 0.202a 0.093 0.089 -0.143a 0.204a 0.144a 0.130b
HOMA-IR -- 0.175a 0.081 -0.093 -0.133b 0.172a 0.141a 0.118b
Leuko (mm³) -- 0.291a 0.277a 0.058 0.0887a 0.485a 0.307a
Eosi (mm³) -- 0.067 0.003 0.129b 0.166a 0.015
Mono (mm³) -- 0.453a 0.056 0.336a 0.120b
Band (mm³) -- 0.118b 0.155a 0.022
Seg (mm³) -- 0.155a 0.269a
Lympho (mm³) -- 0.215a
Platelets (mil/mm³)
--LDL, low density lipoprotein; HDL, high density lipoprotein; BMI, body mass index; Wc, waist circumference; Hc, hip circumference; Leuko, leukocytes; HOMA-IR, Homeostasis Model Assessment - Insulin Resistance; Eosi, eosinophils; Mono, monocytes; Band, band cells; Seg, segmented; Lympho, lymphocytes; Pearson’s correlation – parametric variables or one parametric variable and another non-parametric variable; Spearman’s correlation – non-parametric variables.
ap<0.001
Table 5 Prevalence of biochemical abnormalities in adolescents with and without excess body weight. Viçosa, Mg, Brazil.
nutritional status according to BMI
Biochemical With excess no excess weight % Total % OR cI (95%) p
Variables weight % (n=75) (n=287) (n=362)
hdl
Adequate 45.3 66.2 61.6 1
Inadequate 54.6 33.8 38.1 2.43 1.4-4.23 <0.001
Triglycerides
Adequate 74.6 87.8 85.0 1
Inadequate 25.3 12.2 14.9 2.44 1.24-4.79 0.004
Tc/HDL
Adequate 80.0 92.4 72.7 1
Inadequate 20.0 7.6 27.3 3.01 1.39-6.49 0.001
Uric acid
<90 82.7 91.0 89.3 1
≥90 17.3 9.0 10.7 2.1 0.96-4.56 0.039
HDL, high density lipoprotein; OR, odds ratio; CI, conidence interval; chi-squared test (p<0.05).
Table 6 Prevalence of biochemical changes and white blood cells in adolescents with and without excess body fat. Viçosa, Mg, Brazil.
nutritional status according to the percentage of body fat
Biochemical variables With excess no excess Total (%) OR cI (95%) p of BF (%) n=181 of BF (%) n=287 n=362
Total cholesterol
Adequate 42.0 53.6 47.8 1
Inadequat 58.0 46.4 52.2 1.60 1.03-2.47 0.02
Triglycerides
Adequate 78.5 91.7 85.1 1
Inadequat 21.5 8.3 14.9 3.04 1.55-6.04 <0.001
ldl
Adequate 67.4 78.0 72.7 1
Inadequat 32.6 22.0 27.3 1.7 1.04-2.8 0.02
vldl
Adequate 85.1 93.4 89.3 1
Inadequat 14.9 6.6 10.7 2.47 1.15-5.37 0.01
Insulin
Adequate 82.4 98.4 67.2 1
Inadequat 17.6 1.6 32.8 12.74 3.64-53.3 <0.001
Leukocytes
<90 84.6 94.0 69.0 1
≥90 15.4 6.0 31.0 2.83 1.3-6.28 0.003
Segmented
<90 86.2 93.4 71.7 1
≥90 13.8 6.6 28.3 2.26 1.04-4.95 0.02
BF, body fat; Tc, total cholesterol; Tg, triglycerides; LDL, low density lipoprotein; VLDL, very low density lipoprotein; OR, odds ratio; CI, conidence interval; chi-squared test (p<0.05)
considered a good indicator of adiposity and cardiovascular risk.10,22 gontijo et al,23 in their study of 199 adolescents
aged 10 to 19 years, observed higher mean values dy of 199 adolescents aged 10 to 19 years, observed higher mean values of VLDL, waist circumference, and hip circumference
in adolescents with excess weight, similar results to those obtained in the present study.
profile, in which the number of WBcs appears to be increased.12,24 This may explain the higher number of
leukocytes, eosinophils, and segmented neutrophils found in the adolescents with excess body fat in this study.
To prevent the occurrence of atherosclerosis, an inflammatory picture is initiated, in which WBcs are recruited to the site of the vessel with fat accumulation, in order to prevent thrombus formation.25 This inflammatory
process can explain the positive correlation between leukocytes and lymphocytes with body fat, Tc, LDL, and Tg.
Regarding body weight, there was no difference between concentrations of WBcs (lymphocytes, monocytes, neutrophils, eosinophils, and band cells) between adolescents with and without excess weight. Foschini
et al,26 when assessing 48 adolescents, 27 obese and 21
non-obese according to BMI, also reported no differences regarding the concentrations of leukocytes, neutrophils, lymphocytes, and monocytes. However, Zaldivar et al3 have
shown that obese children have a higher concentration of circulating leukocytes, particularly neutrophils, monocytes, and lymphocytes. Although the mechanisms of these increases are not well understood, it is known that child and adult obesity is associated with increased levels of circulating cytokines such as interleukin-6 (IL-6) and tumor necrosis factor alpha (TnF-±), and may contribute to an elevation in the number of circulating leukocytes.26
Moreover, Foschini et al.26 found a higher concentration
of platelets in obese adolescents, as well as higher levels of platelets in adolescents with excess body fatt.
Platelet activation and aggregation are the main processes in the pathophysiology of cardiovascular disease. Mean platelet volume (MPV), responsible for platelet activation, emerges as a new risk marker for atherothrombosis.26
In a study of 38 boys and girls, aged 6 to 18 years old, the authors found an overall increase in total leukocyte count (p=0.011) in the group with excess weight. Increases in the number of monocytes (p=0.008) were also observed in the same group. In the present study, the increase in the
number of leukocytes was demonstrated in the group of adolescents with excess body fat and a negative correlation of monocytes with BMI was observed (r=-0.166, p=0.001). As for the number of eosinophils and lymphocytes, there was no difference (p>0.05) between groups with and without excess weight in the study of Zaldivar et al,3 as well as in
the present study.
The increase in the number of leukocytes observed in adolescents with excess body fat is similar to the results that have been reported in adults. A high leukocyte count was found to be an independent risk factor for coronary heart disease, so that a reduction of 1 billion in the total leukocyte count may result in a 14% decrease in the risk of coronary heart disease.3
Bao et al27 suggested that girls may have higher overall
counts than boys. According to the study, women showed higher number of leukocytes and higher prevalence of elevated levels of segmented neutrophils.
Zaldivar et al3 also found a strong association between
body fat and leukocytes and a reasonable correlation between BMI and WBcs, and these results were also found in the present study.
The accumulation of fat in the abdominal region since adolescence is associated with hyperinsulinemia and elevated levels of certain inflammatory markers, such as IL-6, TnF-± and c-reactive protein (cRP) and WBcs, which are also associated with abdominal obesity. ganguli et al,28
in their study of Asian women, found a significant correlation of leukocytes with cRP and a strong associatiion between cRP levels and measures of adiposity, such as BMI, waist circumference, and body fat. There was also evidence of a positive correlation of cRP with components of metabolic syndrome, insulin, and HOMA-IR.29 This may explain the
results found in this study, regarding the strong correlation between WBcs and body fat, insulin, and HOMA-IR.
Based on the findings of this study, it was concluded that nutritional status is associated with an inflammatory condition and that adolescents with excess weight and/or body fat had a higher number of circulating WBcs.
Table 7 Prevalence of biochemical changes and white blood cells between genders. Viçosa, Mg, Brazil.
nutritional status according to gender
Biochemical variables Female n=196 Male n=166 Total (%) n=362 OR cI (95%) p Colesterol total
Adequate 33.9 66.1 47.8 1
Inadequate 66.1 33.9 52.2 2.81 1.79-4.4 <0.001
Band cells
<90 59.5 40.5 89.8 1
≥90 40.5 59.4 10.2 0.54 0.26-1.14 0.07
Segmented
<90 16.2 83.8 89.8 1
≥90 83.8 16.2 10.2 5.01 1.93-13.77 <0.001
Platelets
<90 29.7 70.3 89.8 1
≥90 70.3 29.7 10.2 2.16 0.98-4.82 0.03
Acknowledgements
To cAPES (coordenação de Aperfeiçoamento de Pessoal de nível Superior) for granting the Doctoral scholarships and the cnPq (conselho nacional de Desenvolvimento científico e Tecnológico) for the scientific initiation scholarship. To FAPEMIg (Fundação de Amparo à Pesquisa do estado de Minas gerais) and cnPq for funding the project. To Universidade Federal de Viçosa – UFV, for the availability of the resources required for the study.
Funding
This study was funded by Fundação de Amparo à Pesquisa do Estado de Minas gerais (FAPEMIg) and conselho nacional de Desenvolvimento científico e Tecnológico (cnPq).
Conlicts of interest
The authors declare no conflicts of interest.
References
1. Aquino EM, Heilborn ML, Bozon M, Almeida Mc, Araújo J, Menezes g. Adolescence and reproduction in Brazil: the heterogeneity of social proiles. Cad Saude Publica 2003;19 (Suppl 2):S377-88.
2. World Health Organization. nutrition in adolescence – issues and challenges for the health sector: issues in adolescent health and development. geneva: WHO; 2005.
3. Zaldivar F, McMurray Rg, nemet D, galassetti P, Mills PJ, cooper DM. Body fat and circulating leukocytes in children. Int J Obes (Lond) 2006;30:906-11.
4. Priore SE, Oliveira RM, Faria ER, Franceschini Sc, Pereira PF. nutrição e saúde na adolescência. Rio de Janeiro: Rubio; 2010. p. 70-148.
5. Silva IT, Sanches LB, Mello AP, Damasceno nR. Impact of c-Reactive protein on cardiovascular risk in adolescents. Arq Bras cardiol 2010;94:586-8.
6. Oliveira TR, cunha cF, Ferreira RA. characteristics of adolescents assisted in obesity outpatient service: know them to intervene. J Brazilian Soc Food nutr 2010;35:19-37. 7. Fonseca-Alaniz MH, Takada J, Alonso-Vale MI, Lima FB. The
adipose tissue as a regulatory center of metabolism. Arq Bras Endocrinol Metab 2006;50:216-29.
8. Lopes HF. Hypertension and inlammation: contribution of obesity. Rev Bras Hipertens 2007;14:239-44.
9. gonzález-Juanatey JR, Paz FL, Eiras S, Teijeira-Fernández E. Adipokines as novel cardiovascular disease markers. Pathological and clinical considerations. Rev Esp cardiol 2009;62 (Suppl 2):9-16.
10. noronha JA, Medeiros cc, cardoso AS, gonzaga nc, Ramos AT, Ramos AL. c-reative protein and its relation to high blood pressure in overweight or obese children and adolescents. Rev Paul Pediatr 2013;31:331-7.
11. Guyton AC, Hall JE. Tratado de isiologia médica. 11th ed. HY -PERLInK “http://www.infoescola.com/citologia/leucocitos/” de Janeiro: Elsevier; 2006.
12. Veronelli A, Laneri M, Ranieri R, Koprivec D, Vardaro D, Paganelli M et al. White blood cells in obesity and diabetes: effects of weight loss and normalization of glucose metabolism. Diabetes care 2004;27:2051-2.
13. Lima WA, glaner MF. Body fat topography as a predictor of an increase in blood lipids. RBM 2009;66:3-9.
14. De Onis M, Onyango AW, Borghi E, Siyam A, nishida c, Siekmann J. Development of a WHO growth reference for school-aged children and adolescents. Bull World Health Organ 2007;85:660-7. 15. Barbosa KB. consumo alimentar e marcadores de risco para a
síndrome metabólica em adolescentes do sexo feminino: comparação entre instrumentos de inquérito dietético [master’s thesis]. Viçosa (Mg): UFV; 2006.
16. Lohman Tg. Assessing fat distribuition. In: Lohman Tg, editor. Advances in body composition assessment: current issues in exercise science. Illinois: Human Kinects; 1992. p. 57-63. 17. Bioclin [homepage]. Manual de instruções: ácido úrico líquido
[cited 2013 jan. 3]. Available at: www.bioclin.com.br/iuso/ AcidoUrico.pdf.
18. Sociedade Brasileira de cardiologia. I Diretriz de Prevenção da Aterosclerose na Infância e na Adolescência. Arq Bras cardiol 2005;85 (Suppl 6):15-9.
19. American Diabetes Association. Diagnosis and classiication of diabetes mellitus. Diabetes care 2006;29 (Suppl. 1):S43-8. 20. Sociedade Brasileira de cardiologia. VI Diretrizes Brasileiras de
Hipertensão – capítulo 2: diagnóstico e classiicação. Rev Bras Hipertens 2010;17:11-7.
21. Ministério da Saúde, Ministério do Planejamento, Orçamento e Gestão, Instituto Brasileiro de Geograia e Estatística (IBGE). Pesquisa de Orçamentos Familiares 2008-2009: antropometria e estudo nutricional e crianças, adolescentes e adultos no Brasil. Rio de Janeiro: Ministério da Saúde; 2010.
22. Pereira PF, Serrano HM, carvalho gQ, Lamounier JA, Peluzio Mc, Franceschini Sc et al. Waist and waist-to-height ratio: useful to identify the metabolic risk of female adolescents? Rev Paul Pediatr 2011;29:372-7.
23. gontijo cA, Faria ER, Oliveira RM, Priore SE. Metabolic syndrome among adolescents assisted by a healthcare program in Viçosa, Minas gerais state, Brazil. Rev Bras cardiol 2010;23:324-33. 24. Baruzzi Ac, nussbacher A, Lagudis S, Souza JA. Trombose
venosa profunda. Proilaxia. Arq Bras Cardiol 1996;67:215-8. 25. Dâmaso A. Obesidade. 2nd ed. Rio de Janeiro: guanabara
Koogan; 2009.
26. Foschini D, Santos RV, Prado WL, Piano A, Lofrano Mc, Martins Ac et al. Platelet and leptin in obese adolescents. J Pediatr (Rio J) 2008;84:516-21.
27. Bao W, Dalferes ER Jr, Srinivasan SR, Webber LS, Berenson gS, normative distribution of complete blood count from early childhood through adolescence: the Bogalusa Heart Study. Prev Med 1993;22:825–37.
28. ganguli D, Das n, Saha I, Sanapala KR, chaudhuri D, ghosh S, Dey S. Associação entre marcadores inlamatórios e fatores de risco cardiovascular em mulheres de Kolkata, W.B, Índia. Arq Bras cardiol 2011; 96:38-46.