Jorge Luis Gonçalves(a) Raqueli Viapiana(a)
Carlos Eduardo Saraiva Miranda(b) Álvaro Henrique Borges(c)
Antônio Miranda da Cruz Filho(d)
(a) Master in Endodontics; (b)PhD, Assistant Professor – School of Dentistry, University of Ribeirão Preto (UNAERP), Ribeirão Preto, SP, Brazil.
(c) PhD, Assistant Professor, School of Dentistry of University of Cuiabá (UNIC), Cuiabá, MT, Brazil.
(d) PhD, Assistant Professor, Department of Restorative Dentistry, School of Dentistry, University of São Paulo (USP), Ribeirão Preto, SP, Brazil.
Corresponding author: Antônio Miranda da Cruz Filho Praça Pompilio Conceição, casa 10, Residencial Vila Aliança, Jd. Botânico Ribeirão Preto - SP - Brazil
CEP: 14021-594 E-mail: [email protected]
Received for publication on Jan 15, 2010 Accepted for publication on Apr 25, 2010
Evaluation of physico-chemical
properties of Portland cements and MTA
Abstract: The purpose of this study was to evaluate the hydrogenionic potential and electrical conductivity of Portland cements and MTA, as well as the amount of arsenic and calcium released from these materi-als. In Telon molds, samples of each material were agitated and added to plastic lasks containing distilled water for 3, 24, 72 and 168 h. The results were analyzed with a Kruskal-Wallis non-parametric test for global comparisons and a Dunn-Tukey test for pairwise comparisons. The results revealed no signiicant differences in the pH of the materials (p > 0.05). The electrical conductivity of the cements were not statisti-cally different (p > 0.05). White non-structural cement and MTA BIO re-leased the largest amount of calcium ions into solution (p < 0.05), while arsenic release was insigniicant in all of the materials (p > 0.05). The re-sults indicated that the physico-chemical properties of Portland cements and MTA were similar. Furthermore, all materials produced an alkaline environment and can be considered safe for clinical use because arsenic was not released. The electrical conductivity and the amount of calcium ions released into solution increased over time.
Descriptors: Endodontics; Mineral trioxide aggregate; Root canal illing materials.
Introduction
In the 1990’s, a research team led by Professor Mahmoud Torabi-nejad developed mineral trioxide aggregate (MTA), a novel retroilling material.1 A patent for MTA was granted in 1999,2 and the material was
commercialized as ProRoot MTA. According to the manufacturer, this
material is composed of 50-75% calcium oxide and 15-25% silicium di-oxide.3,4 Studies revealed that MTA displays similar behavior to type 1
ordinary Portland cement5 with bismuth oxide,6,7 which is added to
im-prove the radiopaciier properties of the material.8
In dentistry, Portland cements have been studied extensively as a sub-stitute for MTA. Due to the presence of iron, the materials can be white or gray in color.7,8 White Portland cement is classiied as either
struc-tural or non-strucstruc-tural cement.9 Non-structural cement contains minor
amounts of clinker and gypsum (50-74%), which alters the structural properties of the material. For example, clinker increases the resistance of the material and decreases its solubility.9 Portland cement and MTA
display similar antimicrobial activity,6 biocompatibility,4 sealing ability,
barri-er formation,12 dimensional stability13 and moisture
tolerance.14
Portland cement and MTA are rich in calcium oxide, which is converted to calcium hydroxide in aqueous solution.15 The dissociation of calcium and
hydroxyl ions increases the pH of the solution and promotes an unfavorable environment to bacterial growth.6 Alternatively, an increase in the pH and
calcium ion concentration improves biocompatibil-ity16 and promotes the action of cementoblasts,17
which can repair the material.12
Although the concentration of arsenic and other elements in MTA and Portland cements is low,18 the
effect of these chemicals is a concern for clinical ap-plications. To understand the physico-chemical pro-prieties of Portland cements and MTA, the amount of arsenic and calcium ions released from these ma-terials must be evaluated. Moreover, the change in pH over time and the effect on the properties of the materials must be understood. The aim of this work was to evaluate the pH, electrical conductivity and release of calcium ions and arsenic from Portland cements and MTA.
Material and Methods
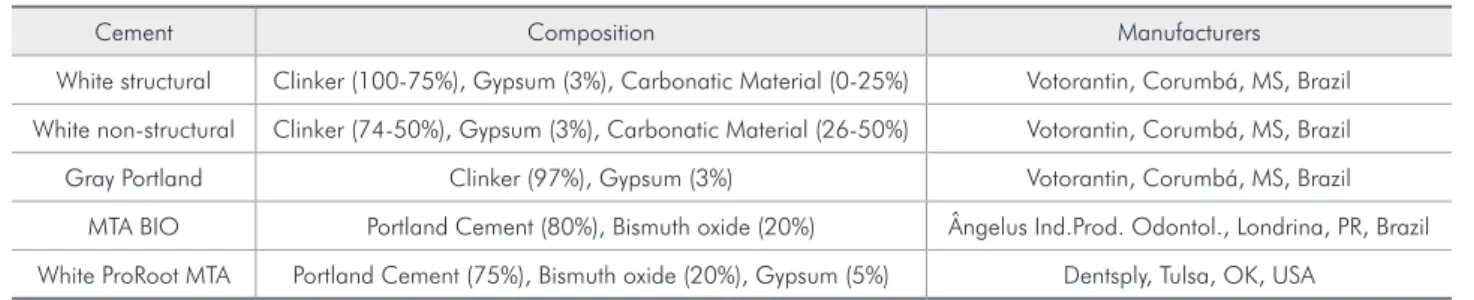
The materials used in this study are described in Table 1.
To establish the water/powder ratio, 3 g of ce-ment was weighed and a portion was added to 0.20 mL of distilled water to achieve the desired consistency. The amount of remaining powder was subtracted from the initial quantity. This procedure was repeated ive times for each material.
pH analysis
For each material, 5 samples with a thickness
of 1.5 mm and an inner diameter of 7.75 mm were analyzed. Each tube was sealed in a lask contain-ing 7.5 mL of distilled water. The pH was measured (PH 30 Sensor Corning; Corning Inc., New York, NY, USA) with a pH meter at 3, 24, 72, and 168 h of spatulation. During the experiment, the pH of each sample was analyzed in the plastic recipient without liquid substitution.
Electrical conductivity analysis
After the pH of the material was evaluated, the sample was retained in the plastic recipient and the electrical conductivity of the solution was measured. Thus, all 5 samples of each material were analyzed with a condutivitymeter (Marconi CA-150, Piraci-caba, SP, Brazil). The device was calibrated accord-ing to a calibration curve obtained from a solution of 1.412 µS/cm-1.
Analysis of calcium ion release
A total of 5 samples were analyzed for each type of material. Each tube was sealed in a lask contain-ing 7.5 mL of distilled water, and the amount of cal-cium released from the material was determined after 3, 24, 72, and 168 h of spatulation. The measure-ments were performed with an atomic absorption spectrometer (Perkin Elmer, Uberlingen, Germany) equipped with a hollow cathode calcium lamp. The following conditions were maintained: lamp cur-rent: 3 mA; fuel: acetylene; support: oxygen; stoi-chiometry: reducing; wavelength: 422.7 nm; slit: 0.2 nm. To prevent the interference of phosphates and alkaline metals, all glassware was prewashed with 5% nitric acid. A standard solution of 10 mg/ dL of calcium was diluted in 10% EDTA to obtain standard solutions. To calibrate the apparatus for
Table 1 - The composition of tested materials.
Cement Composition Manufacturers
White structural Clinker (100-75%), Gypsum (3%), Carbonatic Material (0-25%) Votorantin, Corumbá, MS, Brazil White non-structural Clinker (74-50%), Gypsum (3%), Carbonatic Material (26-50%) Votorantin, Corumbá, MS, Brazil
Gray Portland Clinker (97%), Gypsum (3%) Votorantin, Corumbá, MS, Brazil
zero absorbency, 10% EDTA was used as a blank. The calcium concentration of the samples was deter-mined according to a calibration curve of solutions with known concentrations of calcium (0.025, 0.05, 0.1, 0.2, and 0.3 mg/dL).
Arsenic release
Excess solution from previous tests was diluted with HCl (Merck, Darmstadt, Germany), which lowered the pH to 2.0. The solution was acidiied to guarantee that arsenic was released in the form of arsenic III. For the atomic absorption spectrom-etry, the following operating conditions were main-tained: 3 psi of nitrogen at a low rate of 50 mL/ min, 10 mol/L of HCl at a low rate of 1 mL/min, 1% sodium borohydride in 1% sodium hydroxide solution at a low rate of 1 mL/min, sample low rate of 8 mL/min and an integration time of 90 s. Atom-ic absorption spectrophotometry was conducted at a wavelength 193.7 nm with a arsenic hollow cathode lamp, a slit width of 0.5, and an air-acetylene lame. Standard solutions with arsenic concentrations of 2.0, 4.0, 6.0, 8.0 and 10.0 µg/L were prepared from a solution of 10.0 µg/L arsenic trichloride in reagent grade water at a pH of 2.0. In total, 5 samples were analyzed at 4 different spatulation times.
Statistical analysis
The results were compared at each time point by conducting a Kruskal-Wallis non parametric test
of global comparisons and a complementary Dunn-Tukey test of pairwise comparisons. A signiicance level of 5% was adopted in the statistical analysis.
Results
The average pH of each material is shown in Ta-ble 2. Signiicant differences in the pH of the mate-rials were not observed (p > 0.05). However, the pH at 3 h of immersion was statistically different from that of other time periods (p < 0.05). Alternative-ly, similar pHs were observed at other spatulation times (p > 0.05), as shown in Graph 1.
Table 3 presents the mean electrical conductiv-ity of the samples over time. The results indicated that the conductivity of the materials were not sta-tistically different (p > 0.05). However, at 168 h, a signiicant difference in conductivity was observed (p < 0.05). Alternatively, at 24 and 72 h, differences were not observed between samples (p > 0.05), but these results were different from those obtained at 3 h (p < 0.05) (Graph 2).
Table 4 presents the average amount of calcium released from the materials. The results indicated that the amount of calcium released from white non-structural was statistically similar to that of MTA BIO (p > 0.05), but was different (p < 0.05) from that of the other materials. Likewise, ProRoot MTA, white structural and gray Portland released similar amounts of calcium (p > 0.05). At 168 h, the concentration of calcium released from the
materi-Table 2 - The average pH of the materials (α = 0.05).
Material White Non-Structural ProRoot MTA MTA BIO White Structural Gray Portland
Mean ± SD 11.63 ± 0.44 11.80 ± 0.14 11.81 ± 0.11 11.94 ± 0.14 12.00 ± 0.17
Table 3 - Electrical conductivity (µS/cm-1) of the materials (α = 0.05).
Material White Non-Structural ProRoot MTA MTA BIO White Structural Gray Portland
Mean ± SD 1,677.5 ± 1,563.4 1,388.7 ± 263.5 1,294.4 ± 407.3 1,603.4 ± 553.6 1,394.8 ± 486.8
Table 4 - Amount of calcium ions released (mg/dL) from the materials (α = 0.05).
Material White Non-Structural ProRoot MTA MTA BIO White Structural Gray Portland
als was different (p < 0.05) than at other time peri-ods, which were similar to each other (p > 0.05), as shown in Graph 3.
Atomic absorption spectrometry and hydride generation were used to determine the amount of arsenic released from the materials. The spectrom-eter possessed a maximum and minimum detection limit, which speciies the range of concentrations that produce a linear response. For the chosen spec-trometer, the detection interval ranged from 2 to 10 µg/L. The equipment used to quantify the release of arsenic indicated that the concentration of arsenic released from the samples was below the lower limit
of detection. Thus, the concentration of arsenic re-leased from the materials was less than 2 µg/L.
Discussion
Because a speciic normative for retroilling ma-terials has not yet been developed,17 the
aforemen-tioned tests were conducted according to speciica-tion No. 57 from the ANSI/ADA19 (2000) for illing
materials. During clinical use, retroilling materials are often in close contact with periodontal tissues and are used under the same conditions as illing materials; thus, this standard was assumed to be ap-plicable to the materials under investigation.8
How-ever, to limit the amount of cement used in the anal-ysis, the volume of the samples was reduced by 80%, and the quality of the results was not affected.20
The water/powder ratio was determined to verify the exact quantity of powder that should be incor-porated into a speciic volume of water. Portland cement is designed for civil engineering, and a spe-ciic ratio for its use in dentistry has not been es-tablished. Thus, Portland cement is often used in the same ratio as MTA cements.21 According to the
MTA cement manufacturer, the recommended ratio is 3:1,22 which results in a luid that has a
consis-tency similar to that of soup.17 Thus, the
manufac-turer suggests that excess powder can be added to the mixture. The effect of additional powder on the physico-chemical characteristics of the cement is
Graph 2 - Electrical conductivity (µS/cm-1) variation
ac-cording to period of time.
3 24 Hours 72 168 4,500 2,500 3,000 3,500 4,000 E lectrical co ndu ctiv ity ( µ S/ cm − 1) 2,000 1,500 1,000 500 0 White Structural White Non-Structural Gray Portland MTA BIO ProRoot MTA
Graph 3 - Calcium ions released (mg/dL) according to pe-riods of time.
3 24 Hours 72 168 401.5 251.5 301.5 351.5 C alciu m io ns releas ed (mg/ dL ) 201.5 151.5 101.5 51.5 1.5 White Structural White Non-Structural Gray Portland MTA BIO ProRoot MTA 3 24 Hours 72 168 12.2 12 pH 11.8 11.6 11.4 11.2 11 White Structural White Non-Structural Gray Portland MTA BIO ProRoot MTA
unknown. The results indicated that cements with different powder/liquid ratios were not statistically different (p < 0.05). Moreover, the chemical compo-sition of Portland cements and MTA are similar.5,6,7
Distilled water at a pH of 5.6 was used to evalu-ate the pH of the mevalu-aterials. During the irst 3 h, the samples were strongly alkaline, and the pH remained high until the end of the experiment. Portland ce-ments and MTA are rich in calcium ions, which are converted to calcium hydroxide upon contact with the water. Calcium hydroxide dissociates into cal-cium and hydroxyl ions, which increases the pH of the solution.13 Thus, the variation in the
concen-tration of calcium hydroxide leads to different pH values. Gray and white structural Portland cements contain large amounts of clinker; thus, these materi-als possessed a high pH.9 Moreover, soluble forms
of calcium such as calcium oxide are readily trans-formed into calcium hydroxide, which increases the alkalinity of the solution.13,23 However, the pH
sta-bilizes over time as the solution becomes saturated with calcium hydroxide.24
Similar results were observed in studies conduct-ed by Islam et al.21 (2006). Speciically, the pH of
gray and white Portland cements was higher than the pH of gray and white MTA. Alternatively, Du-arte et al.13 (2003) obtained contradictory results
because the solution was removed and fresh water was added after each pH measurement. As a result, the pH of the solution decreased due to the addition of distilled water, and longer periods of time were required to achieve re-equilibration.
Electrical conductivity is directly related to the concentration of ions in the medium, which is pro-portional to the solubility of the material.23,24 The
results indicated that the concentration of ions in solution increased as the solubility of the sample in-creased, which led to higher conductivity values. In general, this phenomena was observed in all of the cements. During the sample solubilization process, the components that were the most soluble in water were the irst to release ions into solution. Samples components solubilize at different rates and possess different solubility products (Kps).24 Because of the
complexity of these materials, the ionic equilibrium that is established is equally complex. Moreover, the
common-ion effect is signiicant for calcium, which is the main species present in cement.24 The
solubili-ty of individual components increases as the contact time with the solvent increases; thus, the concentra-tion of ions and the electrical conductivity increases over time.24
According to the results, the conductivity of the cements were statistically similar (p > 0.05), sug-gesting that all samples were affected similarly by solvolysis. Moreover, the volume of solvent used in the test was insuficient (7.5 mL). Although the con-ductivity signiicantly increased over time, the elec-trical conductivity should eventually stabilize due to solution saturation.24 In this study, the solution was
not removed or exchanged once the samples were immersed; thus, the results obtained in this study were different from those obtained by Santos et al.23
(2005).
White non-structural cement is composed of many compounds that contain calcium. Moreover, this material is highly soluble due to the low concen-tration of clinker (50-74%). Thus, high concentra-tions of calcium ions are released upon contact with water.9 In the presence of water, clinker reacts with
other cement components, and is a strong hydraulic ligament. Therefore, the large amount of calcium re-leased from white non-structural cement is related to the low concentration of clinker.9 White
struc-tural cement is composed of 75-100% clinker and gypsum, while gray portland cement contains 100% clinker and gypsum.4,25
MTA BIO released signiicantly more calcium ions into solution than ProRoot MTA. Accord-ing to the manufacturer, MTA BIO contains 80% Portland cement, while ProRoot MTA contains only 75%.25,26 The larger quantity of Portland cement in
MTA BIO results in a higher concentration of clin-ker, which limits the solubility of the material. The main difference between MTA BIO and ProRoot is the concentration of gypsum, which is 5% higher in ProRoot.25,26 If gypsum (calcium sulfate) was not
present, cement would harden immediately upon contact with water.3,9 The increase in setting time
accor-dance with those of Duarte et al.13 (2003), which
in-dicated that MTA Ângelus contains higher amounts of Portland cement or other calcium-related com-pounds than ProRoot MTA. Moreover, Oliveira et al.26 (2007) showed that the calcium concentration
of MTA Ângelus was greater than that of ProRoot MTA. Thus, unlike the results of Duarte et al.13
(2003), these authors found that the amount of ions released from the cement could be attributed to the setting time of the material as well as the original concentration of calcium.
At 3, 24 and 72 h of spatulation, the average con-centration of calcium in solution was similar. How-ever, at 168 h, the amount of calcium released from the materials was statistically different. The differ-ences in calcium concentration at extended periods of time may be attributed to the solubility of the ma-terial and the concentration of clinker.9 Individual
components of the materials solubilize at different rates because each compound possesses a different solubility product (Kps).24 The results indicated that
solubilization was slow during the irst 72 h; how-ever, solubility signiicantly increased after extended periods of time. The high solubility and calcium concentration observed at 168 h can be attributed to
the length of contact time between the material and the solvent.24
The concentration of trivalent arsenic (As III) was determined because it is the most toxic form of arsenic.18 In Brazil, resolution 20 of the National
Council of the Environment indicates that the maxi-mum arsenic concentration of water for human con-sumption is 0.05 mg/L.27 To quantify the amount
of arsenic released from the materials, atomic ab-sorption spectrometry with hydride generation was employed. The equipment used in this study could accurately quantify the amount of arsenic at concen-trations between 2 and 10 µg/L. In all of the materi-als analyzed, the spectrometer could not determine the arsenic content, indicating that the concentra-tion of this metal was below 2 µg/L, which is safe for human consumption.27
Conclusions
In spite of several limitations, the results of this
in vitro study revealed that the physico-chemical
proprieties of Portland cements and MTA were sim-ilar. However, further biocompatibility studies on Portland cements should be conducted before clini-cal use.
References
1. Torabinejad M, Chivian N. Clinical applications of mineral trioxide aggregate. J Endod. 1999 Mar;25(3):197-206. 2. Camilleri J, Pitt Ford TR. Mineral trioxide aggregate: a review
of the constituents and biological properties of the material. Int Endod J. 2006 Oct;39(10):747-54.
3. Dammaschke T, Gert HUV, Zuchner H, Schäfer E. Chemical and physical surface and bulk material characterization of white ProRoot MTA and two Portland cements. Dent Mater. 2005 Aug;21(8):731-8.
4. Camilleri J, Montesin FE, Di Silvio L, Pitt Ford TR. The chem-ical constitution and biocompatibility of accelerated Portland cement for endodontic use. Int Endod J. 2005 Nov;38(11):834-42.
5. Wucherpfennig AL, Green DB. Mineral trioxide vs. Port-land cement: two compatible filling materials. J Endod. 1999 Apr;25(4):308.
6. Estrela C, Bammann LL, Estrela C, Silva RS, Pécora JD. An-timicrobial and chemical study of MTA, Portland cement, Calcium Hidroxide Paste, Sealapex and Dycal. Braz Dent J. 2000 Jul;1(11):3-9.
7. Funteas UR, Wallace JA, Fochtman EW. A comparative analy-sis of Mineral Trioxide Aggregate and Portland cement. Aust Endod J. 2003 Apr;29(1):43-4.
8. Danesh G, Dammaschke T, Gert HUV, Zanbdiglari T, Schäfer E. A comparative study of selected properties of ProRoot mineral trioxide aggregate and two Portland cements. Int Endod J. 2006 Mar;39(3):213-9.
9. Associação Brasileira do Cimento Portland. Boletim técnico 106: guia básico de utilização do cimento Portland. São Paulo (SP): Associação Brasileira do Cimento Portland; 2002 Dez. 28 p.
10. Pereira CL, Cenci MS, Demarco FF. Sealing ability of MTA, Super EBA, Vitremer and amalgam as root-end filling materi-als. Braz Oral Res. 2004 Oct-Dec,18(4):317-21.
11. Bernabé PFE, Gomes-Filho JE, Rocha WC, Nery MJ, Otobo-ni-Filho JA, Dezan-Júnior E. Histological evaluation of MTA as a root-end filling material. J Endod. 2007 Oct;40(10):758-65.
13. Duarte MAH, Demarchi ACCO, Yamashita JC, Kuga MC, Fraga SC. pH and calcium ion release of 2 root-end filling ma-terials. Oral Surg Oral Med Oral Pathol Oral Radiol Endod. 2003 Mar;95(3):343-7.
14. Chong BS, Pitt Ford TR. Root-end filling materials: rationale and tissue response. Endod Top. 2005 Jul;11(1):114-30. 15. Holland R, Souza V, Nery MJ, Otoboni Filho JA, Bernabé
PFE, Dezan Jr E. Reaction of rat connective tissue to im-planted dentin tubes filled with Mineral Trioxide Aggregate or calcium hydroxide. J Endod. 1999 Mar;25(3):161-6. 16. Ding SJ, Kao CT, Shie MY, Hung CJ, Huang TH. The
physi-cal and cytologiphysi-cal properties of white MTA mixed with Na2HPO4 as an accelerant. J Endod. 2008
Jun;34(6):748-51.
17. Fridland M, Rosado R. Mineral trioxide aggregate (MTA) solubility and porosity with different water-to-powder ratios. J Endod. 2003 Dec;29(12):814-7.
18. Duarte MAH, Demarchi ACCO, Yamashita JC, Kuga MC, Fraga SC. Arsenic release provided by MTA and Portland ce-ment. Oral Surg Oral Med Pathol Oral Radio Endod. 2005 May;99(5):648-50.
19. American National Standards Institute/American Dental As-sociation. Specification no. 57: endodontic sealing material. Chicago (IL): ADA Publishing: 2000.
20. Carvalho-Junior JR, Correr-Sobrinho L, Correr AB, Sinhoreti MA, Consani S, Sousa Neto MD. Solubility and dimensional
change after setting of root canal sealers: a proposal for small-er dimensions of test samples. J Endod. 2007 Sep;33(9):1110-6.
21. Islam I, Kheng Chng H, Jin Yap AU. Comparison of the physi-cal and mechaniphysi-cal properties of MTA and Portland cement. J Endod. 2006 Mar;32(3):193-7.
22. Torabinejad M, Hong CU, McDonald F, Pitt Ford TR. Physical and chemical properties of a new root-end filling material. J Endod. 1995 Jul;21(7):349-53.
23. Santos AD, Moraes JCS, Araújo EB, Yukimitu K, Valério Filho WV. Physico-chemical properties of MTA and a novel experimental cement. Int Endod J. 2005 Jul;38(7):443-7. 24. Masterton WL, Hurley CN. Chemistry: principles &
reac-tions. 5th ed. Belmont: Brooks Cole; 2003. 756 p.
25. Ferris DM, Baumgartner JC. Perforation repair compar-ing two types of mineral trioxide aggregate. J Endod. 2004 Jun;30(6):422-4.
26. Oliveira MG, Xavier CB, Demarco FF, Pinheiro ALB, Costa AT, Pozza DH. Comparative chemical study of MTA and Portland cements. Braz Dent J. 2007 Jan;18(1):3-7.