Occlusion
João César Guimarães Henriques(a)
Alfredo Júlio Fernandes Neto(a) Guilherme de Araújo Almeida(b) Naila Aparecida de Godoi Machado(a)
Éverton Ribeiro Lelis(a)
(a) Department of Occlusion, Fixed Prosthodontics and Dental Materials, School of Dentistry, Federal University of Uberlândia, Uberlândia, MG, Brazil. (b) Department of Orthodontics, School of
Dentistry, Federal University of Uberlândia, Uberlândia, MG, Brazil.
Corresponding author:
Guilherme de Araújo Almeida Email: [email protected]
Received for publication on Aug 18, 2011 Accepted for publication on Oct 11, 2011
Cone-beam tomography assessment
of condylar position discrepancy
between centric relation and maximal
intercuspation
Abstract: The magnitude of occasional discrepancies between the cen-tric relation and maximal intercuspation positions remains a controver-sial subject. This study quantitatively evaluated the possible discrepan-cies in the condyle/mandibular fossa relationship between these positions using cone-beam computed tomography. Twenty young and asymptom-atic volunteers were distributed equally into normal occlusion and Angle Class I, II and III malocclusion groups. They were submitted to one to-mographic scan in maximal intercuspation and one in centric relation. Measurements were performed on lateral and frontal cuts of the patients’ temporomandibular joints, and the data collected were compared us-ing Student’s t test at a signiicance level of 5%. The results showed that there were no statistically signiicant differences between the centric rela-tion and maximal intercusparela-tion posirela-tions in young and asymptomatic patients with practically intact dentitions using cone-beam computed to-mography.
Descriptors: Temporomandibular Joint; Malocclusion; Cone-Beam Computed Tomography.
Introduction
Discrepancies between the centric relation (CR) and the maximal in-tercuspation (MI) positions and their therapeutic implications have been extensively debated.1-3 Opinions diverge greatly with regard to the clini-cal use of these maxillomandibular positions. Systematic literature re-views include authors in favor of an extensive use of CR in the planning of occlusal rehabilitation therapy and orthodontics,1,3 alongside others who suggest an individual analysis of each clinical situation when de-termining which maxillomandibular relationship should be considered correct.4,5 Despite the different opinions about how and when to use either of these two maxillomandibular positions, one point of relative acceptance among scientists is that most individuals in the population have discrepancies between CR and MI,4 mainly symptomatic individu-als and those with Class II and III malocclusions.6-11 Among the meth-odological resources most widely used in studies comparing variations between maxillomandibular relations are articulator casts and conven-tional radiography.1,2,10 These studies, in several cases, have established
statistically signiicant differences between the two positions. In other studies, however, the differences found between the two positions showed little sta-tistical signiicance.11 The goal of the present study was to take advantage of the precision of cone-beam computed tomography technology to measure the condylar variations found between the CR and MI positions in young, asymptomatic patients with full dentitions, who present different occlusion pat-terns.
Methodology
Twenty young adult volunteers took part in this study after approval by the Ethics Committee of the Federal University of Uberlândia (n. 127). The crite-ria for inclusion in the research were as follows:
• age 18 to 25,
• both sexes,
• all healthy teeth,
• no symptoms and
• no previous orthodontic treatment or occlusal adjustments.
The twenty patients were divided equally into four groups of ive participants each. One group consisted of individuals with normal occlusion, whereas the other three groups consisted of individ-uals with Angle Classes I, II, and III malocclusions, respectively. The research procedures were divided into two main sections.
Section 1
Initially, a clinical survey was carried out to identify the occlusal features of each patient. Ma-nipulation of the mandible was performed and an anterior deprogramming device (JIG)12 was used to record the centric relation position. This device was fabricated using chemically activated acrylic resin (CAAR) (Duralay Reliance; Dental Mfg. Co., Chi-cago, USA). The irst contact between the maxillary and mandibular arches corresponding to the tem-poromandibular joint in CR was identiied for the purpose of maintaining a CR position during the to-mographic examination. Next, the palatal acclivity of the JIG was ground carefully until this irst oc-clusal contact was obtained. A standardized channel
leading to the CR position was made with CAAR to be used as a stable and safe reference for the pa-tient’s occlusion during the CR tomography.
Section 2
This section was conducted by the same radiolo-gist and operator. Each of the 20 patients underwent two cone-beam computed tomographic examina-tions of the temporomandibular joints (TMJs), the irst in MI and the second in CR. Lateral and verti-cal cone beam scans were obtained with a NewTom 3G gantry tomographer (Quantitative Radiology, Verona, Italy). Ball-point pen marks standardized the patient’s head position during the two scans. For the irst scan, the patient was instructed to sta-bilize his/her occlusion in the maximal intercuspal position, whereas, for the second scan, the patient was instructed to open his/her mouth so that the operator could adjust the JIG in the upper central incisors. Primary reconstructions of the images were immediately performed by QRNNT software ver-sion 2.00, coupled to the NewTom 3G device.
Image selection and measurements
Following the same methodological sequence as that followed for the CR and MI scanning of the right and left TMJs, the radiologist acquired lateral and frontal cuts to obtain secondary reconstruc-tions. Four lateral cuts and four frontal cuts were placed side by side and received speciic ile names to be used during the CR/MI comparison performed for each patient. The cuts in each patient ile were named as follows:
• Right Lateral MI/Right Lateral CR,
• Left Lateral MI/Left Lateral CR,
• Right Frontal MI/Right Frontal CR, and
• Left Frontal MI/Left Frontal CR.
and its value was recorded. Reference line segment 3 was traced overlapping exactly half of line segment 2, and its value was also recorded. An angle tool was then used to form a 90° angle, which was then placed at a 45° angle to reference line 1. The an-gle’s vertex met the end of line segment 3 at a point named the middle point of reference. For future reference, the distance between the middle point of reference and the uppermost point of the condylar process was measured along reference line 4, which coincided with the vertical arrow of the angle tool. The distance between the uppermost point of the condyle and the closest internal point of the mandib-ular fossa overlapping the vertical arrow of the an-gle tool was then measured. This measurement was named “superior”. Another measurement, named “anterior,” was obtained in a similar fashion, except for an anterior variation of 45° in relation to the ver-tical arrow, and a inal measurement, named “pos-terior,” was obtained in the same way, except for a posterior variation of 45° in relation to the vertical arrow (Figure 1). After these three measurements of the Right Lateral CR were recorded, the Right Lat-eral MI cut was performed for comparison. For this purpose, the operator identiied the same points and
traced the same reference lines accurately to conirm that the same measurements were obtained as those obtained in the previous comparable cut. Next, the same three condyle-to-fossa measurements – supe-rior, antesupe-rior, and posterior – were recorded. The entire measuring process was conducted identically on the lateral cuts of the left side.
Measuring of the frontal cuts started with the Right Frontal CR cut. Initially, the most medial and lateral points of the condylar head were identiied. The line measuring tool was used to connect these points to produce an alpha line. A segment line was then traced overlapping the alpha line up to exactly half of its length, and this line was termed the beta line segment. A point at the end of the beta line seg-ment was named the middle point of reference for the frontal cut. Again, the angle tool was used to form a 90° angle, which was then placed at a 45° angle to the alpha line. The angle’s vertex was ad-justed to meet the middle point of reference, and then the “superior,” “medial,” and “lateral” mea-surements were obtained in the same manner as the “superior,” “anterior,” and “posterior” measure-ments were obtained in the lateral cuts, as described previously. The distance between the middle point of reference and the uppermost point of the condyle head along the vertical arrow of the angle tool
po-Figure 2 - Frontal view of the lateral, superior and medial distances used to assess the condyle/mandibular fossa re-lationship.
sitioned at 90° was measured to serve as future ref-erence for measurement checking, just as refref-erence line segment 3 served as a reference in the lateral cut measuring procedure. This measurement was named the gamma line segment (Figure 2). All mea-surement values were duly recorded. Assessment of the Right Frontal MI cut was then performed by the same examiner in the same way as previously per-formed for the CR cut, to allow direct comparison of the corresponding measurements. In order to val-idate the comparison, the alpha, beta, and gamma line measurements should necessarily present the same values in the two cuts, thus conirming the correct identiication of the same middle points of
reference in both procedures. Twenty days after the irst measurement session and before the statistical analysis was performed, an intra-examiner method-ological error test was conducted by selecting and repeating two measurements in ive randomly se-lected patients. This test conirmed the reliability of the results using Student’s t-test set at p > 0.05 (mea-surement 1: p = 0.0374 / mea(mea-surement 2: p = 1.000). Finally, the data were submitted to statistical analy-sis using Student’s t-test (p > 0.05).
Results
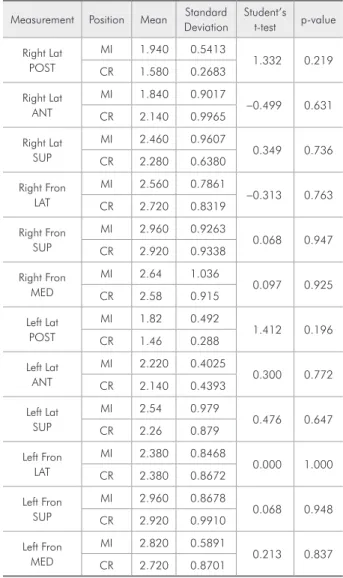
The four lateral cuts provided 12 measurements, and the four frontal cuts also provided 12 mea-Table 2 - Comparison of the mean measurements (mm) obtained for patients with normal occlusion in the MI and CR positions. Student’s t-test (p > 0.05).
Measurement Position Mean DeviationStandard Student’s t-test p-value
Right Lat POST
MI 1.940 0.5413
1.332 0.219 CR 1.580 0.2683
Right Lat ANT
MI 1.840 0.9017
-0.499 0.631 CR 2.140 0.9965
Right Lat SUP
MI 2.460 0.9607
0.349 0.736 CR 2.280 0.6380
Right Fron LAT
MI 2.560 0.7861
-0.313 0.763 CR 2.720 0.8319
Right Fron SUP
MI 2.960 0.9263
0.068 0.947 CR 2.920 0.9338
Right Fron MED
MI 2.64 1.036
0.097 0.925 CR 2.58 0.915
Left Lat POST
MI 1.82 0.492
1.412 0.196 CR 1.46 0.288
Left Lat ANT
MI 2.220 0.4025
0.300 0.772 CR 2.140 0.4393
Left Lat SUP
MI 2.54 0.979
0.476 0.647 CR 2.26 0.879
Left Fron LAT
MI 2.380 0.8468
0.000 1.000 CR 2.380 0.8672
Left Fron SUP
MI 2.960 0.8678
0.068 0.948 CR 2.920 0.9910
Left Fron MED
MI 2.820 0.5891
0.213 0.837 CR 2.720 0.8701
Table 1 - Comparison of mean measurements (mm) ob-tained for all groups in the MI and CR positions (n = 20). Student’s t-test (p > 0.05).
Measurement Position Mean DeviationStandard Student’s t-test p-value
Right Lat POST
MI 1.87 0.512
-0.105 0.917 CR 1.89 0.684
Right Lat ANT
MI 1.915 0.9354
-0.235 0.815 CR 1.980 0.8082
Right Lat SUP
MI 2.315 0.7869
-0.208 0.836 CR 2.365 0.7315
Right Fron LAT
MI 2.090 0.9002
-0.225 0.823 CR 2.155 0.9254
Right Fron SUP
MI 2.47 0.838
-0.125 0.901 CR 2.51 0.930
Right Fron MED
MI 2.520 0.9860
-0.515 0.609 CR 2.690 1.0978
Left Lat POST
MI 1.980 0.6296
0.464 0.645 CR 1.890 0.5973
Left Lat ANT
MI 2.015 0.9304
0.227 0.822 CR 1.950 0.8829
Left Lat SUP
MI 2.565 0.8113
0.039 0.969 CR 2.555 0.8056
Left Fron LAT
MI 2.26 0.741
0.127 0.899 CR 2.23 0.749
Left Fron SUP
MI 2.82 0.827
0.073 0.942 CR 2.80 0.899
Left Fron MED
MI 2.84 0.915
surements, for a total of 24 measurements for each patient. The results show that 95.4% of the 240 pairs of measurements used for direct comparison between MI and CR were different. The means ob-served for the left and right sides of the TMJ in the entire research sample and also in each individual group (MI or CR) were compared using Student’s t-test. There were no statistically signiicant differ-ences between the two positions (p > 0.05) (Tables 1 through 5).
Discussion
Much of the investigative work aiming at deter-mining the quantitative discrepancies between the
CR and MI maxillomandibular positions was based on different conceptions of centric relation, registra-tion techniques and methodologies used to estimate the reproducibility of the condyle/glenoid fossa rela-tionship, either through articulators that do not take into account neither the presence of TMJ soft tissue nor its anatomical variability, or by means of radio-graphs obtained under varying degrees of magnii-cation and restricted to the two-dimensional plane. The limitations of these methods used to examine TMJ anatomy are subject to much controversy and debate in scientiic circles, warranting further clari-ication.1,2,4
The introduction of cone-beam computerized Table 3 - Comparison of the mean measurements (mm)
ob-tained for Angle Class I patients, in the MI and CR positions. Student’s t-test (p > 0.05).
Measurement Position Mean DeviationStandard Student’s t-test p-value
Right Lat POST
MI 1.820 0.5718
0.524 0.614 CR 1.640 0.5128
Right Lat ANT
MI 1.680 0.6458
-0.762 0.468 CR 2.000 0.6819
Right Lat SUP
MI 2.360 0.7403
-0.269 0.795 CR 2.480 0.6686
Right Fron LAT
MI 2.080 0.7981
-0.121 0.907 CR 2.140 0.7701
Right Fron SUP
MI 2.660 0.5505
0.367 0.723 CR 2.540 0.4827
Right Fron MED
MI 2.860 0.9397
0.155 0.881 CR 2.760 1.0922
Left Lat POST
MI 1.960 0.6269
0.202 0.845 CR 1.880 0.6261
Left Lat ANT
MI 1.540 0.8473
-0.128 0.902 CR 1.600 0.6205
Left Lat SUP
MI 2.84 0.727
0.581 0.577 CR 2.60 0.570
Left Fron LAT
MI 2.56 0.456
0.553 0.595 CR 2.42 0.335
Left Fron SUP
MI 3.060 0.6427
0.414 0.690 CR 2.880 0.7294
Left Fron MED
MI 2.880 1.2215
0.026 0.980 CR 2.860 1.1929
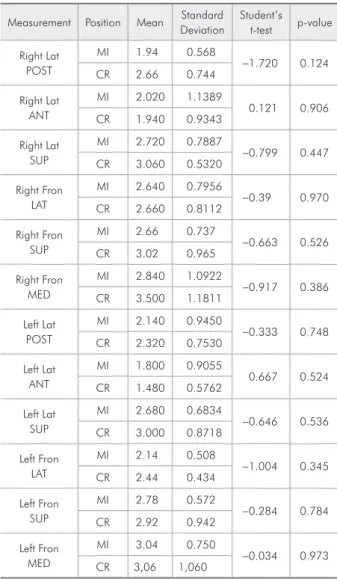
Table 4 - Comparison of the mean measurements (mm) obtained for Angle Class II patients, in the MI and CR posi-tions. Student’s t-test (p > 0.05).
Measurement Position Mean DeviationStandard Student’s t-test p-value
Right Lat POST
MI 1.94 0.568
-1.720 0.124 CR 2.66 0.744
Right Lat ANT
MI 2.020 1.1389
0.121 0.906 CR 1.940 0.9343
Right Lat SUP
MI 2.720 0.7887
-0.799 0.447 CR 3.060 0.5320
Right Fron LAT
MI 2.640 0.7956
-0.39 0.970 CR 2.660 0.8112
Right Fron SUP
MI 2.66 0.737
-0.663 0.526 CR 3.02 0.965
Right Fron MED
MI 2.840 1.0922
-0.917 0.386 CR 3.500 1.1811
Left Lat POST
MI 2.140 0.9450
-0.333 0.748 CR 2.320 0.7530
Left Lat ANT
MI 1.800 0.9055
0.667 0.524 CR 1.480 0.5762
Left Lat SUP
MI 2.680 0.6834
-0.646 0.536 CR 3.000 0.8718
Left Fron LAT
MI 2.14 0.508
-1.004 0.345 CR 2.44 0.434
Left Fron SUP
MI 2.78 0.572
-0.284 0.784 CR 2.92 0.942
Left Fron MED
MI 3.04 0.750
tomography, a reliable and affordable three-dimen-sional diagnostic tool, created the possibility of faithfully reproducing any anatomical condition of the craniofacial complex.11 It is well known that spa-tial variations in the position of the condyle relative to the mandibular fossa in the RC and MI maxillo-mandibular positions are mostly very small – on the order of millimeters – and occur in approximately 90% of the entire population.4,5
Even though we used one of the most advanced imaging methods available for application in Den-tistry, the Ethics Committee of the Federal Univer-sity of Uberlândia determined that our sample be reduced to 20 individuals because of the exposure of
human subjects to X radiation.
In the present study, we compared each measure-ment mean found in the MI and RC positions, con-sidering the whole sample and individual groups. In most cases (95.4%), the mean measurement values were different (Tables 1 through 5). These results agree with those of several authors who recognize the existence of discrepancies between the two posi-tions (MI and RC)4,6-11 in more than 90% of indi-viduals.4 However, these differences were not statis-tically signiicant, in either the lateral or the frontal cuts. This may have occurred because the differenc-es between MI and CR are generally very small.4,5 In our study these differences may have been even smaller owing to the relatively higher accuracy of the imaging method we used, as compared to those used in several other studies, namely the methods of conventional radiographic examination and mod-els mounted on articulators.1,2 Some of these studies found statistically signiicant differences between the MI and RC positions.6-11
Other factors may also have contributed to the divergence observed between our results and those found in the literature.4,5. Our research sample con-sisted of young asymptomatic adults having all per-manent teeth (except third molars) and no periodon-tal disease, whereas other research was conducted with older patients displaying symptoms of TMD and missing teeth.
The clinical applicability of these maxilloman-dibular positions is also subject to widely differing opinions because of the existence of contradictory results in the literature.3-5
Many authors support the use of CR in occlu-sal rehabilitation therapy,3,11 since they consider it an easily reproducible reference position, and also in orthodontics,1,3 strongly advocating the need to plan any treatment by mounting study models on an articulator and performing diagnostic teleradiogra-phy, both using CR.
Several other authors are opposed to using CR in various oral rehabilitation procedures, on account of the conceptual differences observed throughout history regarding a true CR position, varied repro-ducibility rates, nearly negligible discrepancies be-tween the RC and MI positions, the lack of scientiic Table 5 - Comparison of the mean measurement (mm)
ob-tained for Angle Class III patients, in the MI and CR posi-tions. Student’s t-test (p > 0.05).
Measurement Position Mean DeviationStandard Student’s t-test p-value
Right Lat POST
MI 1.760 0.5225
0.288 0.780 CR 1.660 0.5727
Right Lat ANT
MI 2.120 1.2194
0.422 0.684 CR 1.840 0.8444
Right Lat SUP
MI 1.720 0.4147
0.332 0.748 CR 1.640 0.3435
Right Front LAT
MI 1.080 0.1789
-0.206 0.842 CR 1.100 0.1225
Right Front SUP
MI 1.60 0.543
0.165 0.873 CR 1.54 0.602
Right Front MED
MI 1.740 0.6465
-0.378 0.715 CR 1.920 0.8468
Left Lat POST
MI 2.000 0.5385
0.323 0.755 CR 1.900 0.4359
Left Lat ANT
MI 2.500 1.3134
-0.095 0.927 CR 2.580 1.3498
Left Lat SUP
MI 2.200 0.9460
-0.273 0.792 CR 2.360 0.9044
Left Front LAT
MI 1.940 1.0714
0.420 0.686 CR 1.660 1.0383
Left Front SUP
MI 2.460 1.2239
0.000 1.000 CR 2.460 1.1194
Left Front MED
MI 2.600 1.2042
evidence supporting the assumption that condylar position and orthodontic treatment may be related to TMDs, and the limitations of articulators to re-produce TMJ anatomy and function.3-5
Some authors, however, have reported more bal-anced views, admitting that both RC and MI may be used in oral rehabilitation according to each patient’s speciic situation. According to this view, extensive prosthetic restorations, occlusal adjust-ments, parafunction management, rehabilitation af-ter orthognathic surgery, unsatisfactory MI, TMD management, and orthodontic therapy of greater complexity would be indications for using CR. In contrast, less extensive oral rehabilitations, a stable MI position, the absence of signs and symptoms, and less complex orthodontic therapy would be in-dications for using MI.3-5
Based on the results of the present study, the latter approach seems to be a more logical choice. Despite the limitations previously discussed, the absence of symptoms and the relative similarity of results in our study sample suggest the existence of
a relative balance capable of preventing pathologic changes in the condyle/fossa relationship, a balance which could be maintained after low-complexity procedures.
Conclusions
Within the limitations of this study, it can be concluded that there were no signiicant condyle/ mandibular fossa relationship discrepancies be-tween the centric relation and the maximum inter-cuspation positions in asymptomatic patients with practically intact dentitions, using cone-beam com-puted tomography.
This study also found a high rate of variation in condyle position in both CR and MI, even though the measurement differences were statistically in-signiicant. The fact that our sample consisted of young, asymptomatic individuals with intact den-tition suggests the existence of a range of adaptive possibilities for the condyle/articular fossa relation-ship compatible with a balanced condition and nor-mal function in these patients.
References
1. Utt TW, Meyers CE Jr, Wierzba TF, Hondrum SO. A three-dimensional comparison of condylar position changes between centric relation and centric occlusion using the mandibular position indicator. Am J Orthod Dentofacial Orthop. 1995 Mar;107(3):298-308.
2. Hidaka O, Adachi S, Takada K. The difference in condylar position between centric relation and centric occlusion in pre-treatment japanese orthodontic patients. Angle Orthod. 2002 Aug;72(4):295-301.
3. Wood GN. Centric relation and the treatment position in rehabilitating occlusions: a physiologic approach. Part II: the treatment position. J Prosthet Dent. 1988 Jul;60(1):15-8. 4. Keshvad A, Winstanley RB. An appraisal of the literature on
centric relation. Part III. J Oral Rehabil. 2001 Jan;28(1):55-63.
5. Carlsson GL. Insights into occlusal problems through the use of centric relation procedures. Part two. Northwest Dent. 2007 Mar-Apr;86(2):31-4,37, 39.
6. Weffort SY, de Fantini SM. Condylar displacement between centric relation and maximum intercuspation in symptom-atic and asymptomsymptom-atic individuals. Angle Orthod. 2010 Sep;80(5):835-42.
7. Afzal A, Shameem A. Comparison of condylar positions in cen-tric relation and cencen-tric occlusion in pre-treatment malocclu-sion cases. J Coll Physicians Surg Pak. 2005 Oct;15(10):620-3. 8. He SS, Deng X, Wamalwa P, Chen S. Correlation between
centric relation, maximum intercuspation discrepancy and temporomandibular joint dysfunction. Acta Odontol Scand. 2010 Nov;68(6):368-76.
9. Fantini SM, de Paiva JB, Neto JR, Dominguez GC, Abrão J, Vigorito JW. Increase of condylar displacement between cen-tric retation and maximal habitual intercuspation after occlu-sal splint therapy. Braz Oral Res. 2005 Jul-Sep;19(3):176-82 10. Deng x, Wan Z, He SS, Wamalwa P, Chen S, Zhang ZY. [The
centric relation-maximum intercuspation discrepancy in adult angle’s class II pretreatment patients]. West China J Stomatol. 2011 Feb;29(1):48-52. Chinese.
11. Ikeda K, Kawamura A, Ikeda R. Assessment of optimal condylar position in the coronal and axial planes with lim-ited cone-beam computed tomography. J Prosthodont. 2011 Aug;20(6):432-8.