Association of a PIT1 gene polymorphism with growth hormone mRNA levels
in pig pituitary glands
Maurício Machaim Franco
1,2, Robson Carlos Antunes
1, Katiana Mello de Oliveira
1, Cícero Donizete
Pereira
1, Fernando Henrique Biase
1, Francis de Morais Franco Nunes
3and Luiz Ricardo Goulart
11
Universidade Federal de Uberlândia, Instituto de Genética e Bioquímica, Laboratório
de Genética Molecular, Uberlândia, MG, Brazil.
2
Embrapa Recursos Genéticos e Biotecnologia, Laboratório de Genética Molecular Animal,
Brasília, DF, Brazil.
3
Universidade de São Paulo, Faculdade de Medicina de Ribeirão Preto, Departamento de Genética,
Ribeirão Preto, SP, Brazil.
Abstract
Fourty-six non-castrated, halothane-free, male Landrace pigs were genotyped by PCR-RFLP for the Rsa I polymorphism in the PIT1 gene and classified into AA and AB genotypes. Total RNA was extracted from the pituitaries and the relative quantities of growth hormone (GH) mRNA were determined by semi-quantitative RT-PCR. Pigs with the AB genotype had higher levels of GH mRNA than those with the AA genotype (p = 0.034; Kruskal-Wallis test). This result suggests that the Rsa I polymorphism may be involved in Pit-1 protein expression or function, which in turn may influence GH transcription and expression. Thus, the Rsa I PIT1 gene polymorphism in this pig line may be used as a molecular marker to identify higher GH expression and possibly select for carcass and performance traits affected by GH.
Key words:PIT1 gene, growth hormone mRNA, semi-quantitative RT-PCR, pig.
Received: September 25, 2003; Accepted: August 20, 2004.
Introduction
Pit-1 is a pituitary transcription factor for GH, prolactin and TSHβgenes (Yuet al., 1995; Cogan and Phil-lips, 1998). Yuet al.(1995) studied the association between PIT1 polymorphisms and carcass and performance traits in pigs and concluded that this gene may be a candidate for a quantitative trait locus (QTL) in these animals. Supporting evidence for this has been provided by this same group, who identified a chromosomal region close to PIT1 with evidence of QTL (Yuet al., 1999). Stancekovaet al.(1999) and Brunschet al.(2002) also studied associations of PIT1 polymorphisms with carcass and performance traits, and also suggested that PIT1 might be a candidate gene for a QTL in pigs.
According to Parkset al. (1993), the Pit-1 protein is located in somatotroph, lactotroph and tireotroph nuclei, and alterations in GH secretion in humans may be caused
by PIT1 gene mutations. Farmeret al. (1993) reported that pituitary GH secretion undergoes dramatic changes with age. In agreement with this, GH mRNA levels decrease with age, and this may be associated with the onset of pu-berty (Te Paset al., 2001).
Matteri and Carroll (1997) studied male piglets (1, 7, 14, 21, 28, 35 and 42 days old) and found that the levels of PIT1 and GH mRNAs were significantly correlated, and that the quantity of GHRH receptor mRNA correlated with GH mRNA levels. Sunet al. (2002) obtained similar results for the age-dependent expression of PIT1. However, the polymorphisms detected in the PIT1 gene have not yet been shown to affect Pit-1 function or activity in pigs (Tuggle and Trenkle, 1996).
Several techniques for quantifying gene expression have been used, particularly dot blot and northern blot anal-yses (Taniyamaet al., 1999), and semi-quantitative RT-PCR (Uchideet al., 1999).
The purpose of this study was to investigate the asso-ciation between the Rsa I polymorphism of the PIT1 gene and the relative levels of GH mRNA in pig pituitaries.
Send correspondence to Maurício Machaim Franco. Embrapa Re-cursos Genéticos e Biotecnologia, Avenida W/5 Norte Final, Par-que Estação Biológica, Prédio Biotecnologia, Sala 7, 70770-900 Brasília, DF, Brazil. E-mail: [email protected].
Material and Methods
Biological material
To determine the levels of GH gene expression, 46 pi-tuitaries were collected from Landrace pigs at Granja Re-zende S/A, Brazil. The pigs were classified into AA and AB genotypes (n = 23 each), based on the Rsa I polymorphism of the PIT1 gene. The frequency of the BB genotype in this population was < 1%, so this genotype was not included in the study on GH gene expression.
All of the pigs were non-castrated males and were halothane-free, as confirmed by PCR-RFLP of the HAL gene (data not shown).
The animals were slaughtered during the months of May through July in accordance with Brazilian legislation, during which time the seasonal temperature was relatively constant (average of 22 °C). The pigs were fasted for 24 h before slaughtering. One hour after slaughtering, the pitu-itaries were removed and immediately frozen in liquid ni-trogen for transportation to the Molecular Genetics Laboratory of the Universidade Federal de Uberlândia (UFU), where they were stored at -80 °C until RNA extrac-tion.
To search for an alternative splicing site, pituitaries of each of the three genotypes were used (n = 2 each).
DNA extraction
For Rsa I polymorphism genotyping by PCR-RFLP, genomic DNA was obtained from blood samples by adding 1 mL of lysis buffer 20 mM Tris-HCl, pH 7.5, 5 mM ethylenediaminetetracetic acid (EDTA), 640 mM sucrose, 10 mM MgCl2, 4% Triton X-100 to 500µL of white blood
cells kept on ice for 10 min. The lysed cells were precipi-tated (white pellet) by centrifugation for 1 min at 7200 g and 4 °C, followed by two or more washes with lysis buffer diluted 1:1 in water. The resulting pellet was digested with 10 µL of proteinase K (10 mg/mL) and 200 µL of proteinase K buffer (10 mM Tris-HCl, pH 7.5, 1 mM EDTA and 1% sarkosyl) by incubation overnight at 50 °C. After this, 500µL of 8 M guanidine isothiocyanate/0.49 M ammonium acetate was added to the digested material, fol-lowed by shaking for 1 h at room temperature to dissolve the pellet. DNA was precipitated with 800 µL of 100% isopropanol by centrifugation at 7200 g for 10 min, and the supernatant was discarded. The pellet was washed once with 60% isopropanol and centrifuged at 7200 g for 2 min. The DNA was dried and re-dissolved in 0.2 mL of TE (10 mM Tris-HCl, pH 7.5, containing 1 mM EDTA), fol-lowed by incubation at 65 °C for 1 h to ensure complete sus-pension.
Genotyping at the PIT1 locus
Genotyping at the PIT1 gene was done using a pair of primers designed by Yuet al. (1994), with the following se-quences: 5’ AGTGTAGCCAGAGCATCT 3’ (forward)
and 5’ ACCACATCTGCACACTCA 3’ (reverse), which amplifies an amplicon of 1745 bp, corresponding to the re-gion from intron 4 to the 3’ untranslated rere-gion (3’ UTR). The PCR reactions were carried out in a PTC-100 MJ Re-search thermocycler. After preheating at 95 °C for 4 min, amplification was done using 30 cycles at 95 °C for 1 min, 61 °C for 1 min, and 72 °C for 3 min. The final incubation was done at 72 °C for 5 min. For the PCR assays, 2.5 U of Taq DNA polymerase (Cenbiot Enzimas, Biotechnology Center - UFRGS, Porto Alegre, Brazil), 1X PCR buffer, 1.5 mM MgCl2, 200µM of each dNTP, 0.4µM each of both
primers, and 200 ng of genomic DNA in a final volume of 25µL were used. After amplification, 15µL of the PCR amplicon were digested with 12 U of Rsa I restriction en-zyme for 8 h at 37 °C; genotyping was performed in 2% agarose gels stained with ethidium bromide (10 mg/mL), and photographed under UV illumination.
RNA extraction
Total RNA was extracted from pituitaries using Trizol reagent (Gibco BRL) according to the manufac-turer’s protocol, with a Trizol/sample weight ratio of 1.5 mL of Trizol per pituitary. All samples were quantified by spectrophotometry and diluted to 50 ng/µL in diethyl-pyrocarbonate (DEPC)-treated water.
Semi-quantitative RT-PCR
Total RNA from each pig was analyzed by semi-quantitative RT-PCR, using Ready-To-GoTM RT-PCR beads (Amersham Biosciences) for the GH and β-actin genes. The GH gene primer pair was designed at the UFU Molecular Genetics Laboratory, using the Primer Designer program - version 2.0. The primers were based on the GH gene sequence (Vize and Wells, 1987). Theβ-actin gene primer pair was used to normalize the samples (Matteri and Caroll, 1997). The primers sequences were: GH - 5’ CGATCGCAGAGGTACTCCATCCAGAA 3’ (forward) and 5’ CGATCGTATGTCTCAGCCTTGTGCAG 3’ (re-verse), which amplified a 418 bp product, andβ-actin - 5’ GCTGTATTCCCCTCCATCGT 3’ (forward) and 5’ ACGGTTGGCCTTAGGGTTCA 3’ (reverse), which am-plified a 264 bp product.
Reverse transcription (RT) and PCR amplification re-actions were subsequently performed, using the following conditions: 42 °C for 30 min, 95 °C for 5 min, 25 cycles at 95 °C for 30 s, 58°C for 40 s, and 72°C for 1 min. The final incubation was done at 72°C for 10 min. Each RT-PCR mixture included 25 ng of total RNA and 0.08µM of each primer in a final volume of 50µL. Both genes were ampli-fied simultaneously in the same tube.
2% agarose gels, stained with ethidium bromide (10 mg/mL), and photographed under UV illumination.
Densitometric readings
All samples were run in the same agarose gel, and the levels of expression were quantified by densitometry using ImageMasterTM VDS Software version 2.0 (Amersham Biosciences). The relative quantities of GH mRNA were determined for each pig by the IODGH/IODβ-actin ratio,
where IOD is the integrated optical density.
Statistical analysis
The differences in age and weight between AA and AB pigs was analyzed by using variance analyses, and the association between the PIT1 genotypes and the relative quantities of GH mRNA was analyzed by using the Kruskal-Wallis test, run in the Jandel SigmaStat program, version 2.0, 1995. The results are expressed as means ± S.E.M. p values < 0.05 indicated significance.
Search for an alternative splicing site
To search for an alternative splicing site within the re-gion from exon 4 to 3’ UTR of the PIT1 cDNA, RT-PCR was carried out with 200 ng of total RNA from each of the three Rsa I PIT1 genotypes (n = 2 each), using Ready-to-GoTMRT-PCR beads (Amersham Biosciences).
The primers used were 5’ ACCTACAGCTCAGC TTCA 3’ (forward) and 5’ ACCACATCTGCACACTCA 3’ (reverse). The forward primer was designed at the UFU Molecular Genetics Laboratory. The reverse primer was described by Yuet al. (1994). A concentration of 0.2µM of each primer was used in a final volume of 50µL. The RT and PCR amplification reactions were performed using the following conditions: 42 °C for 30 min, 95 °C for 5 min, 35 cycles at 95 °C for 30 s, 55 °C for 40 s, and 72 °C for 1 min. The final incubation was done at 72 °C for 10 min.
After amplification, 15µL of the RT-PCR amplicons were run on 1.8% agarose gels, then stained with ethidium bromide (10 mg/mL), and photographed under UV illumi-nation.
The smallest RT-PCR amplicon was cut from the agarose gel, macerated, filtered through a glass-wool plug by centrifugation at 6000 g, and collected in a 1.5 mL microtube. Purification was done by adding 2µL of 7.5 M ammonium acetate and 2µL of glycogen (10 mg/mL) to 8µL of filtered solution, which was mixed and incubated with an equal volume of 100% ethanol for 3 h at -20 °C. The DNA solution was centrifuged at 19000 g for 5 min, and the pellet was subsequently washed with 70% ethanol. The pu-rified amplicon was cloned by using the TOPO TA cloning kit (Invitrogen Life Technologies), and the selected frag-ment was sequenced using a dideoxy fluorescence termina-tor system (ABI 377).
Control reactions
Negative controls for all semi-quantitative RT-PCR were obtained by using total RNA without reverse tran-scription, in order to check for DNA contamination. The to-tal RNA from all samples used to search for an alternative splicing site was treated with RNase-free DNase I. Nega-tive controls for all RT-PCR assays were run without DNA/RNA template.
Results
Genotyping at the PIT1 locus
The pigs were separated according to their PIT1 ge-notype, with an equal number (n = 23) per group. Figure 1 shows the genotype patterns. Allele A contained one 710 bp fragment, whereas allele B had two fragments (388 and 322 bp). Monomorphic fragments of 774, 153 and 108 bp were also present.
RNA extraction, semi-quantitative RT-PCR and statistical analysis
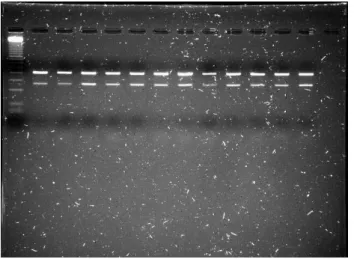
RNA extractions were of similar quality (Figure 2). Semi-quantitative RT-PCR produced a 418 bp fragment for the GH and a 264 bp fragment for theβ-actin gene. The co-amplified amplicons are shown in Figure 3.
The statistical analysis showed no differences be-tween AA and AB pigs regarding age and weight (p > 0.05); the AA pigs were 141.56 ± 1.01 days old and weighed 92.60 ± 1.36 kg, while the AB pigs were
Figure 1- RsaI polymorphisms in the PIT1 gene detected by PCR-RFLP. The PCR products were run on 2% agarose gels. M - 100 bp ladder of mo-lecular weight markers (Gibco/BRL); lanes 1 - 8 and 16 show the AB ge-notype; lanes 9 - 15 and 17 - 19 show the AA genotype. Allele A contained a 710 bp fragment whereas allele B had two fragments, 388 and 322 bp, that are indicated by arrows. Monomorphic fragments of 774, 153 and 108 bp were also present.
142.65 ± 0.93 days old and weighed 89.23 ± 2.00 kg. Be-sides that, the relative abundance of GH mRNA was higher in AB pigs than in AA pigs: 2.37 ± 0.15 in AA pigs, and 3.52 ± 0.40 in AB pigs (p = 0.034).
Alternative splicing site
The RT-PCR amplifications from exon 4 to 3’-UTR of PIT1 cDNA generated two stronger bands, 650 bp and 496 bp, including the primer sequences (Figure 4). The 650 bp fragment had the expected size based on the PIT1 cDNA sequence, whereas the 496 bp fragment could be an alternative splicing fragment. After sequencing, the small-est fragment was deposited at GenBank (accession number AY309500) and used to search for homology in the GenBank database using BLAST software (www.ncbi. nlm.nih.gov/blast). No homology was found for the PIT1 gene as expected, but it showed high homology withHomo
sapiensandMus musculusA kinase (PRKA) anchor pro-tein 13 isoform genes. These primers are specific for the PIT 1 gene sequence of the pig, but they probably bound unspecifically and sufficiently to generate the smallest fragment.
Control reactions
Figure 5 shows the control reactions for DNA con-tamination in the total RNA samples.
Discussion
For semi-quantitative RT-PCR 25 cycles were used, since at this number the reaction was in its exponential phase, an important and necessary condition for the quanti-fication of gene expression. The two primer pairs were co-amplified in the same reaction tube, thus avoiding dif-ferent amplification conditions and reducing the possibility of mistakes. An internal control (β-actin) was used to nor-malize the quality and quantity of the RNA samples, as dis-cussed by Siebert and Larrick (1992). This method for quantifying gene expression is fast and efficient and is an important tool in gene expression studies.
Tatsumi and Amino (1999) showed that the Pit-1 pro-tein was involved in modulating the expression of GH, TSH, prolactin and PIT1 genes. Korytkoet al. (1996) men-tioned that little is known about GHRH receptor regulation, although Pit-1 may modulate its expression.
Te Paset al. (2001) studied the growth rate and the re-duction in back fat thickness in Large White pigs, as well as changes in the mRNA levels of GH and PIT1 genes, and concluded that for each generation of selection the GH and PIT1 mRNA levels increased by 50%. Nevertheless, there was considerable variation in the mRNA levels of both genes among animals within each generation.
The availability of a DNA marker related to the varia-tions in GH and PIT1 mRNA levels could be useful for iden-tifying and selecting animals with favorable genotypes.
As shown here, Rsa I genotypes in the PIT1 gene pre-sented an association with GH mRNA levels, suggesting
Figure 3- Semi-quantitative RT-PCR for the GH gene. First lane - 100 bp ladder of molecular weight markers. The 12 lanes represent co-amplified samples of GH cDNA (418 bp) and theβ-actin cDNA (264 bp). Lanes 1-6 show the AB genotype; lanes 7-12 show the AA genotype. The samples were run on 2% agarose gels.
Figure 4- PIT1 cDNA amplicons. First lane - 100 bp ladder of molecular weight markers. Lanes 1 and 2 - genotype AB; lanes 3 and 4 - genotype BB; lanes 5 and 6 - genotype AA. The samples were run on 2% agarose gels.
that this polymorphism may be a useful molecular marker for production traits that are controlled by GH.
This conclusion is reinforced by the findings of Sunet al. (2002), who observed an important association of an Msp I PIT1 polymorphism with the plasma levels of GH and PRL, which suggested an association between this ge-notype and gene expression in the pituitary. Together, these results show the important physiological effect of the PIT1 gene on other genes in this gland.
Yuet al. (1999) detected a strong association between PIT1 polymorphism and microsatellites that flank this gene and the phenotypic traits of young animals. The expression of PIT1 is age-dependent, with higher expression in young animals. Matteri and Carroll (1997) also observed age-dependent changes in the expression of various other genes. As shown here, an association between PIT1 gene polymorphism and GH mRNA expression was detected close to puberty. Although the importance of PIT1 in early life has been shown previously, we also found an associa-tion between this gene polymorphism and the level of GH gene expression in adult animals.
The genes involved in the pathway of GH action have great potential as molecular markers, with a direct applica-tion for animal producapplica-tion, because of their physiological effects on bone and muscle growth, fat metabolism and other important effects on animal development. Most of the studies in this area have used humans, mice and rats as models, with few studies of economically important ani-mals. Studies of candidate genes based on direct physiolog-ical effects are simple and straightforward, as compared to the use of anonymous DNA markers, which requires long, labor-intensive protocols.
The results shown here suggest that the Rsa I poly-morphism could be related with levels of PIT1 gene expres-sion. This polymorphism could be involved in the production of alternative transcripts, thereby altering the protein and its function. Since the Pit-1 protein is involved in GH expression, a difference in GH mRNA levels would be expected with different PIT1 genotypes.
The presence of two amplicons in the RT-PCR ampli-fication of the PIT1 region from exon 4 to the end of the cDNA, containing the Rsa I mutation in intron 5, raised the possibility of alternative gene splicing. The 650 bp frag-ment (Figure 4) had the expected size based on the known gene sequence, whereas sequencing of the smallest 496 bp fragment (accession number AY309500) showed that it was not an alternative transcript, since BLAST analysis in-dicated high homology with Homo sapiens and Mus musculus A kinase (PRKA) anchor protein 13 isoform genes. It is the first time that this sequence is described in pigs.
The possible interference of this mutation with other alternative splicings, already described (Tuggle and Trenkle, 1996), remains to be determined. Furthermore, the
quantification of PIT1 mRNA may also associate this mu-tation with PIT1 self-expression.
The Rsa I PIT1 polymorphism may be related to GH mRNA levels through self-regulation of the PIT1 gene and/or interference with the production of alternative gene transcripts. Either of these possibilities would result in al-tered PIT1 gene expression and consequently in GH gene expression. Additional studies to analyze the PIT1 gene ex-pression will be important for a better understanding.
We can conclude that this PIT1 polymorphism may be a useful molecular marker for selecting higher GH mRNA levels as well as phenotypic traits related to GH ac-tion in this populaac-tion.
Acknowledgements
The authors thank Rezende Alimentos S/A for pro-viding the biological material.
References
Brunsch C, Sternstein I, Reinecke P and Bieniek J (2002) Analysis of associations of PIT1 genotypes with growth, meat quality and carcass composition traits in pigs. J Appl Genet 43:85-91.
Cogan JD and Phillips III JA (1998) Growth disorders caused by genetic defects in the growth hormone pathway. Adv Pediatr 45:337-361.
Delhase M, Vila V, Hooghe-Peters EL and Castrillo JL (1995) A novel pituitary transcription factor is produced by alterna-tive splicing of the human GHF-1/PIT1 gene. Gene 155:273-275.
Farmer C, Pommier SA and Brazeau P (1993) Validation of a cul-ture system for porcine pituitary cells: Effects of growth hor-mone-releasing factor and(or) somatostatin on growth hormone secretion. J Anim Sci 71:923-929.
Korytko AI, Zeitler P and Cuttler L (1996) Developmental regula-tion of pituitary growth hormone-releasing hormone recep-tor gene expression in the rat. Endocrinology 137:1326-1331.
Matteri RL and Carroll JA (1997) Somatotroph function in the neonatal pig. Domest Anim Endocrinol 14:241-249. Parks JS, Abdul-Latif H, Kinoshita E, Meacham LR, Pfaffle RW
and Brown MR (1993) Genetics of growth hormone gene expression. Horm Res 40:54-61.
Pfaffle RW, Kim C, Blankenstein O and Kentrup H (1999) GH transcription factors. J Pediatr Endocrinol Metab 12:311-317.
Siebert PD and Larrick JW (1992) Competitive PCR. Nature 359:557-558.
Stancekova K, Vasicek D, Peskovicova D, Bulla J and Kubek A (1999) Effect of genetic variability of the porcine pitu-itary-specific transcription factor (PIT1) on carcass traits in pigs. Animal Genetics 30:313-315.
Sun HS, Anderson LL, Yu T-P, Kim K-S, Klindt J and Tuggle CK (2002) Neonatal Meishan pigs show POU1F1 genotype ef-fects on plasma GH and PRL concentration. Anim Reprod Sci 69:223-237.
somatolactin family and PIT1/GHF-1 in the pituitaries of pre-spawning chum salmon. J Mol Endocrinol 23:189-198. Tatsumi K and Amino N (1999) PIT 1 abnormality. Growth Horm
IGF Res Suppl B 18-22.
Te Pas MFW, Freriksen JWM, Van Bijnen AJHM, Gerritsen CLM, Van Den Bosch TJ, Harders FH, Verburg FJ, Visscher AH and De Greef KH (2001) Selection for growth rate or against back fat thickness in pigs is associated with changes in growth hormone axis plasma protein concentra-tion and mRNA level. Domest Anim Endocrinol 20:165-184.
Tuggle CK and Trenkle A (1996) Control of growth hormone syn-thesis. Domest Anim Endocrinol 13:1-33.
Uchide T, Masuda H, Mitsui Y and Saida K (1999) Gene expres-sion of vasoactive intestinal contractor/endothelin-2 in ovary, uterus and embryo: Comprehensive gene expression profiles of the endothelin ligand-receptor system revealed
by semi-quantitative reverse transcription-polymerase chain reaction analysis in adult mouse tissues and during late em-bryonic development. J Mol Endocrinol 22:161-171. Vize PD and Wells JRE (1987) Isolation and characterization of
the porcine growth hormone gene. Gene 55:339-344. Yu TP, Schmitz CB, Rothschild MF and Tuggle CK (1994)
Ex-pression pattern, genomic cloning and RFLP analyses of the swine PIT1 gene. Anim Genet 25:229-233.
Yu TP, Tuggle CK, Schmitz CB and Rothschild MF (1995) Asso-ciation of PIT 1 polymorphisms with growth and carcass traits in pigs. J Anim Sci 73:1282-1288.
Yu TP, Wang L, Tuggle CK and Rothschild MF (1999) Mapping genes for fatness and growth on pig chromosome 13: A search in the region close to the pig PIT1 gene. J Anim Breed Genet 116:269-280.