Arq Bras Cardiol 2002; 78: 409-11.
Barbosa Fo et al
Nonrespiratory sinus arrhythmia
409 409 Instituto Nacional de Cardiologia Laranjeiras, Ministério da Saúde e Universidade
Gama Filho
Mailing address: José Barbosa Filho – Rua Souza Lima, 324/201 – 22081-010 Rio de Janeiro, RJ
José Barbosa Filho, Paulo Roberto B. Barbosa, Ivan Cordovil
Rio de Janeiro, RJ - Brazil
Nonrespiratory Sinus Arrhythmia
Case Report
We report here 2 cases of sinus arrhythmia conside-red to be a form of nonrespiratory sinus arrhythmia because they did not have variances in the RR interval sequence within the oscillations modulated by respira-tion. Because the patients had pulsus alternans similar that observed in bigeminy, and because they did not have signs or symptoms of heart failure, we believe the arrhy-thmias represent intrinsic alterations of the electric activity of the sinus node.
Respiratory sinus arrhythmia is a normal phenomenon observed more clearly in children and adolescents. In elderly individuals, it becomes imperceptible both clinically and electrocardiographically. Therefore, the variation in the RR intervals modulated by respiration can only be analyzed through digitized systems with filters capable of detecting and properly processing small variations in these intervals. Using algorithms, we observed that the sympathetic-vagal system modulates the heart rate within a frequency band that ranges from 0.1Hz to 0.4Hz, regardless of the clinical picture of the patients.
Case reports
Patients were studied according to the principles of the Helsinki Declaration and Brazilian laws, and the study protocol was approved by the Medical Ethics Committee of the Instituto Nacional de Cardiologia Laranjeiras (National Institute of Cardiology-Laranjeiras). The patients gave informed consent.
Two individuals were included in the study from the time of their first appointment at the Ambulatory Clinic of the Division of Arterial Hypertension of the National Insti-tute of Cardiology-Laranjeiras. The selection of these
pa-tients for the echocardiographic RR oscillation interval study was prompted by the alternans features, both graphic and auscultatory, of the arterial pulsus.
Case 1 - A 79-year-old female presented with atypical complaints for heart disease, characterized by chest pain and tinnitus, and she was taking vitamins and a cerebral vasodila-tor. Physical and laboratory examinations, as well as radiology and electrocardiography, were within normal limits. The echocardiogram showed signs of aortic and mitral arterios-clero sis, preserved ventricular function, and a 3.4cm left atrium diameter. Blood pressure was 127/61mmHg (average = 85mmHg), and pulsus alternans was present (fig. 1).
Case 2 - An 80-year-old male presented with a clinical history of stable angina, well controlled with clinical treatment. He was taking oral nitrates and salicylic acids. Ra-diology showed a discreet enlargement of the cardiac area (cardiothoracic index=52%), and physical and laboratory examinations of the heart were within normal limits. An elec-trocardiogram showed first-degree atrioventricular block (PR interval = 260ms). Echocardiogram showed signs of aortic valve sclerosis, preserved ventricular function, and a left atrium 3.8cm in diameter. Blood pressure was 151/ 81mmHg (average = 104mmHg) and pulsus alternans was present (fig. 1).
Both patients were in sinus rhythm and had no complaints of palpitations.
The electrocardiographic signals of the two patients were acquired during 300s, using the AECG03 amplifier (Lynx Tecnologia Ltda., São Paulo) and analyzed using the ECGAR® system, developed for this purpose and
previous-ly described 1. The signs were acquired with the individuals
in supine position and breathing normally, in a quiet place with temperature maintained at 25oC, during the period
bet-ween 14h and 17h. The examinations were performed at least 4 hours after the last meal.
Blood pressure was assessed using an oscillograph after the patient had 5-minutes of bed rest in the supine po-sition. During auscultation, pressure curves were recorded during a 25-second interval.
Analysis of the RR variability (V-RR) in both patients was performed in time and frequency domains. With regard to time domain, we assessed the mean heart rate of the
410 410
Barbosa Fo et al
Nonrespiratory sinus arrhythmia
Arq Bras Cardiol 2002; 78: 409-11.
mal RR intervals series, calculated as the values of the instantaneous cardiac rate. With regard to frequency do-main, the series of consecutive normal RR intervals was in-terpolated, and the power spectrum was calculated using a previously described technique 2. We analyzed the features
of the areas of the power spectrum between 0.05 and 1Hz, and we identified the dominant peak of power density.
The P waveform preceding each normal beat was analyzed and compared, 2 by 2, with the subsequent beats, using a simple correlation.
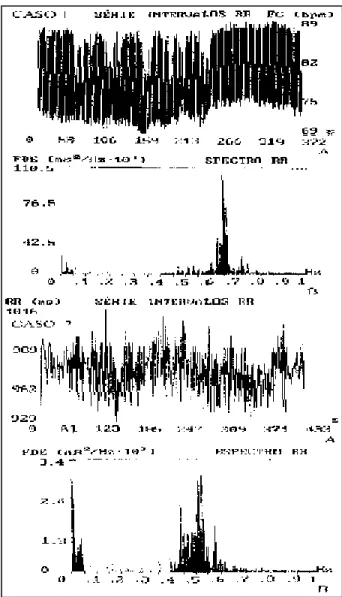
Both the normal RR intervals and the power spectrum of a control individual of the same age group can be observed in figure 2.
The distribution of the RR intervals of both patients in the frequency domain (fig. 3) is very different from those assessed in the healthy individual from the same age group (fig. 2). The behavior of the series of normal RR intervals and the distribution of several V-RR bands can be observed in figure 2 . In the patients, the main features are the low energy of the entire power spectrum, especially that from the high-frequency region, and the presence of an unexpect e d Fig. 1 – Record of pulsus during blood pressure assessment through the oscillome-tric method. Observe the pulsus alternans.
Fig. 2 – Record of the series of normal RR intervals and the respective power of a control individual of the same age group of the assessed patients. Observe that the energy of the spectrum does not go beyond 0.4Hz. In the ordinates of the graph, RR intervals are displaced: in case 1, they are expressed in bpm; in case 2, they are expressed in ms. In the abscissa, the time of detecting the signs of the electrocardiogram are expressed in ms. In the FPD graphic, the ordinates represent the values of the spectrum energy, in ms2/Hz .103, and the
abscissa represent the values of the frequencies, in Hz, of the bands assessed. FPD-function of the power spectral density.
Arq Bras Cardiol 2002; 78: 409-11.
Barbosa Fo et al
Nonrespiratory sinus arrhythmia
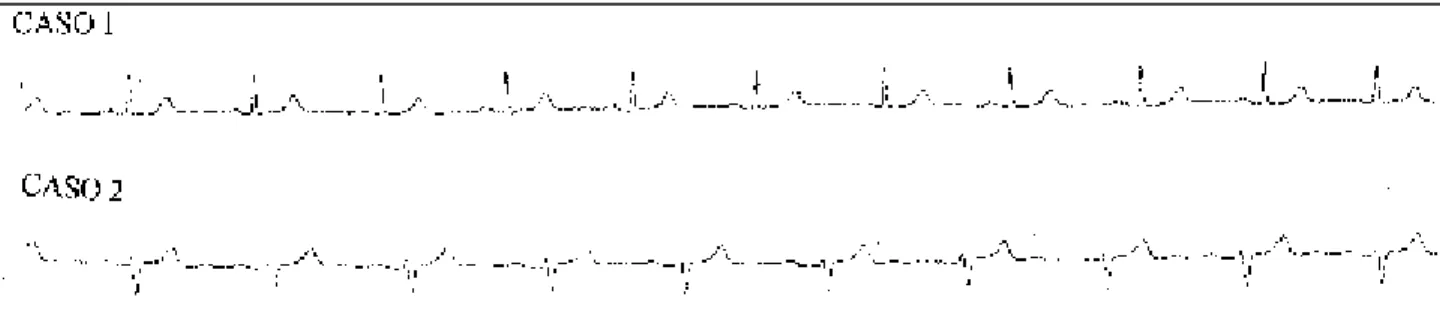
411 411 Fig. 4 - Record of the D2 derivation of the electrocardiogram of the study patients, where the maintenance of the sinus mechanism can be observed, P waves of the same morphology and RR intervals without clear variations.
concentration of energy in the very high-frequency band (fig. 3). The fact that the frequency in Hz, where the energy of the power density spectrum is focused, corresponds to half of the RR interval related to the mean heart rate related to time is remarkable. Thus, in case 1, the energy of the power spectrum was 0.658Hz, corresponding to a heart rate of 79bpm, and, in case 2, it was 0.515Hz, corresponding to a heart rate of 61.8bpm (fig. 3).
Electrocardiographic recordings (fig. 4) show that the sinus mechanism is maintained, with P waves of the same morphology and a consistent correlation between the waveforms, showing that the behavior of the RR intervals does not correspond to any kind of recognized supraventri-cular or ventrisupraventri-cular arrhythmia.
The record of the arterial pulse curve during assess-ment of blood pressure is typical of pulsus alternans (fig. 1).
Discussion
V-RR with the very particular pattern of distribution of the power spectrum frequency, different from those frequently observed in healthy and cardiac patients, was first described by Binkley et al. 3, in 1 patient with cardiac
failure. However, we have not found any description of this characteristic pattern of V-RR in the literature in patients without significant cardiac structural alterations and without arrhythmia, which, if it were, could explain this behavior of the RR intervals 4. In fact, the behavior of the
V-RR, both in elderly and cardiac patients, is characterized by low energy and by homogeneous distribution of energy in several bands of the power spectrum 2. With regards to
rapid variations of the normal RR intervals, the reduction in high-frequency energy is related to a decrease in the
activity of the parasympathetic nervous system.
Our patients had, as basic features, great concentra-tions of energy in the very high-frequency area of the power spectrum, therefore, out of the region usually modulated by the vagal-sympathetic system (fig. 3).
Similarly to that which Binkley et al 3 observed, our
pa-tients had alterations in the power spectrum, the record of the curve of systemic blood pressure with the typical ap-pearance of pulsus alternans that called attention to the phenomenon (fig. 1), although our patients did not have signs or symptoms of heart failure.
The responsible mechanism for these alterations, as described by Binkley et al 1, peaks at a very high frequency
of the power spectrum associated with pulsus alternans and is related to a reduced baroreflex sensitivity, similar to a low-gain feedback control system in which uncontrolled os-cillations in blood pressure signals may occur 5. Thus,
oscillations in blood pressure would cause alterations simi-lar to those of V-RR.
On the other hand, we could suppose that the mecha-nism was inverted. That is, rapid changes in the V-RR would depend on an electrical alternation in the activity of the sinus node, regardless of respiration. Thus, electromechani-cal alterations observed would have a mechanism similar to that of bigeminy (shorter RR interval, lower blood pressure), having intrinsic physiopathologic alterations of the sinus node as a base. From this hypothesis, we can postulate that this behavior of the V-RR may represent a form of sinus node disease.
From the evolvement of the patients, we observed that, in a 3-year follow-up, our patients maintained the same pattern, both of the power spectrum and the behavior of the pulse wave, without having clinical alterations worth mentioning.
1. Barbosa PRB. A signal-averaging system for surface ECG signal analysis. Phys Med Biol 1994; 39: 412.
2. Barbosa PR, Barbosa FJ, Morais de Sá CA. Influência da idade, sexo e doença coronária sobre a modulação autonômica do coração. Arq Bras Cardiol 1996; 67: 325-9. 3. Binkley PF, Eaton GM, Nunciata E, et al. Heart rate alternans. Ann
In-tern Med 1995; 122: 115-7.
References
4. Frank JL, Ropper AH, Zuniga G. Acute intracranial lesions and respiratory sinus arrhytmia. Arch Neurol 1992; 49: 1200-7.