Strategic Assessment of Lisbon
’
s Accessibility
and Mobility Problems from an Equity Perspective
Camila Soares Henrique Fontenele Garcia1&
Maria do Rosário Maurício Ribeiro Macário1&
Ezequiel Dantas de Araújo Girão Menezes2&
Carlos Felipe Grangeiro Loureiro2
#Springer Science+Business Media, LLC, part of Springer Nature 2018
Abstract Accessibility planning with reference to sustainability and equity principles has been advocated as the best approach to deal with the urban mobility complexity. It has enabled the development of more sustainable and fair policies in relation to access provision. However, despite this paradigm shift, many planning initiatives in practice are still focused on assessing alternatives and proposing solutions, instead of centering on the understanding and assessment of problems as the primary activity of planning. Therefore, in order to contribute for the problem-oriented paradigm in the accessibility planning, this work proposes a strategic assessment methodology for unequal and inequitable distribution problems of accessibility and mobility. This methodology relies on spatial analysis techniques and allows the characterization of accessibility and mobility conditions, as well as the diagnosis of accessibility and mobility problems and their causal relationships. It was applied for the case of Lisbon and the results of the performed assessment allowed an intelligent reading of the problems considered. Specifically, it was found that Lisbon presents an unequal and inequitable distribution of job accessibility and mobility by private car and public transport, and also that job https://doi.org/10.1007/s11067-018-9391-4
* Camila Soares Henrique Fontenele Garcia [email protected]
Maria do Rosário Maurício Ribeiro Macário [email protected]
Ezequiel Dantas de Araújo Girão Menezes [email protected]
Carlos Felipe Grangeiro Loureiro [email protected]
1
CERIS, IST, Universidade de Lisboa, Av. Rovisco Pais, 1049-001 Lisbon, Portugal
accessibility, along with other transportation, land-use and socioeconomic variables, impact the mobility levels of its citizens.
Keywords Accessibility . Mobility . Equity . Problems . Assessment . Strategic
1 Introduction
Over time the effort of planning the Urban Mobility System (UMS) has undergone some conceptual, moral and methodological paradigm shifts resulting in the proposal of different planning approaches that highlight the importance and combination of new values and principles such as mobility, accessibility, sustainability and equity (Banister
2008; Handy 2005; Kenworthy 2007; Macário 2014). More recently, the integrated urban planning, reinterpreted as the new accessibility planning paradigm, has been pointed out as the most adequate approach to jointly address land use and transportation issues affecting the population’s accessibility and mobility problems (Bertolini et al.
2005; Curtis2008; Halden2009). Such approach when combined with sustainability and equity principles has enabled the development of urban policies that consider not only offering good levels of accessibility by more environmentally friendly modes, but also the decrease of spatial and social effects of the accessibility distribution and the improvement of the system’s global efficiency.
However, despite the consideration of these strategic values and principles, the normal practice of planning initiatives has centered on proposing solutions and achiev-ing predefined goals, instead of focusachiev-ing on the identification and understandachiev-ing of the real needs and problems faced by users and other stakeholders. The analysis of traditional transportation planning methodologies shows that the problem understand-ing or diagnosis phase at the strategic level has received less emphasis compared to other phases in the planning process (Garcia2016). It has usually consisted of an oversimplified description of problems that does not derive from a systematic assess-ment activity, based on well-defined procedures, allowing the identification of prob-lems and the understanding of their causes and effects.
In this sense, the main objective of this paper is to propose a methodology and to perform a strategic assessment of peoples’ accessibility and mobility problems in Lisbon, considering an equity perspective. The specific objectives and the correspond-ing paper structure are: (i) to discuss the fundamentals of the strategic assessment of accessibility and mobility problems (Section2), as well as the contribution of equity and sustainability principles in the definition of such problems (Section3); (ii) to propose a strategic assessment methodology to characterize unequal and inequitable accessibility and mobility problems and to diagnose their causal relationships (Section4); and (iii) to apply the methodology to the Lisbon case in order to assess accessibility and mobility problems of its population. (Section5). The conclusions are presented in Section6.
2 Strategic Assessment of Accessibility and Mobility Problems
transportation and land use systems are emphasized and explored. However, this strategic and systemic view over the UMS is still missing in many cities, with those few sensitive to the subject considering it, in a reductionist way, as just being the capacity of forecasting demand and controlling the transportation system. As argued by Macário (2007), this misperception, in turn, leads to inefficiencies in the planning results, since the causal relationships between the problems faced by the UMS are not observed and understood, and, consequently, are not adequately articulated within the planning process.
As a way of overcoming such practice, the starting point of any strategic UMS planning exercise should be the assessment of problems related to accessibility, con-sidered as the potential of opportunities for spatial interaction (Hansen1959), as well as mobility, related to individual’s travel behavior and expressed by the amount of actual movement performed by them (Salomon and Mokhtarian 1998). This assessment activity relies primarily on the analysis of a set of problems that need to be adequately represented in order to support the understanding of the UMS problematic. Such representation involves aspects related to both land-use and transportation urban subsystems, as well as hypotheses about their causal relationship that evidence the link between accessibility and mobility levels. The structured representation of these prob-lems in the form of a tree diagram is fundamental for the planning process, inasmuch it can facilitate the participation of stakeholders through the provision of systematized information and help planners to better understand the influences of each urban subsystem in the problems under analysis.
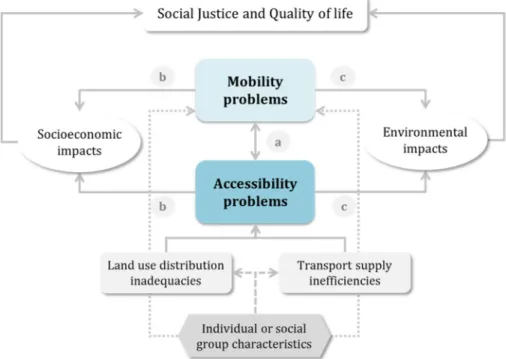
Therefore, assessing problems at a strategic level means recognizing and analyzing the causal relationships presented in Fig. 1. This implies investigating the aspects related to land-use and transportation characteristics related to the social group in
question that determine the provided levels of accessibility, as well as the effects that these levels of accessibility can have on mobility, and hence the effects that these two can have on the socioeconomic and environmental dimensions of the urban system (Cervero2005). Specifically, considering the bottom of the diagram, the focus would be on investigating whether there are restrictions on the provided levels of accessibility and, if so, how transportation inefficiencies and land-use distribution inadequacies influence them. At the top of the diagram, in turn, the analysis would focus on the different effects that (a) accessibility and mobility may have on each other considering the social group in question, and their impacts on (b) socioeconomic activities, as well as on (c) the environment.
Considering the left side of the diagram the objective is to investigate the effects that accessibility restrictions produces on mobility and hence on socioeconomic activities. The main assumption is that low levels of accessibility may lead to less mobility and hence to less activities, therefore causing social and economic problems such as social exclusion or underperformance of economic production, as argued by Macário (2014). However, it is recognized that other possible relationships between accessibility, mobility and socioeconomic activities may occur, such as when people do not need to travel to perform activities or when they are forced to travel in congested conditions. In the first case, their mobility levels are low despite their accessibility and activity levels are high, while in the second case their mobility and activity levels are high regardless of the low levels of accessibility offered.
On the right side of the diagram the purpose is to investigate the effects that accessibility restrictions have on mobility and hence on the environment. Here the consideration of accessibility restrictions by different modes is essential as they may have different impacts as follows: i) restrictions on accessibility by car lead to less mobility by car, and less environmental impacts; ii) restrictions on accessibility by PT may induce more mobility by car, causing congestion and their associated environ-mental impacts such as energy consumption and pollutant emissions (Banister2002). The derived congestion from the high levels of mobility by car can thus increase travel times and reduce the overall levels of accessibility, especially in the cases where there is no segregation between car and public transport traffic (Levine and Garb2002; Moya-Gómez et al.2017). On the other hand, according to Mondschein et al. (2011), high accessibility by car can attract more trips to certain areas and therefore promote congestion, thus reinitiating the cycle.
3 New Principles in the Urban Accessibility and Mobility Planning
Nowadays sustainability is a well-accepted and applied principle in urban mobility planning, that is commonly approached by a three-dimensional framework comprising economic, social and environmental aspects (Banister2008; Jeon2007). These dimen-sions are usually interpreted as specific objectives (Goulias 2003) denoting a clear solution-oriented character of recent planning initiatives in which each dimension drives the proposal of policies even before considering the particular problems that different urban areas face. In this traditional perspective of sustainability, equity is seen as just one of its components being related to the social dimension, which has been receiving less attention in both theory and practice of planning when compared to the other dimensions (Boschmann and Kwan2008; Martens2006; Uteng2007; Vallance et al.2011). This demonstrates how the social dimension and, most importantly, the principle of equity have been considered the weak link in the urban mobility agenda, when it should be in fact the center as it focuses on individuals and their well-being (Jones and Lucas2012).
Nevertheless there is a strand defended by some authors that considers equity as the central principle behind sustainability (Beder2000; Feitelson2002; Weiss1992). They argue that, in order to achieve sustainability, there should be a minimum level of social, economic and environmental basic conditions enforced to all so that no individual or group should carry a greater burden than the rest of the community. They also consider that the burdens of the present living should not be passed to the future ones in order to guarantee the sustainable development. In this view, the distribution of primary goods and their impacts becomes the focus of interest, leading thus to the consideration of equity as the underlying principle of the planning process, that functions as a pre-requisite for the sustainability achievement.
From this perspective for achieving sustainability in the UMS, the provision of minimum levels of accessibility and mobility for all must be ensured, and the differ-ences in the accessibility and mobility across social groups minimized, as well as their impacts such as social exclusion, economic inefficiencies, and environmental degrada-tion in the present (intrageneradegrada-tion equity) and in the future (intergeneradegrada-tion equity). This means that accessibility and mobility problems within the UMS should be addressed by establishing equity and sustainability criteria that would allow indicating whether certain accessibility and mobility conditions should be considered a problem or not.
These two theories clearly contribute to frame the assessment of intra and intergenerational equity issues on urban accessibility and mobility. Considering the sufficientarianism theory, it is thus possible to argue the need for setting accessibility and mobility limits or thresholds that allow identifying individuals or regions that are not been well served, while the consideration of egalitarianism would allow delineating ways of assessing how different groups are being served in terms of accessibility and mobility. However, Wolf (2009) and Meyer (2014) allege that, for the intergeneration equity or sustainability analysis, the sufficientarianism approach is the most adequate once the establishment of thresholds could allow comparing different generations. By setting minimum thresholds for one generation, it is possible to assess whether other generations (past or future) are more or less well served, and therefore if the provision of certain basic needs, e.g., accessibility, is being fulfilled in order to guarantee the sustainability of the mobility patterns.
The application of sufficientarianism and egalitarianism theories in the assessment of accessibility has been recently defended by some authors. Van Wee and Geurs (2011), based on Rawls’ideas (Rawls1971), argue that considering accessibility as a primary social good allows valuing not only its utility, but accessibility itself. This means, from an egalitarian perspective, to focus the accessibility analysis on those social groups who have the lowest levels of accessibility, while from a sufficientarian perspective the attention would be on the absolute value of accessibility of those who are worse off. Lucas et al. (2015) also make a good case for the use of sufficientarianism and egalitarianism theories in the assessment of accessibility. They claim that the use of these ethical perspectives allows determining the equity of policy decisions and setting minimum accessibility standards in order to improve policymaker confidence on new planning and decision frameworks that promote urban accessibility over mobility.
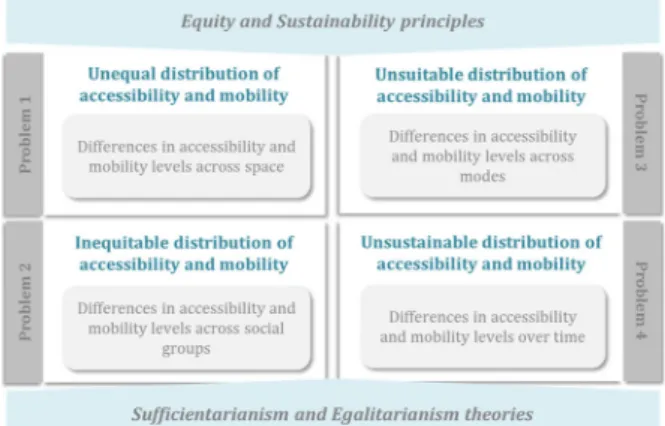
In this research these ethical theories combined with the equity and sustainability principles are considered as the basis for defining a typology of accessibility and mobility problems, including four main categories, as described in Fig.2: unequal, inequitable, unsuitable, and unsustainable distributions of urban accessibility and mobility. The first category relies on the sufficientarianism theory and considers that, regardless their differences, everyone should have a minimum level of access to opportunities, as well as of travel mobility. The second category, in turn, departs from
an egalitarian approach and assumes that, considering differences (social, economic, etc.), everyone should have access to their desired opportunities, experiencing good levels of mobility. The third and fourth categories are also based on the sufficientarianism theory: with the third one considering that there should be a mini-mum level of accessibility and mobility by non-motorized and public transport modes compared to private car, suitable for maintaining low levels of environmental impacts; and the fourth one considering that future generations should not experience lower levels of accessibility and mobility than the current minimum.
These categories can be associated to what many authors call as horizontal, vertical, and longitudinal equity, referring to the differences in accessibility and mobility levels across space, social groups, modes, as well as along time for each individual’s perspective (Macário 2005; Uteng 2007; Martens et al. 2012; Litman 2017). They can be viewed as universally identifiable categories of problems that any urban area may face, whose causes and impacts have to be investigated in order to generate a complete understanding of the dynamics behind them. They can be also associated to the dimensions of sustainability, with the unequal distribution being related to the economic one, the inequitable distribution related to the social one, the unsuitable distribution related to the environmental one, and the unsustainable distribution with the three others in an intergeneration perspective.
The consideration of these problems constitutes a more robust way to conduct the strategic analysis of the UMS problematic, since it is not enough to know which are the individuals or areas affected by low levels of accessibility, but also to identify the causes of these levels to be able to act on them. In the same way, it is essential to investigate whether these accessibility problems are leading to mobility problems, and perhaps limiting the social participation of individuals, promoting unsustainable mo-bility patterns and/or environmental degradation. It is noteworthy that this research does not intend to examine the implications of accessibility problems on the social exclusion and sustainability problems; the aim is just to understand the relationship mechanisms between accessibility and mobility problems that may lead to these larger problems.
4 Strategic Assessment Methodology for Unequal and Inequitable
Accessibility and Mobility Problems
2015; Li et al.2015; Dou et al.2016; Cheng et al.2016). A detailed description of the steps and methods of analysis that comprise each of the phases of the methodology is presented as follow.
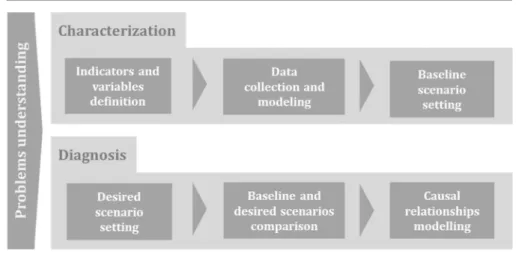
4.1 Characterization
Once accessibility and mobility are the central values of this methodology, thechoice of
adequate indicatorsto represent them must be the first task to be pursued. There is a
vast set of accessibility and mobility indicators available in the literature (Baradaran and Ramjerdi2001; Geurs and van Wee2004; Reggiani and Martín2011; El-Geneidy and Levinson2011), with each of them being more or less suitable for the analysis of different perspectives of accessibility and mobility (Primerano and Michael 2005; Curtis and Scheurer 2010; Condeço-Melhorado and Christidis 2017; Ziemke et al.
2017). In general, accessibility indicators can be classified as infrastructure-based (infrastructure indicators), location-based (separation, contour, potential, and competi-tion indicators) and person-based (utility and time-space indicators), while mobility indicators as supply-based (expressing the transport availability or performance) and demand-based (expressing the amount or the duration of trips) (Salomon and Mokhtarian1998).
Besides accessibility and mobility indicators, Bcausal^ indicators representing the transportation network, land-use and socioeconomic characteristics need to be defined. These are the factors that directly affect accessibility and/or mobility having an important role of helping to understand the possible causes behind their problems. For example, transportation network indicators, both in terms of performance (cover-age, travel time, travel distance, generalized cost, etc.) and topology (connectivity, centrality, density, etc.), have a direct impact on accessibility levels and hence on mobility, as indicated in many studies (Parthasarathi et al. 2009; Derrible and Kennedy 2010; Reggiani et al. 2011; Tsiotas and Polyzos 2017). Also, land-use indicators, such as the ones grouped into the broad categories of density (of population, housing, employment, etc.), diversity (mix of different land uses), and design (street network characteristics) (Cervero and Kockelman1997; Ewing and Cervero2010; van
Wee2002), can help to understand the levels and patterns of accessibility, and hence of mobility. Additionally, socioeconomic indicators used to represent the characteristics of individuals or groups (gender, age, years of education, type of occupation, life stage, employment status, and income levels) can also help to understand mobility and hence their overall well-being (Arora and Tiwari2007; Horn1993).
Once chosen the indicators to be analyzed, attention should be given to data
collection and modeling used to generate the necessary inputs/variables for their
calculation. Transportation and land-use data have been the pillar of mobility planning, and many urban areas already have large database for this type of information, although often outdated. Socioeconomic data are easier to get as census data are periodically collected in the majority of cities. Either way, the collection of these information demands rigor and should rely on official databases and/or, when possible, in surveys designed specifically to the UMS in question. Modeling techniques (traditional or integrated, such as LUTI models), in turn, allow updating old or generating missing transportation and land-use data, but more importantly the development of assessment scenarios. Specifically, in the characterization phase these techniques allow the repre-sentation of baseline aspects of the UMS that determine its accessibility and mobility conditions, such as travel distances, times, trips flows, land-use concentrations, activ-ities distributions, etc.
After data have been collected and modeling performed, allowing the operationalization of the defined indicators, the next step in the characterization phase refers to thebaseline scenario settingor the analysis of the indicators in order to assess the basic or current conditions of accessibility and mobility. For this, an exploratory analysis of the indicators should be performed by considering both non-spatial and spatial approaches. Specifically, the following methods are proposed for each type of problem:
& For the unequal distribution, both statistical and spatial distributions of accessibility and mobility indicators are analyzed. Measures of central tendency and dispersion (e.g., box plot) are considered to characterize the distribution patterns of the indicators, while spatial distribution maps (e.g., box map), as well as global and local spatial statistics (Moran statistics and LISA cluster maps), are analyzed to understand their spatial behavior;
& For the inequitable distribution, box maps and LISA cluster maps of accessibility and mobility are overlapped with the location of the Social Concern Group (SCG) considered (e.g., low-income, unemployed, children, elder, etc.), which is repre-sented by the clusters (High-High and High-Low) of the socioeconomic indicator chosen to represent the SCG. It is noteworthy that the SCG must represent individuals that are the focus of the analysis performed, i.e. children if the analysis is centered in the accessibility to schools or elders if the focus is the access to health facilities.
4.2 Diagnosis
The first step for the diagnosis of accessibility and mobility problems is to set the
indicators. These benchmarks, or reference parameters, must represent the users’
expectations regarding the optimal situation for each indicator considered. They allow identifying the deficit between baseline and desired situations, and hence determining the problematic areas in the city. For this, a consultative or normative approach can be considered, being the former preferable, although this approach incurs in higher cost due to the need of survey and data processing.
Once the reference parameters are established the next step is thecomparison of the baseline and desired scenarios, or of the characterized and desired levels of accessi-bility and moaccessi-bility, in order to identify the problems or the problematic areas. For this, different reference parameters and methods of analysis are applied considering the sufficientarianism and egalitarianism theories for each type of problem considered:
& For the unequal distribution problem, a sufficientarian approach is considered and a non-spatial and unique reference parameter must be set in order to allow the identification of areas in the city presenting accessibility and mobility levels below and above the minimum acceptable. This allows the production of the unequal distribution problem maps in which the insufficient areas of accessibility and mobility are highlighted;
& For the inequitable distribution problem, an egalitarian approach is considered and the clusters of the SCG previously defined are used as spatial reference parameter. These clusters are then overlaid on the unequal distribution problem maps in order to assess whether the SCG is located in areas of accessibility and mobility insuf-ficiency or not. This allows updating the unequal distribution problem maps by highlighting the location of the SCG and to identify the critical areas in terms of accessibility and mobility.
The next step is theanalysis of the causal relationshipsbetween problems considering the causal hypotheses assumed. The sequence of analysis also reflects the type of problem considered. For the unequal distribution problem, the analysis starts by the formulation of hypothesis regarding their possible causes and is followed by the estimation of non-spatial correlations and the calibration of non-spatial regression models. In the first case, the purpose is to estimate the dependency relationship between cause and effect indicators (e.g. accessibility-cause and mobility-effect), while in the second case is to hierarchize those relationships and therefore the hypotheses assumed. Additionally, global spatial correlations (Bivariate Moran I’s) are analyzed and global spatial regression model (lag and spatial error specifications) are estimated to assess the contribution of the spatial aspect in explaining the phenomenon. For the inequitable distribution problem, the analysis is focused on the local causal relationships of critical areas. Bivariate LISA cluster maps for each cause and effect indicators are assessed to see if the assumed hypothesis remain valid for each critical area or if evidences of new causal relationships are found.
5 Strategic Assessment of Unequal and Inequitable Problems
of Accessibility and Mobility: the Lisbon Case
as a 338 grid zoning layer for Lisbon in 2003. Socioeconomic data from the Portuguese Census (INE2002) and from the Ministry of Economy (GEE/ME 2011), as well as mobility data from the Lisbon’s Urban Mobility Plan (CML2005), were added to this database. Information resulting from the network modeling (e.g., travel times, travel distances, waiting times, number of transfers, etc.) performed in TransCAD 6.0 were also included. For the spatial analysis, the software Geoda 1.6.7 was used to estimate univariate and bivariate global and local statistics of spatial association for the accessibility and mobility indicators considered, as well as to calibrate the spatial regression models.
5.1 Characterizing Accessibility and Mobility Distributions
To represent job accessibility and mobility in Lisbon, a location-based (potential) indicator and a demand-based (trip amount) indicator were used, respectively. A potential indicator of job accessibility (Eq. 1) was chosen with the purpose of representing the potential accessibility to job places in Lisbon considering a logistic distance-decay function (Eq.2). The choice for this function was due to the fact that it represents with more accuracy, and specially for short distance trips, the spatial interactions for both private and public modes in Lisbon, as demonstrated by the calibration performed by Martínez and Viegas (2013) (Fig.4). The mobility measure, in turn, was a straightforward trip amount indicator representing the total number of trips per person produced in the morning peak period (7:00–10:00), both by private car (PC) and public transport (PT), in each zone of analysis.
Ai;m¼
∑ R Tij
Ej
∑Ej
ð1Þ
Ai,m=job accessibility of zoneiby modem,beingm PTorPC;
Ej=number of jobs offered in zonej;
R(x)=value of the Richards or generalized logistic curve for the total travel timex
R Tij¼Cþ
K−C
1þQe−B Tð ij−MÞ
1=v ð2Þ
C= minimum function value;
K= upper limit or carrying capacity when C = 0;
B= growth rate (equivalent to theβof the exponential function); v= affects near which asymptote growth occurs;
Q= depends on the value of R (0);
Ti,j=generalized travel time including access/egress time, in-vehicle time, transfer
time and waiting time between zoneiandj; M=Ti,jvalue of the maximum growth ifQ=v.
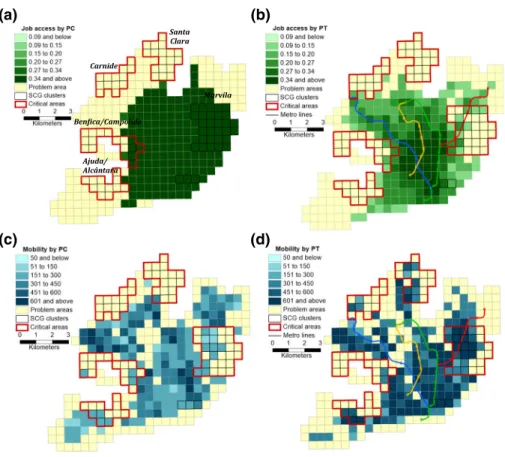
The analysis of the job accessibility indicator, from the unequal distribution prob-lem perspective, indicated that Lisbon presents an unequal distribution of job accessi-bility by PC and PT (Fig.4a to d), with job accessibility levels by PC being overall considerably higher than by PT. This is in part explained by the fact that, in average, PC travel times in Lisbon are less than half of PT travel times (17 min vs 45 min). In the case of job accessibility by PT, the strong influence of the subway network in the spatial distribution of the indicator is noticeable, with all zones where subway stations are located presenting high levels of job accessibility, when compared with their neighbor zones. Nevertheless, in both cases, the highest levels of job accessibility are found in the city center, where there is the highest concentration of jobs, while the periphery presents the lowest levels. Such spatial patterns are corroborated by the fact that job accessibility indicators are spatially auto-correlated as indicated by their significant (p≤0.05) Global I Moran values:IM_APC= 0.94 (pseudop-value = 0.001) andIM_APT= 0.85 (pseudo
p-value = 0.001) (Fig.4e and f). Locally, this association is expressed through the presence of large clusters of high job accessibility in the Central area and some smaller clusters of low accessibility in the fringes of the city for both modes.
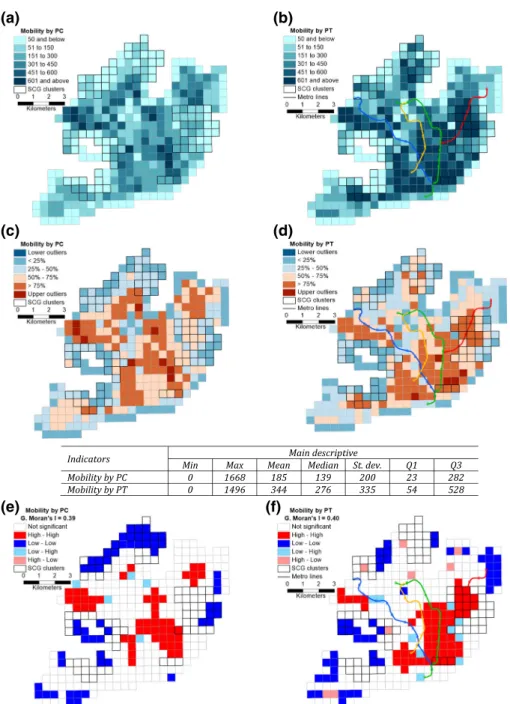
Regarding mobility, Lisbon also presents an unequal spatial distribution by modes, despite more dispersed when compared to the job accessibility problem (Fig.5a to d). In general, mobility by PC is lower than by PT, with the former presenting high values in the city center and in the northwest region, while the latter showing a more dispersed pattern, but still with a noticeable positive relation with the subway network. Mobility is also spatially auto-correlated, but presents lower values of Global Moran’s I if compared to accessibility: IM_TMPC= 0.39 (pseudo p-value = 0.001) and IM_TMPT =
0.40 (pseudo p-value = 0.001) (Fig.5e and f). Locally, the spatial behavior of both mobility by PC and PT is characterized by the presence of one large cluster of high mobility in the city center and one minor cluster in the northwest region, one of the most populated regions in the city. Mobility by PC also presents two more upper clusters in the north region and both mobility by PC and PT present several lower clusters distributed in the periphery.
From the inequitable distribution problem perspective, job accessibility and mobility present inequitable distributions as the SCG considered is mostly located in regions with low levels of both accessibility and mobility (Figs.5and6). The SCG, in this case, is represented by the clusters of high concentration of low-educated population (percentage of people with just the first cycle of education completed). This variable was chosen to represent the SCG as there is no information available regarding income levels for Lisbon population, which prevented us to consider the low-income population as our SCG.
located in the upper north region, despite the low levels of accessibility by PT, seems to not have its mobility by PT hampered. On the other hand, the SGC cluster located in the east region is characterized by a distinctive situation, in which the job accessibility by PC are high and mobility by PC are low, while job accessibility by PT are low and mobility by PT are high, configuring a possible state of public transportation captivity.
Indicators Main descriptive
Min Max Mean Median St. dev. Q1 Q3
Job accessibility by PC 0.09 0.71 0.36 0.33 0.17 0.21 0.51 Job accessibility by PT 0.01 0.48 0.16 0.13 0.11 0.08 0.22
(c)
(a) (b)
(e)
(d)
f)
5.2 Diagnosing Accessibility and Mobility Problems
For diagnosing accessibility and mobility problems, a set of statistical and spatial reference parameters were considered. For the unequal distribution problem,
Indicators Main descriptive
Min Max Mean Median St. dev. Q1 Q3 Mobility by PC 0 1668 185 139 200 23 282 Mobility by PT 0 1496 344 276 335 54 528
(a) (b)
(c) (d)
(e) (f)
sufficiency parameters were chosen based on the statistical distributions of the indica-tors, and having the median values as the criteria for its establishment. These param-eters allowed the identification of areas where the differences in job accessibility and mobility along the space are more accentuated, and below the threshold of sufficiency (problem areas - yellow zones). In the case of job accessibility (Fig.6a and b), these zones are located along all the periphery of the city for both PC and PT, while for mobility insufficient level zones are more dispersed along the city area, although still with a large concentration of them in the periphery (Fig.7c and d).
For the inequitable distribution problem, the SCG clusters previously defined were considered as the egalitarian parameter. Confirming the characterization analysis, it was possible to verify that five SCG clusters (Santa Clara, Carnide, Marvila, Benfica/ Campolide and Ajuda/Alcântara) overlap with zones of insufficient levels of accessi-bility and moaccessi-bility by both modes, indicating a possible association between the two phenomena in the case of the low-educated group (Fig.7a to d). One exception is the small SCG cluster located in the southeast region that presents neither accessibility nor mobility insufficient levels. Additionally, considering only mobility it is possible to note that the inequitable distribution problem is more accentuated for PC, with the five SCG clusters matching a greater number of insufficient mobility zones for this mode than for PT, especially in Santa Clara and Marvila areas. This can be an indication that the low educated groups located in these areas are trying to overcome their PC mobility
Santa Clara
Carnide
Marvila
Ajuda/ Alcântara Benϔica/Campolide
(a)
(c) (d)
(b)
problems by using PT modes for their daily travels. In relation to accessibility, the inequitable distribution problem is accentuated for both modes except for the Marvila area that has no zones of insufficient levels. This dissociation between accessibility and mobility in that area can be considered as a sign of the need to investigate other possible causes for PC mobility problem related to the individual characteristics of the SGC considered.
To further investigate the causal relationships behind these problems from an unequal distribution point of view, global non-spatial and spatial correlations, as well as regression models for accessibility and mobility were estimated. Firstly, the causes for job accessibility levels were assessed considering a set of indicators that were chosen according to the data available, as follow: i) network topology indicators:road
network integrity (R_INT) - an integration space syntax indicator measured by the
number of turns that have to be made from a street segment (link) to reach all other segments in the network, using shortest path aggregated for each zone; and public transport node closeness(PT_CLOSE)- measured by the inverse of the sum of the distances (shortest paths) between a node and all other nodes in the network for each zone; ii) operational characteristics indicators:PT coverage (PT_COVER)- measured by the total number of PT stops/stations weighted by normative walking distances of 400 m and 800 m respectively in each zone; andPT frequency (PT_FREQ)- measured by the average frequency (numbers of vehicles per hour) of all public transport modes (bus, tram, metro and train) available in each zone; iii) land-use indicator:jobs-workers
mixture (JW_MIX)- measured by the ratio between job places available and resident
workers in each zone.
Considering these indicators and the general assumption that accessibility is influ-enced by transport (network configuration and operational aspects) and land-use characteristics, a set of hypotheses were formulated and tested through the estimation of correlations and regressions models:
& HAPC1: The lower the level of road network integration, the lower the level of
accessibility by PC
& H APC2: The lower the level of jobs-workers mixture, the lower the level of
accessibility by PC
& H APT3: The lower the level of network node closeness, the lower the level of
accessibility by PT
& HAPT4: The lower the level of PT coverage, the lower the level of accessibility by PT
& HAPT5: The lower the level of PT frequency, the lower the level of accessibility by PT
& H APT6: The lower the level of jobs-workers mixture, the lower the level of
accessibility by PT
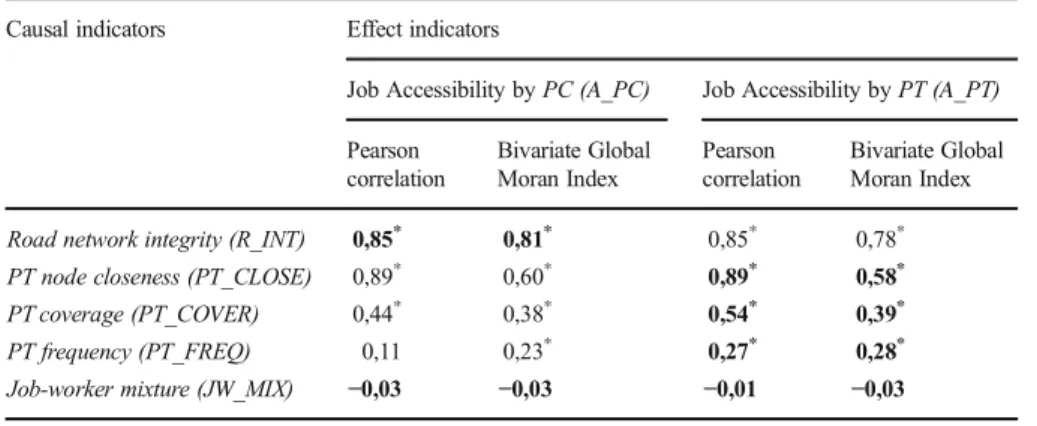
levels of job accessibility by PT. Spatially, these correlations measured by the Bivariate Global Moran’s I are generally somewhat less strong, but presenting the same relative levels of influence in job accessibilities when compared with Pearson correlations.
Non-spatial log-log specifications considering all possible combination of causal indicators were tested for both PC and PT. These transformations were performed to increase the models fit and their statistical properties, but also and more importantly to compensate the inequities in the indicators’ highly skewed distributions. Besides, a separate set of grid zones for each model was considered, instead of the original 338 zones, as to avoid the consideration of zones with null values after the logarithm transformation. The chosen non-spatial models (Table2) were the ones with the highest R2including only significant variables (p≤0.05) without multicollinearity. Alternative spatial error log-log specifications were also estimated according to the results of Lagrange Multiplier tests. The modeling results indicated that spatial specifications for both PC and PT presented a higher predictive capacity than the non-spatial specifications (higher Log-likelihood and lower AIC and SC). Additionally, the values of the Moran’s I test value indicate that the spatial dependence of the residuals were removed by the inclusion of a spatial variable in the models.
Regarding the predictive variables included in the job accessibility by PC models (Table2), only road network integrity was significant at 5% (p≤0.05) indicating the strong influence of the network configuration on PC accessibility levels. In the case of job accessibility by PT, all causal indicators were significant at 5% (p≤0.05), withPT
node closenesspresenting the highest weight (based on the standardized β) and also
indicating the strong influence of the network characteristics. PT coverage and
fre-quencywere the following two indicators with high weights demonstrating the effect of
micro accessibility, such as walking distances and waiting time aspects, on the overall levels of job accessibility by PT. Finally,jobs-workers mixturewas the least influential of the indicators with its positive impact indicating that a higher proportion of jobs in relation to workers in a zone increases the PT accessibility levels in that zone.
Diagnosing now the mobility causal relationships, two causal indicators were considered: job accessibility (A_PC and A_PT) and car ownership (CAR_OWN) measured by the number of vehicles owned by the residents in each zone, to be used
Table 1 Accessibility correlations
Causal indicators Effect indicators
Job Accessibility byPC (A_PC) Job Accessibility byPT (A_PT)
Pearson correlation
Bivariate Global Moran Index
Pearson correlation
Bivariate Global Moran Index
Road network integrity (R_INT) 0,85* 0,81* 0,85* 0,78*
PT node closeness (PT_CLOSE) 0,89* 0,60* 0,89* 0,58*
PT coverage (PT_COVER) 0,44* 0,38* 0,54* 0,39*
PT frequency (PT_FREQ) 0,11 0,23* 0,27* 0,28*
Job-worker mixture (JW_MIX) −0,03 −0,03 −0,01 −0,03
Accessibility by private car(logA_PC) Accessibility by public transport(logA_PT)
Variables Non-spatial Spatial error Variables Non-spatial Spatial error
β βstd t-stat p-value β z-value p-value β βstd t-stat p-value β z-value p-value
Constant 1,04 17,95 0,00 -0,24 −1,80 0,07 Constant 0,45 5,70 0,00 0,42 3,75 0,00
logR_INT 2,21 0,84 26,51 0,00 0,50 5,95 0,00 logPT_CLOSE 2,39 0,78 30,45 0,00 2,26 15,88 0,00
logJW_MIX −0,01 −0,38 −1,19 0,23 0,003 0,90 0,37 logPT_COVER 0,12 0,14 5,85 0,00 0,09 5,45 0,00
λ(1)
– – – – 0,98 128,35 0,00 logPT_FREQ 0,41 0,15 6,09 0,00 0,38 5,61 0,00
logJW_MIX 0,05 0,13 5,17 0,00 0,02 2,24 0,02
λ(1) – – – – 0,69 12,66 0,00
R2 0,69 0,97 R2 0,84 0,89
Log-likelihood 214,09 540,75 Log-likelihood 244,45 282,56
AIC −422,17 −1075,50 AIC −478,89 −555,13
SC −410,94 −1064,28 SC −460,56 −536,79
Moran’s I test 0,79 −0,04(2) Moran
’s I test 0,32 −0,02(2)
p-value 0,00 p-value 0,00
Likelihood ratio test 653,33 Likelihood ratio test 76,21
p-value 0,0 p-value 0,00
(1) Spatial regressor considered only in the spatial specification (2) Moran’s I statistic for the spatial error model residuals
G
ar
ci
a
C
.
S
.
H
.
F
.
et
al
as an income proxy. The choice of these indicators was based on the previously established assumptions (Fig. 1) that mobility is influenced by accessibility, as well as by the individual characteristics. As in the case of accessibility, a set of hypotheses to be tested was also formulated as follows:
& HMPC1: The lower the level of accessibility by PC, the lower the level of mobility by
PC
& HMPC2: The lower the level of car ownership, the lower the level of mobility by PC
& HMPT3: The lower the level of accessibility by PT, the lower the level of mobility by
PT
& HMPT4: The lower the level of car ownership, the higher the level of mobility by PT
Non-spatial and spatial correlations between mobility and job accessibility are moderately for both PC and PT (Table 3) suggesting that accessibility positively impacts mobility. Car ownership, in turn, is strongly correlated with both PC and PT mobility. The strong influence of car ownership in mobility by PC is expected, however for PT mobility the result indicates a different relationship with a direct and not an inverse association as expected. Moreover, the spatial correlations measured by the Bivariate Global Moran’s I are also less strong, especially the ones between car ownership and mobility, which may indicate that level of income is not a crucial aspect for Lisbon mobility.
Regarding mobility by PC and PT models (Table 4), estimated using the same method for accessibility models, both predictive variables were statistically significant
withcar ownershippresenting a higher weight (based on the standardizedβ) in mobility
explanation than job accessibility. These results are coherent with the hypotheses considered, especially for private car mobility. However, in the case of public transport mobility the positive signal ofcar ownershipcan be an indication that possession of car in Lisbon as an income proxy is not a good explanatory variable for mobility and that the population that owns a car also uses public transport for other reasons than budget constraints, such as parking shortage or time restraints.
Finally, considering the causal relationships from an inequitable point of view, the hypotheses formulated for both job accessibility and mobility were examined
Table 3 Mobility correlations
Causal indicators Effect indicators
Mobility by PC (M_PC) Mobility by PT (M_PT)
Pearson correlation
Bivariate Global Moran Index
Pearson correlation
Bivariate Global Moran Index
Job Accessibility by PC (A_PC) 0,35* 0,32* 0,47* 0,43*
Job Accessibility by PT (A_PT) 0,44* 0,37* 0,44* 0,39*
Car ownership (CAR) 0,83* 0,30* 0,71* 0,24*
Variables Mobility by private car (logM_PC) Variables Mobility by public transport (logM_PT)
Non-spatial Spatial error Non-spatial Spatial error
β βstd t-stat p-value β z-value p-value β βstd t-stat p-value β z-value p-value
Constant 0,83 10,07 0,00 0,93 8,46 0,00 Constant 1,35 13,89 0,00 1,37 11,44 0,00
logA_PC 0,39 0,15 4,48 0,00 0,54 3,36 0,00 logA_PT 0,45 0,20 6,14 0,00 0,52 4,96 0,00
logCAR 0,61 0,79 20,06 0,00 0,59 24,63 0,00 logCAR 0,59 0,77 23,66 0,00 0,60 24,47 0,00
λ(1) – – – 0,58 8,73 0,00 λ(1) – – – 0,45 5,88 0,00
R2 0,71 0,77 R2 0,72 0,75
Log-likelihood −82,24 −54,26 Log-likelihood −87,98 −74,12
AIC 170,47 114,51 AIC 181,96 154,25
SC 181,49 125,53 SC 193,00 165,29
Moran’s I test 0,29 −0,02(2) Moran
’s I test 0,19 −0,01(2)
p-value 0,00 p-value 0,00
Likelihood ratio test 55,96 Likelihood ratio test 27,71
p-value 0,00 p-value 0,00
(1) Spatial regressor considered only in the spatial specification (2) Moran’s I statistic for the spatial error model residuals
G
ar
ci
a
C
.
S
.
H
.
F
.
et
al
for each critical area through the analysis of bivariate LISA cluster maps. For each critical area, evidences of the correlation between the cause and effect indicators were sought. For example, in theCarnidecritical area, zones were found with low levels of job accessibility by PC that also presented low levels of road network integration and zones with low levels of mobility by PC that also have low levels of job accessibility by PC (Fig.8).
A total of ten maps were produced for each hypothesis considered and the results are summarized in Table5. Only for hypothesesHAPT6,HMPC2 and HMPT3
were found significant evidences for all critical areas, which allows to infer that for those areas: i)jobs-workers mixdoes influence on accessibility by PT; ii) car ownership does impact mobility by PC; and iii) accessibility by PT does affect mobility by PT. Additionally, for the other critical areas, significant evidences for the remain hypotheses were also found, with exception of the HMPT4 which
corroborates the global results and indicates that for the majority of them network, operational and land-use characteristics do influence accessibility as well as accessibility do influence mobility.
Santa Clara
Carnide
Marvila
Ajuda/ Alcântara Benϔica/Campolide
(a) (b)
Fig. 8 Bivariate LISA maps of cause and effect indicators
Table 5 Hypotheses for critical areas
Critical areas HAPC1 HAPC2 HAPT3 HAPT4 HAPT5 HAPT6 HMPC1 HMPC2 HMPT3 HMPT4
SCG Northwest–Carnide X X X X X X X X X SCG North–Santa Clara X X X X X X X X X
SCG East–Marvila X X X
SCG Southwest–
Alcantara/Ajuda
X X X X X X X X
SCG West–
Benfica/Campolide
6 Conclusions
The urban mobility planning field has experienced a series of changes over the past decades, with the most recent one being the accessibility planning paradigm. This new paradigm has positively reflected in the performance of the planning process, as well as in the quality of its results. However, some issues are still neglected in this field especially regarding the understanding of the UMS problematic and its framing within the planning process. The systematic analysis of the problems faced by UMS stakeholders, together with its cause and effect relationships, are often undervalued, what may have led to the proposal of solutions to the wrong problems. Therefore, to avoid such inefficiencies, much of the effort during the planning exercise should be focused on ways to envisage the problems and formulate the adequate objectives to solve them, rather than merely develop alternative solutions.
As a way to help planners to overcome such issues, a methodology for the strategic assessment of problems was proposed in this paper. It is based on the analysis of two categories of problems considered as universally identifiable: the unequal and inequitable distribution problems. These problems focus on two key strategic values related to UMS, accessibility and mobility, and reflect equity concerns, as well as the sufficientarianism and egalitarianism ethical theories. Additionally, it relies on exploratory and confirmatory spatial analysis techniques that allow considering the spatial aspect associated with urban phenomena, providing also the adequate means to quantitatively analyze them.
The results obtained through the application of the methodology for the Lisbon case, allowed to demonstrate its great potential for understating accessibility and mobility phenomena and therefore for supporting the formulation of strategic objectives and the development of more adequate solutions. More specifically, the performed analysis allowed a systematized assessment of the unequal and inequitable problems associated to these phenomena through the characterization of the indicators’distributions, as well as the diagnosis of the causes and effects of the problems. Both unequal and inequitable distributions of job accessibility and mobility were found in Lisbon, with a concentra-tion of problematic areas in the periphery of the city. This is a very common result in urban areas in which job offer is concentrated in their geographical center and social concern groups reside in the peripheries. However, in addition to these more general results, the methodology allowed also the identification of critical areas with specific behaviors for which interventions should be prioritized in order to achieve more equitable levels of accessibility and mobility.
Finally, in a planning and decision-making context, the value of the proposed method-ology is evident as it constitutes a robust tool that enables planners to have a better understanding of the urban accessibility and mobility problems from a strategic perspective. However, the need for some advances can be anticipated. First, from a methodological perspective, unsuitable and unsustainable distribution problems need to be included in the analyzes to provide a more complete overview of the phenomena. In this sense, new methods of analysis as well as indicators that better represent accessibility and mobility differences across modes and along time need be considered. For this, LUTI modelling have an important role by allowing the estimation of more adequate indicators for the assessment of unsuitable distribution problems and the comparison of different time scenarios in the case of unsustainable distribution problem assessment. Second, from a phenomenological per-spective, the next step in the case of Lisbon will be the implementation of anex-ante assessment of alternative solutions to the diagnosed problems. This evaluation will consider the same indicators and methods used in the assessment of problems, ensuring an alignment of the analyzes in these two different moments of the planning process and, therefore, more soundness to the strategic planning of accessibility and mobility in Lisbon.
Acknowledgments The authors wish to thank Fundação para a Ciência e a Tecnologia for financing the development of this PhD research through the scholarship SFRH/BD/ 60424/ 2009, the partnership funding support from CNPq, Conselho Nacional de Desenvolvimento Científico e Tecnológico, Brazil, and the valuable comments of Francisco Oliveira-Neto and two anonymous referees.
References
Arora A, Tiwari G (2007) A Handbook for Socio-economic Impact Assessment (SEIA) of Future Urban Transport (FUT) Projects. New Delhi
Banister D (2002) Transport Planning. Spon Press, London
Banister D (2008) The sustainable mobility paradigm. Transp Policy 15:73–80.https://doi.org/10.1016/j. tranpol.2007.10.005
Baradaran S, Ramjerdi R (2001) Performance of Accessibility Measures. Eur J Transport Stat 4:31–48 Beder S (2000) Costing the Earth: Equity, Sustainable Development and Environmental Economics. N Z J
Environ Law 4:227–243
Bertolini L, le Clercq F, Kapoen L (2005) Sustainable accessibility: a conceptual framework to integrate transport and land use plan-making. Two test-applications in the Netherlands and a reflection on the way forward. Transp Policy 12:207–220.https://doi.org/10.1016/j.tranpol.2005.01.006
Boschmann EE, Kwan MP (2008) Toward socially sustainable transportation: progress and pitfalls Int J Sustain Transp :138–157 doi:https://doi.org/10.1080/15568310701517265
Cervero R (2005) Accessible Cities and Regions: A Framework for Sustainable Transport and Urbanism in the 21st Century.eScolarship.http://escholarship.org/uc/item/27g2q0cx. Accessed 22 May 2016
Cervero R, Kockelman K (1997) Travel demand and the 3Ds: Density, diversity, and design. Transp Res Part D: Transp Environ 2:199–219.https://doi.org/10.1016/S1361-9209(97)00009-6
Cheng G, Zeng X, Duan L, Lu X, Sun H, Jiang T, Li Y (2016) Spatial difference analysis for accessibility to high level hospitals based on travel time in Shenzhen, China. Habitat Int 53:485–494.https://doi. org/10.1016/j.habitatint.2015.12.023
CML (2005) Lisboa: O desafio da mobilidade. Câmara Municipal de Lisboa - Licenciamento Urbanístico e Planeamento Urbano Lisboa
Condeço-Melhorado A, Christidis P (2017) Road Accessibility in Border Regions: a Joint Approach. Netw Spat Econ :1–21. doi:https://doi.org/10.1007/s11067-011-9153-z
Curtis C (2008) Planning for sustainable accessibility: The implementation challenge. Transp Policy 15:104–
Curtis C, Scheurer J (2010) Planning for sustainable accessibility: Developing tools to aid discussion and decision-making. Prog Plan 74:53–106.https://doi.org/10.1016/j.progress.2010.05.001
Derrible S, Kennedy C (2010) Characterizing metro networks: state, form, and structure. Transportation 37: 275–297.https://doi.org/10.1007/s11116-009-9227-7
Dou Y, Luo X, Dong L, Wu C, Liang H, Ren J (2016) An empirical study on transit-oriented low-carbon urban land use planning: Exploratory Spatial Data Analysis (ESDA) on Shanghai. China Habitat Int 53: 379–389.https://doi.org/10.1016/j.habitatint.2015.12.005
El-Geneidy A, Levinson D (2011) Place Rank: Valuing Spatial Interactions. Netw Spat Econ 11(4):643–659.
https://doi.org/10.1007/s11067-011-9153-z
Ewing R, Cervero R (2010) Travel and the Built Environment. J Am Plan Assoc 76:265–294.https://doi. org/10.1080/01944361003766766
Feitelson E (2002) Introducing environmental equity dimensions into the sustainable transport discourse: issues and pitfalls. Transp Res Part D: Transp Environ 7:99–118.https://doi.org/10.1016/s1361-9209(01)00013-x
Garcia CSHF (2016) Strategic Assessment of Accessibility on Urban Mobility Networks. Ph.D. thesis, Instituto Superior Técnico - Univerisdade de Lisboa
GEE/ME (2011) Quadros de Pessoal. Gabinete de Estratégias e Estudos - Ministério da Economia, Lisboa Geurs KT, van Wee B (2004) Accessibility evaluation of land-use and transport strategies: review and research
directions. J Transp Geogr 12:127–140.https://doi.org/10.1016/j.jtrangeo.2003.10.005
Goulias KG (2003) Transportation Systems Planning: Methods and Applications. In: Goulias KG (ed) Transportation Systems Planning. CRC Press LLC, pp 17–61
Grengs J (2001) Does Public Transit Counteract the Segregation of Carless Households? Measuring Spatial Patterns of Accessibility. Transport Res Rec: J Transport Res Board 1753:3–10.https://doi.org/10.3141/1753-01
Griffith DA, Chun Y (2015) Spatial Autocorrelation in Spatial Interactions Models: Geographic Scale and Resolution Implications for Network Resilience and Vulnerability. Netw Spat Econ 15(2):337–365.
https://doi.org/10.1007/s11067-014-9256-4
Halden D (2009) 10 years of Accessibility Planning in the UK—What has been achieved? In European Transport Conference-Association of European Transport, Amsterdam
Handy SL (2005) Planning for Accessibility: in theory and in practice. In: Access to Destination. 1st edn. Elsevier, pp 131–147
Hansen WG (1959) How accessibility shapes land-use. J Am Inst Plann 25(2):73–76
Horn RV (1993) Statistical indicators for the economic and social sciences. Press Syndicate of the University of Cambridge, Cambridge
INE (2002) Censos 2001 Resultados Definitivos - Portugal. Instituto Nacional de Estatística, Lisboa Jeon CM (2007) Incorporating Sustainability into Transportation Planning and Decision Making: Definitions,
Performance Measures and Evaluation. PhD, Georgia Institute of Technology
Jones P, Lucas K (2012) The social consequences of transport decision-making: clarifying concepts, synthesising knowledge and assessing implications. J Transp Geogr 21:4–16.https://doi.org/10.1016/j.jtrangeo.2012.01.012
Kenworthy J (2007) Urban Planning and Transport Paradigm Shifts for Cities of the Post-Petroleum Age. J Urban Technol 14:47–70.https://doi.org/10.1080/10630730701531708
Levine J, Garb Y (2002) Congestion pricing's conditional promise: promotion of accessibility or mobility? Transp Policy 9:179–188.https://doi.org/10.1016/s0967-070x(02)00007-0
Li H, Wang Q, Shi W, Deng Z, Wang H (2015) Residential clustering and spatial access to public services in Shanghai. Habitat Int 46:119–129.https://doi.org/10.1016/j.habitatint.2014.11.003
Litman T (2017) Evaluating Transportation Equity: Guidance For Incorporating Distributional Impacts in Transportation Planning. Victoria Transport Policy Institute.http://www.vtpi.org/equity.pdf. Accessed 10 July 2017
Lucas K, van Wee B, Maat K (2015) A method to evaluate equitable accessibility: combining ethical theories and accessibility-based approaches. Transportation :1–18. doi:https://doi.org/10.1007/s11116-015-9585-2
Macário R (2005) Quality management in urban mobility systems: an integrated approach. PhD thesis, Instituto Superior Técnico - Universidade de Lisboa
Macário R (2007) What is Strategy in Urban Mobility Systems? In: 10th Conference on Competition and Ownership in Land Passenger Transport - Thredbo, Hamilton Island, Australia
Macário R (2014) Access as a social good and as an economic good: is there a need of paradigm shift? In: Sclar, E. et al. (ed) Urban Access for the 21 st Century, Finance and Governance Models for Transport Infrastructures. New York, NY, pp 87–115
Martens K, Golub A, Robinson G (2012) A justice-theoretic approach to the distribution of transportation benefits: Implications for transportation planning practice in the United States. Transp Res A Policy Pract 46:684–695.https://doi.org/10.1016/j.tra.2012.01.004
Martínez LM, Viegas JM (2013) A new approach to modelling distance-decay functions for accessibility assessment in transport studies. J Transp Geogr 26:87–96.https://doi.org/10.1016/j.jtrangeo.2012.08.018
Meyer L (2014) Intergenerational Justice. In: Zalta EN (ed) The Stanford Encyclopedia of Philosophy.
https://plato.stanford.edu/archives/win2014/entries/justice-intergenerational/. Accessed 15 Feb 2014 Meyer LH, Roser D (2009) Enough for the future. In: Gosseries A, Meyer LH (eds) Intergenerational Justice.
Oxford University Press, Oxford
Mondschein A, Taylor BD, Brumbaugh S (2011) Congestion and accessibility: what's the relationship?. eScolarship.http://escholarship.org/uc/item/6bh2n9wx. Accessed 5 April 2012
Moya-Gómez B, Salas-Olmedo MH, García-Palomares JC, Gutiérrez J (2017) Dynamic accessibility using big data: the role of the changing conditions of network congestion and destination attractiveness. Netw Spat Econ :1–18. doi:https://doi.org/10.1007/s11067-017-9348-z
Novak DC, Hodgdon C, Guo F, Aultman-Hall L (2011) Nationwide Freight Generation Models: A Spatial Regression Approach. Netw Spat Econ 11(1):23–41.https://doi.org/10.1007/s11067-008-9079-2
Parthasarathi P, Hoschmair H, Levison D (2009) The Influence of Network Structure on Travel Distance. SSRN. doi:https://doi.org/10.2139/ssrn.1736326
Primerano F and Michael APT (2005) An Accessibility Framework for Evaluating Transport Policies. Access Destinations :325–346
Ramos RAR, Silva ANR (2003) A data-driven approach for the definition of metropolitan regions. In: International Conference on Computers in Urban Planning and Urban Management., Sendai, Japan Rawls J (1971) A Theory of Justice. Harvard University Press, Boston
Reggiani A, Bucci P et al (2011) Accessibility and Network Structures in the German Commuting. Netw Spat Econ 11(4):621–641.https://doi.org/10.1007/s11067-010-9149-0
Reggiani A, Martín JC (2011) Guest Editorial: New Frontiers in Accessibility Modelling: An Introduction. Netw Spat Econ 11(4):577–580.https://doi.org/10.1007/s11067-011-9155-x
Salomon I, Mokhtarian PL (1998) What happens when mobility-inclined market segments face accessibility-enhancing policies? Transp Res Part D: Transp Environ 3(3):129–140
Tsiotas D, Polyzos S (2017). The Complexity in the Study of Spatial Networks: an Epistemological Approach. Netw Spat Econ :1–32. doi:https://doi.org/10.1007/s11067-017-9354-1
Uteng TP (2007) Social sustainability in the transport sector: an essential requisite for sustainable mobility. Int J Environ Sustain Dev 6:113–135.https://doi.org/10.1504/ijesd.2007.014198
Vallance S, Perkins HC, Dixon JE (2011) What is social sustainability? A clarification of concepts. Geoforum 42:342–348.https://doi.org/10.1016/j.geoforum.2011.01.002
van Wee B (2002) Land use and transport: research and policy challenges. J Transp Geogr 10:259–271.
https://doi.org/10.1016/S0966-6923(02)00041-8
van Wee B, Geurs KT (2011) Discussing Equity and Social Exclusion in Accessibility Evaluations. Eur J Transp Infrastruct 11:350–367
Weiss EB (1992) In Fairness To Future Generations and Sustainable Development American University International. Law Rev 8:19–26
Wolf C (2009) Climate change and climate policies. In: Gosseries A, Meyer LH (eds) Intergenerational Justice. Oxford University Press, Oxford