2018
MAX ALBERTO
LOPEZ MACIEL
Avaliação dos fatores que influenciam a adoção e
difusão de soluções baseadas na natureza em áreas
urbanas
Assessment of factors influencing the adoption and
diffusion of Nature-Based Solutions in urban areas
2018
MAX ALBERTO
LOPEZ MACIEL
Avaliação dos fatores que influenciam a adoção e
difusão de soluções baseadas na natureza em áreas
urbanas
Assessment of factors influencing the adoption and
diffusion of Nature-Based Solutions in urban areas
Dissertação apresentada à Universidade de Aveiro para cumprimento dos requisitos necessários à obtenção do grau de maestro em estudos ambientais/ JEMES–CiSu sob a orientação científica do Doutor Peter Roebeling, Professor Auxiliar Convidado, Universidade de Aveiro e com apoio de atividades curriculares pelo Dr. Abel Chávez, Western State Colorado University.
This thesis was developed in the context of the UNaLab Project (https://www.unalab.eu/), undertaken by a consortium led by VTT and in which the UA is consortium partner as well as work package leader (Monitoring and impact assessment). The UNaLab Project has received funding from the European Union Horizon 2020 research and innovation programme under Grant Agreement No. 730052, Topic: SCC-2-2016-2017: Smart Cities and Communities Nature based solutions.
o júri
Presidente Prof. Doutora Maria Isabel, da Silva Nunes
Professora Auxiliar do Departamento de Ambiente e Ordenamento da Universidade de Aveiro
Vogal-arguente principal Prof. Doutor José Carlos Baptista da Mota
Professor Auxiliar do Departamento de Ciências Sociais, Políticas e do Território da Universidade de Aveiro
Vogal-orientador Prof. Doutor Peter Cornelis Roebeling
Professor Auxiliar Convidado, do Departamento de Ambiente e Ordenamento da Universidade de Aveiro
agradecimentos
acknowledgements
I would like to extend all my gratitude to:
All my family, especially to my mother, my brother and my aunt Gladys. To the JEMES-CISU coordinators Maria Rosa Rovira and Martin Lehman for their support in difficult times. To the JEMES coordinator in UA, Isabel da Silva Nunes, who has always been attentive to the students. To my supervisor Peter C. Roebeling, for his constant guidance through all this process. To Abel Chavez coordinator of the activities in the WSCU, a great example as a person and as an academic, for all his support. To Eva Maria Holzer for her kind support and motivation. To Bauke de Vries, Mayke van Dinter and Luuk Postmes who made possible the realization of the workshops in the city of Eindhoven.
And last, to the JEMES-CISU colleagues and the working group in UA who have been friends and family during these two years.
palavras-chave
Soluções baseadas na natureza, Resiliência, Áreas urbanas, Adoção, Difusão, Telhados verdes, Stakeholders.resumo
Nas cidades por todo o mundo, há uma tendência geral de aumentar o seu tamanho nas próximas décadas, o que leva a um aumento não só da população, mas também no aparecimento de impactos ambientais urbanos, bem como a probabilidade de se tornarem áreas vulneráveis devido ao efeito do clima. Nesse sentido, é essencial aumentar a sua resiliência, o que lhes permitirá enfrentar os efeitos da mudança do clima. Uma estratégia que permitirá uma adaptação e mitigação é a implementação de soluções baseadas na natureza. No entanto, o seu nível de sucesso como política implementada em comunidades urbanas depende de uma série de fatores relacionados com o seu nível e tempo de adoção. O presente estudo propõe uma metodologia para avaliar esses fatores, através da criação de um workshop participativo e do uso potencial de uma ferramenta, inicialmente desenvolvida para o setor agrícola, conhecida como ADOPT, que pode serusada para avaliar o nível de adoção
e taxa de difusão de soluções baseadas na natureza. Para testar a adaptação desta ferramenta, do governo local, foi usado para o caso de estudo da cidade de Eindhoven, na Holanda, que é uma das principais cidades do projeto UNaLab, patrocinado pela Comissão Europeia, que reúne evidências do nível de eficácia, implementação e replicação de soluções baseadas na natureza em áreas urbanas. Para o caso de Eindhoven, foi medido explicitamente o nível de adoção e taxa de difusão de telhados verdes com a participação de partes interessadas dos setores académico e do governo local. Dando como resultado, cenários de adoção de 12% e 49%, respetivamente, constatando que uma participação diversificada de diferentes partes interessadas influência a percepção da adoção potencial dessa inovação em comparação com uma resposta individual.
keywords
Nature-Based Solutions, Resilience, Urban Areas, Adoption, Diffusion, Green Roofs, Stakeholders.abstract
In cities around the world, there is a general tendency to increase their size in the coming decades, which leads to an increase not only in population but also in the generation of urban environmental impacts, as well as the probability of becoming vulnerable areas due to the effects of climate change. In this sense, it is essential to increase their resilience, which will permit them to face the effects of climate change. A strategy that allows taking common measures of adaptation and mitigation approaches is the implementation of Nature-based Solutions. However, its level of success as a policy implemented in urban communities depends on a series of factors related to their level and time of adoption. This study proposes a methodology for evaluating these factors, through the creation of a participatory workshop and the potential use of a tool, initially developed for the agricultural sector, known as ADOPT, which could be used to evaluate the level of adoption and rate of diffusion of Nature-based Solutions. In order to test the adaptation of this tool, it was used for the case study of the city of Eindhoven in the Netherlands, which is one of the front-runner cities of the UNaLab project, sponsored by the European Commission, which gathers evidence of the level of effectiveness, implementation and replication of Nature-based Solutions in urban areas. For the case of Eindhoven, it was explicitly measured the level of adoption and rate of diffusion of green roofs with the participation of stakeholders from the academic and local government sectors. Giving as a result, scenarios of adoption of 12% and 49% respectively finding that a diverse participation of different stakeholders influences the perception of the potential adoption of this innovation in comparison with an individual answer.xv
Table of Content
List of Figures_________________________________________________________________________XVII List of Tables__________________________________________________________________________XIX1
Introduction __________________________________________________________ 1
1.1
Problem description _____________________________________________________ 1
1.2
Nature-based Solutions __________________________________________________ 3
1.3
State of Knowledge ______________________________________________________ 4
1.4
Objectives _____________________________________________________________ 8
1.5
The UNaLab project______________________________________________________ 8
1.6
Thesis Outline _________________________________________________________ 10
2
Adoption and Diffusion Theory and Applications ___________________________ 11
2.1
Theory of adoption and diffusion of innovations _____________________________ 11
2.2
Applications of the adoption and diffusion theory. ___________________________ 14
2.3
Evolutions of the adoption and diffusion theory. _____________________________ 14
3
Methodology ________________________________________________________ 15
3.1
Literature review _______________________________________________________ 15
3.2
Comprehensive analysis of the ADOPT tool__________________________________ 16
3.3
Adaptation of the ADOPT to the NBS context ________________________________ 21
3.4
Development of a structured elicitation process _____________________________ 21
3.5
Implementation of a participatory workshop ________________________________ 24
3.6
Results analysis ________________________________________________________ 24
3.7
ADOPT-NBSs __________________________________________________________ 24
3.7.1 Relative advantage for the population ________________________________________ 28 3.7.2 Learnability characteristics of innovation ______________________________________ 33 3.7.3 Population-specific Influences on the Ability to Learn About the innovation ________ 35 3.7.4 Relative Advantage of the innovation. ________________________________________ 384
Results _____________________________________________________________ 45
4.1
Results from the first round in the Tu/e. ____________________________________ 45
4.2
Results from the second round in the Tu/e. _________________________________ 49
4.3
Question values that changed from round 1 to round 2 (Tu/e). __________________ 53
4.4
Eindhoven Municipality first round: ________________________________________ 53
4.5
Eindhoven Municipality second round ______________________________________ 58
4.6
Question values that changed from round 1 to round 2 (Municipality of Eindhoven) 61
xvii
5
Discussion __________________________________________________________ 63
6
Conclusions _________________________________________________________ 65
References _____________________________________________________________ 67
Appendix A _____________________________________________________________ 73
Appendix B _____________________________________________________________ 74
Appendix C _____________________________________________________________ 87
Appendix D _____________________________________________________________ 88
Appendix E _____________________________________________________________ 91
Appendix F _____________________________________________________________ 92
Appendix G _____________________________________________________________ 99
xix
List of Figures
Figure 1. Diagram of Nature-based solutions (source: Seddon, 2018). ... 3
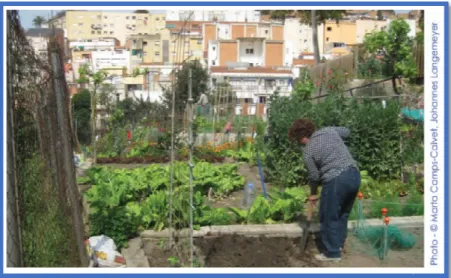
Figure 2. Urban Garden, Barcelona, Spain (source: Raymond et al., 2017, pp. 36). ... 5
Figure 3. The Queen Elizabeth Olympic Park, before and after its regeneration (source: Directorate-General for Research and Innovation-EC, 2015, pp 9). ... 6
Figure 4. Panoramic view of some green and blue spaces in Vienna, Austria (source: Raymond et al., 2017, pp. 32). ... 6
Figure 5. Gaps in the knowledge related to NBSs (Kabisch et al., 2016, pp. 6). ... 7
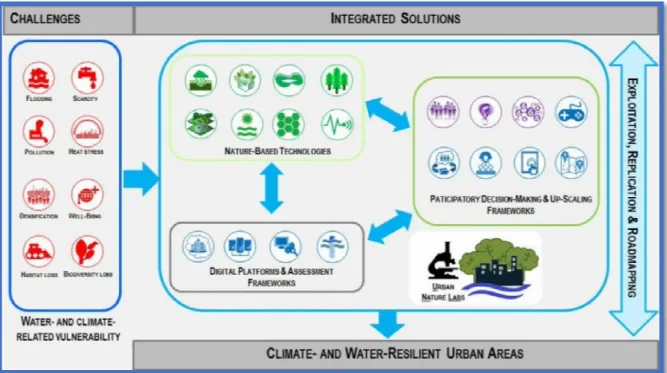
Figure 6. UNaLab project approach (Source: https://twitter.com/UNaLab_EU/media, 2017). ... 9
Figure 7. Thesis outline diagram. ... 10
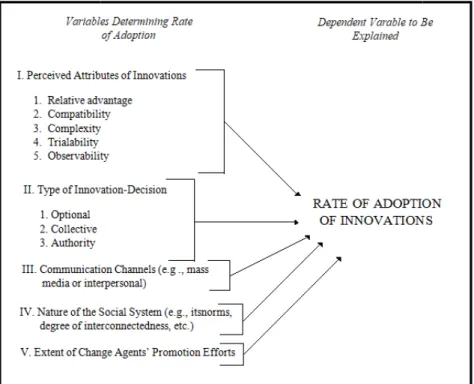
Figure 8. Variables that are measuring the rate of adoption of an innovation (Source: Rogers, 1983, p.233). ... 11
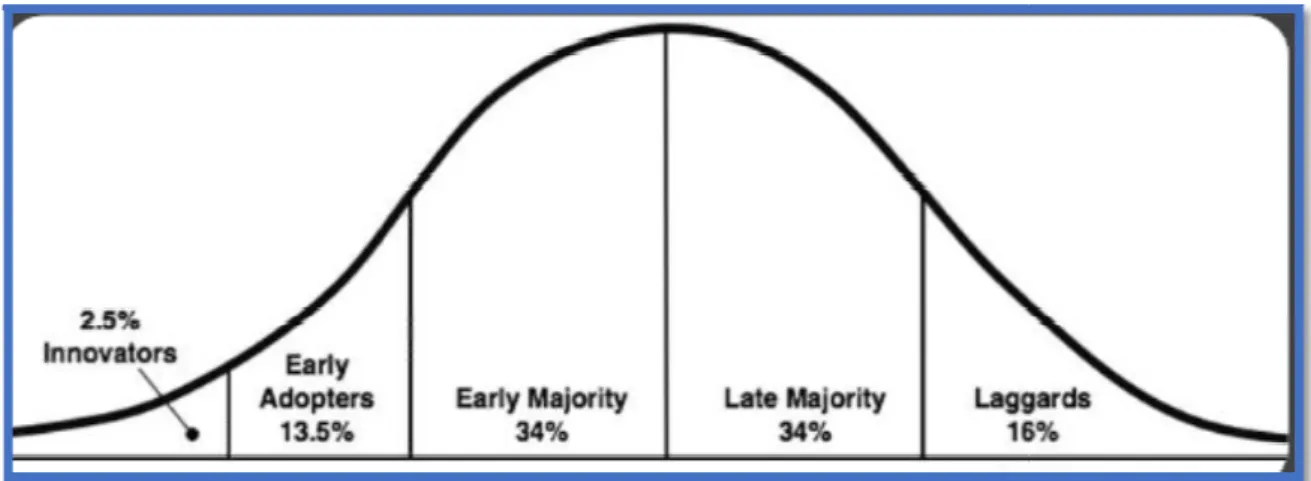
Figure 9. Diagram of the adopter categories (Source: Rogers, 1983, p. 247). ... 13
Figure 10. Innovation-Decision process (Rogers, 2003 p. 170) ... 13
Figure 11. Research phases developed during the implementation of the methodology. ... 15
Figure 12. Connections between learning, relative advantage, the population and the practice in the ADOPT (Geoff Kuehne et al., 2017)... 17
Figure 13. Different quadrants that ADOPT evaluates (source: CSIRO, 2017b). ... 17
Figure 14. Access window to ADOPT (CSIRO, 2017b) ... 19
Figure 15. General information of the project and results displayed in the ADOPT tool (CSIRO, 2017b). ... 20
Figure 16. Questionnaire window displayed in the ADOPT tool (CSIRO, 2017b). ... 20
Figure 17. Adoption curve display in the ADOPT tool (CSIRO, 2017b). ... 21
Figure 18. IDEA protocol, from Hemming, et al. (2017). ... 22
Figure 19. Influence of ‘Profit orientation’ on a) the level (in %) and b) rate (in years) of adoption of the innovation. ... 30
Figure 20. Influence of ‘Environmental orientation’ on a) the level (in %) and b) rate (in years) of adoption of the innovation. ... 30
Figure 21. Influence of ‘risk orientation’ on a) the level (in %) and b) rate (in years) of adoption of the innovation. ... 31
Figure 22. Influence of ‘enterprise scale’ on a) the level (in %) and b) rate (in years) of adoption of the innovation. ... 31
Figure 23. Influence of ‘management horizon’ on a) the level (in %) and b) rate (in years) of adoption of the innovation. ... 32
Figure 24. Influence of ‘short-term constraints’ on a) the level (in %) and b) rate (in years) of adoption of the innovation. ... 32
Figure 25. Influence of ‘Trialability’ on the a) level (in %) and b) rate (in years) of adoption of the innovation ... 34
Figure 26. Influence of ‘Innovation complexity’ on the a) level (in %) and b) rate (in years) of adoption of the innovation. ... 34
Figure 27. Influence of ‘Observability’ on the a) level (in %) and b) rate (in years) of adoption of the innovation ... 35
Figure 28. Influence of ‘Advisory support’ on the a) level (in %) and b) rate (in years) of adoption of the innovation. ... 36
Figure 29. Influence of ‘Group involvement’ on the a) level (in %) and b) rate (in years) of adoption of the innovation. ... 37
Figure 30. Influence of ‘relevant existing skills and knowledge’ on the a) level (in %) and b) rate (in years) of adoption of the innovation. ... 37
xxi Figure 31. Influence of ‘innovation awareness’ on the a) level (in %) and b) rate (in years) of
adoption of the innovation. ... 38
Figure 32. Influence of ‘relative upfront cost of innovation’ on the a) level (in %) and b) rate (in years) of adoption of the innovation. ... 40
Figure 33. Influence of ‘Reversibility of innovation’ on the a) level (in %) and b) rate (in years) of adoption of the innovation. ... 40
Figure 34. Influence of ‘Profit benefit in the years that it is used’ on the a) level (in %) and b) rate (in years) of adoption of the innovation. ... 41
Figure 35. Influence of ‘Future profit benefit’ on the a) level (in %) and b) rate (in years) of adoption of the innovation. ... 41
Figure 36. Influence of ‘Time until any future profit benefits are likely to be realised’ on the a) level (in %) and b) rate (in years) of adoption of the innovation. ... 42
Figure 37. Influence of ‘Environmental costs and benefits’ on the a) level (in %) and b) rate (in years) of adoption of the innovation. ... 42
Figure 38. Influence of ‘Time to environmental benefit’ on the a) level (in %) and b) rate (in years) of adoption of the innovation. ... 43
Figure 39. Influence of ‘Risk Exposure’ on the a) level (in %) and b) rate (in years) of adoption of the innovation. ... 43
Figure 40. Influence of ‘Ease and convenience’ on the a) level (in %) and b) rate (in years) of adoption of the innovation. ... 44
Figure 41. Predicted Adoption curve, first round Tu/e. ... 47
Figure 42. Peak adoption sensitivity analysis, first round Tu/first round Tu/e. ... 48
Figure 43. Time to peak adoption sensitivity analysis, first round Tu/e. ... 49
Figure 44.Predicted Adoption curve, second round Tu/e. ... 51
Figure 45. Peak adoption sensitivity analysis, second round Tu/first round Tu/e. ... 52
Figure 46. Time to peak adoption sensitivity analysis, second round Tu/e. ... 52
Figure 47. Predicted Adoption curve, first round Municipality of Eindhoven. ... 55
Figure 48. Peak adoption sensitivity analysis, first round Municipality of Eindhoven. ... 56
Figure 49. Time to peak adoption sensitivity analysis, first round Municipality of Eindhoven. ... 57
Figure 50. Predicted Adoption curve, second round Municipality of Eindhoven. ... 59
Figure 51. Peak adoption sensitivity analysis, second round Municipality of Eindhoven. ... 60
xxiii
List of Tables
Table 1. Examples of urban NBSs ... 4 Table 2. Peak Adoptions equations (Geoff Kuehne et al., 2017) ... 25 Table 3. Time to peak adoption equations (Geoff Kuehne et al., 2017) ... 26 Table 4. Values used for the MS- Excel scenario created. ... 27 Table 5. Parameters for the peak adoption and time to peak adoption equations (Geoff Kuehne et al., 2017). ... 28 Table 6. ADOPT questions related to the ’Relative Advantage for the Population’ Quadrant. ... 29 Table 7. ADOPT questions related to the ‘Learnability characteristics of innovation’ quadrant. ... 33 Table 8. ADOPT questions related to the ’Population-specific Influences on the Ability to Learn About the innovation’ Quadrant. ... 36 Table 9.Questions of the ADOPT software from Relative Advantage of the Innovation Quadrant. 39 Table 10. Answers are given per participant in the first workshop round (Tu/e). ... 46 Table 11.Predicted Adoption levels, first round Tu/e. ... 47 Table 12.Answers are given per participant in the second workshop round (Tu/e). ... 50 Table 13.Predicted Adoption levels, second round Tu/e. ... 51 Table 14. Differences in responses between the first and second round Tu/e ... 53 Table 15. Answers are given per participant in the first workshop round (Municipality of Eindhoven). ... 54 Table 16. Predicted Adoption levels, first round Municipality of Eindhoven. ... 55 Table 17. Answers given per participant in the second workshop round (Municipality of Eindhoven). ... 58 Table 18. Predicted Adoption levels, second round Municipality of Eindhoven. ... 59 Table 19. Differences in responses between the first and second round, Municipality of Eindhoven. ... 61
xxv
List of acronyms and abbreviations
ADOPT Adoption and Diffusion Outcome Prediction Tool
CSIRO Commonwealth Scientific and Industrial Research Organization
EU European Union Commission
GHG Green House Gases
IDEA Investigate, Discuss, Estimate and Aggregate protocol
MS-EXCEL Microsoft Excel
NBS(s) Nature-Based Solution(s)
Tu/e Technological University of Eindhoven
UCIR Urban Community Infrastructure Resilience
UN DESA United Nations, Department of Economic and Social Affairs, Population Division
UN ENVIRONMENT United Nations Environnemental Program
UNaLab Urban Nature Laboratories
US EPA United States Environmental Protection Agency
1
1 Introduction
1.1 Problem description
The effects of climate change have been widely studied in a global scale, and according to scenarios developed by the United Nations’ Intergovernmental Panel on Climate Change (IPCC, 2014), their impacts in the natural and urban ecosystems could highly increase in the next years. Moreover, the cities, in general, will also grow. In that sense, it is expected that 68% percent of the global population will live in cities by 2050 (UN DESA, 2018).
Along with a growth of the population in the urban areas, the ecological risk increases too (Luo, Liu, Peng, & Wu, 2018). Heat islands, flooding or water scarcity are some examples of the potential effects that cities could face due to climate change, resulting in alterations on the local energy use, water management, air quality and human health (Fan et al., 2017). For instance, in some countries as the United States of America (USA), it is known that urban heat islands increase the overall and peak electricity demand, occurring especially during the summer afternoons, when the houses and offices run the cooling systems, lights, and appliances. Extreme events of this type of phenomena can cause, rolling brownouts or blackouts to prevent power outages in the community (US EPA, 2014).
In this sense, while urban areas become one of the most vulnerable types of human communities (The World Bank, 2010), on the other hand, urbanization is one of the most significant aspects of human activities that changes the landscape and the weather (Cai et al., 2018). Moreover, along with the increase in the emission of greenhouse gases (GHG) due to the activities within the cities (IPCC, 2014), these means that urban areas become not only receptors but important generators of the climate change impacts. This contrast, allows cities to be the places were a significative response to reduce the global warming effects can be done (The World Bank, 2010).
As stated before, climate change can affect the local infrastructure of the cities and put into risk to their inhabitants (Rosenzweig et al., 2015). In the case of Europe, from 1980 to 2010, more than €300 billion have been lost due to storms, floods, mudflows, and landslides, 75 000 deaths due heatwaves moreover, it is losing €50 million per year as a cost of not halting biodiversity loss and degradation of ecosystem services (European Commission,2016). Furthermore, more than 700 000 people resulted directly affected by urban heat islands in 2003, and 70% of the larger cities in the continent have vulnerable areas to sea level rising (The World Bank, 2010).
2
As a response to this situation, the cities must become more flexible in their dynamics within and with the external environment by improving their resilience. Brown et. al (2018) (secondary source) cite the concept from several sources highlighting the ones by Maru et al. (2014); Meerow et al. (2016); Mock et al. (2015); Moser and Boykoff (2013) (primary sources), whom define resilience as all the systems that gives to the city the capacity to anticipate, absorb and reorganize due a known or unknown threat.
Also, Aruchamy (2016) (primary source) analyses a series of literature definitions, which consider the major principles of urban resilience, which are:
“Urban Governance, Infrastructure Services and Accessibility, Urban Planning and strategy, Environmental Sustainability, 4-Rs (Robustness, Redundancy, Resourcefulness, and Rapidity (Tierney and Bruneau, 2007) (secondary source), Vulnerability analysis, Disaster preparedness, response and awareness, Economy and wellbeing of the citizens, Uncertainty oriented planning and Flexibility to deal with wide range of risks” (Aruchamy, 2016, pp.11).
As seen before, it is important to highlight that infrastructure either in the means of services or accessibility, can be considered one of the basic sub-systems that take part into the urban resilience scheme (Aruchamy, 2016).
Following the importance of the infrastructure, Aruchamy (2016) proposes a specific definition for Urban Community Infrastructure Resilience (UCIR), which can be stated as the ability that infrastructure (as a system) has to:
i) Deal and restore its functions quickly, avoiding adverse impacts to the inhabitants of the city, ii) Provide the expected services with minimal environmental impact, and iii) Adapt and manage processes related to future environmental uncertainties, such as climate change and rapid urbanization.
In addition to the importance of the UCIR, two general concepts divide the actions taken to improve the resilience to climate change in cities: Mitigation and Adaptation. The first one is related to the efforts to decrease the emission of GHG and the exposure to climate change (UN Environment, 2018). The second one defined as an adjustment from the social, ecological and economic view in response to climate change effects, in order to reduce the negative impacts or take advantage of new opportunities created (Raymond, et al., 2017). Furthermore, even though Mitigation and Adaptation might have different based goals and approaches to resilience, there are common drivers of application, that can be definitive to make cities more resilient (Rosenzweig et al., 2015).
1.2 Nature-based Solutio
In that sense, one option that Nature-Based Solutions (NBSs C.M., et al., 2017). However Adaptation strategies as part o with a cost-efficiency context a the decision-makers in the citie the willingness of the commun Prevention Research, 2014). T probability of the adoption of N influence its adoption and diffus
According to Raymond et al. context, as actions taken in a diverse societal challenges, in change mitigation, adaptation a these actions are carbon seq shoreline stabilizations, flood co
Figure 1. D
olutions
that integrates these concepts in the UCIR context c NBSs) as one of the means to improve the resilience wever, to make a successful implementation of jo part of the urban infrastructure policies; synergies hav text and a political view that allows to strength the fr e cities with a proper scale (Landauer, Juhola, & Kle mmunity to accept them as a new implementation (T . Then, to improve the rate of success, it is esse n of NBSs in each city context, by addressing the d diffusion.
t al. (2017) and Kabisch et al. (2016), NBSs are de in a systemic view, which use concrete implementati
inspired, supported or copied by nature. Those ation and disaster risk reduction. As seen in figure 1, n sequestration and storage, local climate and air q ood control, erosion prevention; etcetera (Seddon, 201
. Diagram of Nature-based solutions (source: Seddon, 2018).
3 ntext could be the use of ience in cities (Raymond, of joint Mitigation and es have to be addressed the frameworks used by & Klein, 2018). Including (Tri-Ethnic Center for essential to assess the the different factors that
are defined in a general entations as solutions to ose can include climate ure 1, some examples of air quality, slopes and , 2018).
4
Some other concepts that are closely related to NBSs are: “ecosystem-based adaptation,” “green infrastructure,” “ecosystem-based disaster risk reduction,” and “natural water retention measures.” (Kabisch et al., 2016 pp 3).
Hence, being specific with the urban communities, the natural areas of public value in the land , as well as rivers, canals, lakes and reservoirs, among others (natural or man-made); which offer recreation, sports, and other services to the cities can be defined as green spaces and blue spaces (San Martin-Feeney, 2014). These areas can support the local biodiversity conservation, but also give economic, environmental and social benefits to the population (Kabisch et al., 2016). If the green and blue spaces are promoted and managed consciously for these objectives, they can be considered as NBSs.
1.3 State of Knowledge
NBSs is relatively a new term. Since 2013 the European Commission (EU) grounded the use of the concept, and started to consolidate a defined spectrum of ecosystem-based approaches, including activities such as the promotion of research (Faivre, Fritz, Freitas, de Boissezon, & Vandewoestijne, 2017) for generating evidence of the functionality and (co-) benefits regarding its implementation.
The table 1, shows some examples of NBSs for urban areas (Nature4cities EU, 2017, p. 4):
Table 1. Examples of urban NBSs implemented at different levels At the building or plot level: At a district/ city level:
Green roofs. Ecological corridors.
Combined solution: green roofs/renewable energy. Urban forests.
Green walls. Urban farming.
Bio-retention cells. Constructed wetlands.
Shelter for auxiliary fauna - insect hotel. Stormwater planters.
Sustainable urban drainage system. Green street network.
In that sense, evidence of its demonstrated. For instance, in implemented a series of meas them focused on the conversi Gardens" or "Green 5 minutes local citizenship participation in green spaces represent a 36.8 (Raymond et al., 2017).
Figure 2. Urban G
Furthermore, in the East of Lo regeneration before the Olym Research and Innovation of the only to a resilient urbanization that sense, green spaces can obesity, and heart disease. In reduced treatment costs of thes and Innovation-European Comm
f its implementation and benefits in urban areas it is a ce, in the city of Barcelona, Spain. In 2009 the mu measures with the objective of reducing the emissio version of courtyards into green spaces through init utes from Home" (Raymond et al., 2017 pp. 36). Th tion in the creation of new green zones in Barcelona a 36.8% of the city, more than the double of the amou
rban Garden, Barcelona, Spain (source: Raymond et al., 2017, pp.
London; the Queen Elizabeth Olympic Park had Olympic Games in 2012. According to the Direc of the European Commission (2015), this type of acti ation but to produce benefits to the wellbeing and hea can lower the costs related to some illnesses, su
In England, by 2010 it has been estimated that of these type of illnesses by £2.1 billion (Directorate-Ge
Commission, 2015, pp 8-9).
5 it is already started to be e municipal government issions of GHG, one of h initiatives like "Pocket . This strategy involved celona (Figure 2). Today amount 30 years earlier
pp. 36).
had a significant urban Directorate-General for of actions contributed not d health of the people. In es, such as depression, that green spaces have General for Research
6
Figure 3. The Queen Elizabeth Olymp
Another example of NBSs imp Vienna in Austria. With more t large projects related to the ad green roofs, green walls, trees policies are stipulated in differe Development Plan 2025, to t (Nature network) and Natura 20 the plan; some examples are increase of the biodiversity in th
Figure 4. Panoramic view of some
On the other hand, even NBS notice that the governments m approaches for the successfu
Olympic Park, before and after its regeneration (source: Directorate and Innovation-EC, 2015, pp 9).
s implementation, now in a large-scale range, can be ore than 20 years of implementation, it focuses in a the adoption, recovering or restoration of existing: pa , trees, rivers and streams, and a whole natural pro different levels, from the Local Urban, Heat Island Str to the National Biodiversity Strategy of Austria, t ra 2000 (Raymond et al., 2017, pp. 32). The objective
e the recovering of green spaces coverage, ener ty in the city, among others (Raymond et al., 2017).
some green and blue spaces in Vienna, Austria (source: Raymond
NBSs can be a good option for improving the UCIR nts manage most of the green and blue spaces in th
essful implementation of NBSs depends on tacklin
ctorate-General for Research
an be found in the city of s in a series of small to g: parks, green bridges, al protected area. These Strategy Plan, the City ia, the Netzwerk Natur jectives vary according to energy efficiency or the
mond et al., 2017, pp. 32).
UCIR, it is important to in the cities. One of the ackling the barriers that
governments, especially in the the United States-Environment adoption barriers which are:
Funding
Lack of political suppor Resistance to change Coordination of multiple Legislative action Conflicting regulations Need for technical infor Nascent market Misunderstanding abou Cost concerns
If these aspects are not taken considerably. Consequently, it which at the same time is a con
Kabisch et at. (2016), explains Effectiveness, Society relations
Figure 5. Gaps in the •Evidence base: What are trad •Time-scale: What are inmedia •Knowledge sharing from exist
implementations
Effectiveness of NBSs
•Stakeholders involvement: Ho projects?
•Availability and side-effects: A •What is the significance of dis •Comunication: how to commu
NBSs and society relations
•Technical knowledge: How ca implementation and design o •Multiple NBss: How to design
Design of NBss
•Urban administration: What a •Land-use cometition: How to economic useful options for N •Tools: There is a lac of inform
authorities.
Implementation
in the local level-, face to adopt them. From the green nmental Protection Agency (US EPA, 2010) highlights
upport/leadership nge
ultiple stakeholders and partners
tions
information and training
about land use issues
aken into account, the success rate of the implementat tly, it is important to have a structured planning befo a concept that is still constantly developing itself.
plains four significant gaps in the knowledge related t ations, Design, and Implementation:
in the knowledge related to NBSs (Adapted: Kabisch et al., 2016, trade offs and synergies to biodiversity,health, economy and communi
ediate and long term concerns?
existing projects: Need to share information on drivers and cosntraints
t: How to involve them from planning administartion and also resident ts: Are benefits of NBSs accesible to all residents?
f displacement after green development?
mmunicate positive and negative ( failures) examles of NBSs?
w can technical knowledge from architects and engineers inform NBSs gn of grey infraestructure?
sign NBSs for multipurpose?
hat are legal organization instruments and requirements for implemen to deal with competing land uses, e.g., housing vs greening strategies for NBSs?
ormation clusters, info-systems, platforms for exchange betweem prac
7 green infrastructure view ights some of the main
entation can be reduced g before adopting NBSs,
lated to NBSs (Figure 5):
2016, pp. 6). unity? ints
ents for long-term
BSs
entation? gies? What are practicioners and
8
This study focuses in the NBSs and the society relationships gap, by searching methods to promote the involvement of the different stakeholders, and the evaluation for the potential adoption of NBSs in their communities.
1.4 Objectives
The scope of this work is focused on the implementation of NBSs, through the application of a tool that allows improving the stakeholder participation in the decision making when adopting NBSs, making a more inclusive and diverse consensus for generating possible scenarios for their level of adoption and the opportunity areas implicated for these means. Hence, the overall objective of this thesis is to use qualitative and quantitative methods to assess the factors that influence the adoption and diffusion of Nature-Based Solutions in Urban Areas. To this end, the adoption and diffusion theory (E., Rogers, 1983) is used, adapting the ADOPT tool (CSIRO, 2017a) to the case of NBSs in urban areas, resulting in ADOPT-NBSs.
Specific Objectives:
Identify the general factors that influence that adoption and diffusion of innovations.
Analyze ADOPT as a potential tool for the assessment of the level of adoption and rate of diffusion of NBS.
Adaptation of ADOPT for the NBS context.
Creation of a methodology for the implementation of workshops oriented to the assessment of the level of adoption of NBSs in urban areas.
Implementation of a workshop in the city of Eindhoven, the Netherlands assessing the factors that influence the adoption and diffusion of green roofs in its urban area.
1.5 The UNaLab project
Urban Nature Laboratories (UNaLab) is a project that aims to foster the development of an European Reference Framework for NBSs. It is funded under the Grant Agreement No. 730052 Topic: SCC-2-2016-2017: Smart Cities and Communities Nature-based solutions from the European Union´s (EU) horizon 2020 research and innovation programme ( UNaLab, 2017).
Its goal is to provide quantitativ apply it to regional and local au the development of smart, inclu
UNaLab is integrated by a con form the governmental, academ implementation of the project: follower cities (Cannes, Pragu Kong), with the intention of describes the general approach
Figure 6. UNaLab pro
ntitative evidence of NBS efficacy, applicability, cost-cal authorities, communities, enterprises and other stak t, inclusive, resilient and sustainable urban communities
a consortium of 28 partners from 10 cities across E cademic and private sector. It possesses three front
ject: Eindhoven, Geneva, and Tampere. Also, a dive Prague, Başakşehir, Castellón and Stavanger, Buen n of replicating the solutions generated ( UNaLab
roach of the project:
b project approach (Source: https://twitter.com/UNaLab_EU/media
9 -effectiveness, and to er stakeholders to enable unities ( UNaLab, 2017)
oss Europe and beyond, front-runner cities for the a diverse group of seven Buenos Aires and Hong aLab, 2017). Figure 6,
10
1.6 Thesis Outline
Thesis: The assessment of the factors that influence the adoption and diffusion of NBSs, can allow to the primary stakeholders in a determined urban area, to make better decisions in the selection and successful implementation of these type of innovations in their communities.
Figure 7. Thesis outline diagram.
I. Factors that influence the adoption and difussion of innovations
• a) The Diffusion theory • b) ADOPT tool
II. Adaptation of tools related to the assesement of adoption
and diffusion factors in innovations to the NBSs
perspective
• a) ADOPt- NBSs
III. Implementation of a participatory workshop for the implementation of the ADOPT-NBSs tool
• a) ELicitation process. • b) Participatory aproach
in a case study
IV. Analysis of results
• a) Individual sesion results • b)Compared results
2 Adoption and Diffus
2.1 Theory of adoption a
The Diffusion of innovations (Rogers, 1983), that describes through a specific population o
In that sense the people from end of the adoption and diffusio
The theory states that an innov perceived as new either by an this context, the diffusion beco specific channels over time a communication Channels.
Furthermore, Rogers (1983), r considering it as a dependent v rate of adoption (Figure. 8).
Figure 8. Variables that are me
Diffusion Theory and Applications
tion and diffusion of innovations
is a social science theory, developed first in 196 cribes how over time an idea or product gains mome tion or social system.
rom a specific social system, adopt a new idea, behav iffusion process.
innovation can be considered as any practice, idea o y an individual or any other adoption unit (Rogers, 19 becomes a process in which the innovation is com time among the members of a social system. Tho
83), refers to adoption as a decision to use and imp dent variable. In order to adopt innovations, five varia
measuring the rate of adoption of an innovation (Adapted: Roge
11 in 1962 by E.M. Rogers momentum and spreads
ehavior or product at the
dea or object that can be rs, 1983, preface xvii). In s communicated through . Those are defined as
d implement a new idea, variables, determine the
12
The perceived attributes of the innovations include the relative advantage, which measures the degree in which an innovation is seen as better as the product, service or idea that replaces. The compatibility, related to acceptance level with the values, needs, and expectations of potential adopters. The complexity to use or learn about the innovation. The extent to which it can be tested before there is a commitment to adopt it, known as trialability and the tangible results obtained through the observability (Rogers, 1983).
The way it is decided, when adopting an innovation is also important, either an arbitrary selection to a collective one that includes the specific weight of the authorities, could lead to a rejection or a later adoption of the innovation.
The communication channels such as the mass media or an interpersonal setting are forms to measure the rate of adoption too, as well as attributes such as the knowledge related to the innovation, the capacity of persuasion over the potential adopters, the decision about the innovation and its confirmation of the adoption or rejection of it (Rogers, 1983).
Furthermore, the nature of the social system can affect the level of adoption. Depending on the target population, their tolerance of deviancy and communication integration can increase or decrease the successful adoption of the innovation (Rogers, 1983).
Consequently, during the adoption process, the primary stakeholders are the opinion leaders, who introduce the knowledge and persuade potential adopters to decide on adopting an innovation, followed by the change agents and change aides, that through their efforts can broaden the range of adoption between the citizenship (Rogers, 1983).
There are different categories of people that adopt an innovation through time (Figure 9). The innovators are the pioneer percentage of the population that can take risks when adopting an innovation. Followed by the early adopters that are influenced by opinion leaders and change agents, in general terms they adopt the innovations as long as someone has adopted them before them, to decrease the risk. The early majority represent the gross of the population that accepts innovations, then the late majority that adopts it by the inertia of the social behavior and finally the laggards that are the sector more resistant to adopt the innovations (Rogers, 1983).
Figure 9. Diag
The consequences or final r implementation of the innova discontinuance by the action of a result of the prolonged delay
Figure
. Diagram of the adopter categories (Source: Rogers, 1983, p. 247)
final results of the innovation-decision process (Fi innovation in a target sector, as well as its lat tion of replacement. On the other hand, the rejection a delay in the adoption process (Rogers, 1983).
igure 10. Innovation-Decision process (Rogers, 2003 p. 170)
13 . 247).
(Figure 10), are the ts later continuance or tion as a concept can be
14
2.2 Applications of the adoption and diffusion theory.
The adoption and diffusion theory has many applications in diverse fields; one example is the local transport policies in cities as Leeds (Marsden, 2011). Another one in the health sector, allowing to understand the factors impacting patients acceptance and use of consumer e-health innovations (Zhang, Yu, Yan, & Ton A M Spil, 2015).
This theory is also an important part of the technological adoption model (Atkin, Hunt, & Lin, 2015), described ad Atkin ( 2015) as “a system’s level framework focused on the adoption of emerging media channels and contents“.
Moreover, regarding this thesis project, part of this theory was implemented in the development of ADOPT, which is mainly a tool used to make prosecutions regarding the adoption of innovations in the agricultural sector in Australia (CSIRO, 2017a).
2.3 Evolutions of the adoption and diffusion theory.
Dearing (2018), explains that the diffusion theory has been traditionally applied to different sectors such as the agricultural one, international development, public health, and educational interventions.
However, the central evolution of the theory is related to its conversion into a science of dissemination, concluding three main changes in how it is conceived (Dearing, 2008):
“Changes (1) The social systems from a perspective on physical communities to one on societal sectors and social networks. (2) The nature of the diffusion systems we create to interface with social systems where we want to intervene, which have become more decentralized, multifaceted in some instances, and yet retained elements of centralized efficiency. Also, (3) the strong relevance for public health innovation dissemination of attending to what goes on inside organizations where we may want to intervene upstream to affect change” (p.9).
On the other hand Atkin et al, (2015)( primary source), express that the Rogers theory in this lattes version (2003) challenges to the scholars to make a more complex understanding of the theory ang gives some examples of various authors, such as the development of a convex curve when interpersonal channels impact instead of an S-curve ( Vishwanath and Barnett’s 2011) ( secondary source)) or the importance of active adopter activity during diffusion Dearing and Meyer (2011)( secondary source).
3 Methodology
Being this thesis project a com specific case study; its goal wa for urban areas. For this pu qualitative research methods. scenarios measuring the proba second one in developing the m decision making concerning th conditions in their communities.
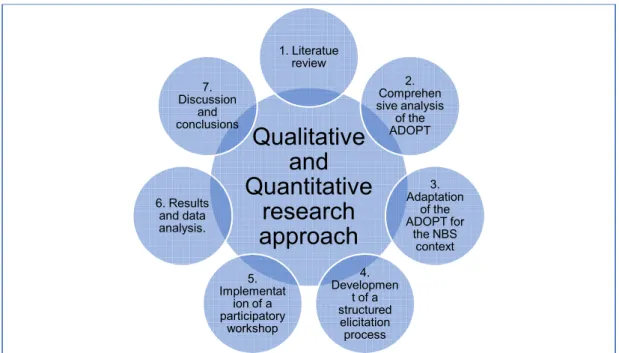
As seen in figure 11, the proc comprehensive analysis of the development of a structured eli and data analysis; discussion a
Figure 11. Research
3.1 Literature review
The literature review consiste concept of the NBS, its relatio proved until now as resilien 6. Re
and d analy
a combination of documentary research and a practi al was to create a procedure that could also be used is purpose, the methodology was developed unde hods. The first approach is mainly focused in deter probability and time of adoption for NBS in a specif the means to assess the perception of the stakehold ing the adoption of green infrastructure focused in imp
nities.
procedure consisted in seven chronological phases of the ADOPT tool, adaptation of the ADOPT tool fo red elicitation process, implementation of a participator
sion and conclusions.
search phases developed during the implementation of the method
nsisted in a bibliographic analysis of documents re relationship with climate change, urban processes an esilience infrastructure in cities facing the climat
Qualitative
and
Quantitative
research
approach
1. Literatue review 2. Comprehen sive analysis of the ADOPT 3. Adaptation of the ADOPT for the NBS context 4. Developmen t of a structured elicitation process 5. Implementat ion of a participatory workshop 6. Results and data analysis. 7. Discussion and conclusions 15 practical application in a used in a general context under quantitative and determining prospection specified region; and the keholders involved in the in improve the resiliencehases: Literature review, ool for the NBS context, ipatory workshop, results
ethodology.
nts related to the basic s and its efficacy level climate change effects.
16
Furthermore, some practical cases of interest, as well as examples of success and failure during the adoption of green infrastructure in urban areas.
On the other hand, it was examined the adoption and diffusion theory, developed by E.M. Rogers (2003), which is one of the essential social methods related to this specific area (Sahin, 2006). As a complement to this theory, it was analyzed information about the concept of community readiness, which as the name indicates, it measures the level of preparedness that a community has to adopt a substantial change or take action into a determined issue (Tri-Ethnic Center for Prevention Research, 2014).
This adoption and diffusion theory was, in turn, the primary development source for a predictive tool, used for measuring the adoption rate scenarios oriented to the agricultural sector called Adoption and Diffusion Outcome Prediction Tool (ADOPT), which was also analyzed.
Finally, a literature review was performed related to the process for obtaining information from groups of experts on a determined topic; known as structured elicitation (Aspinall, 2010), as well as methodologies used to conduct participatory workshops with this approach.
3.2 Comprehensive analysis of the ADOPT tool
As stated before ADOPT is an MS-Excel based tool that was developed and promoted mainly by the Commonwealth Scientific and Industrial Research Organisation (CSIRO) in Australia, its primary objective is to create scenarios for measuring the level of adoption and diffusion of innovations in the agricultural sector (CSIRO, 2017b). An informative analysis was performed to understand how the tool could be applied.
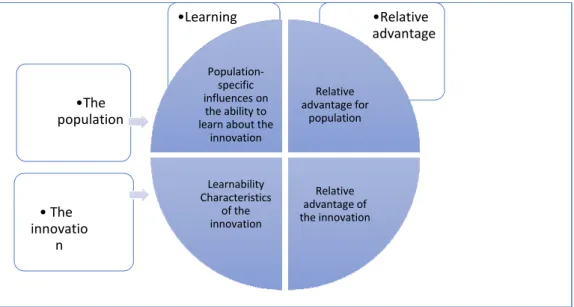
The conceptual framework of the tool focuses on the interrelationships between a targeted population and innovation which influences the adoption and diffusion rate. The interaction variables that ADOPT uses are: networks, profit expectations, property size, the short-term costs of adoption, the innovation´s impacts on profits, impacts on riskiness of production, the complexity of the innovation, perceived environmental credibility of the practice, able to be trialled on a small scale, able to be observed and readily apparent effects (Kuehne et al., 2017).
In that sense, according to Kuehne et al. (2017), ADOPT was implemented in a series of workshop settings with specific sectors of farmers in Australia. Then it works is by answering a survey of 22 questions related to four main areas or quadrants. As seen in figure 12, the first two correspond to the relative advantage for the population and the learnability characteristics of the innovation; the
third and fourth quadrants a community to learn about the in
Figure 12. Connections between learn
The four interconnected quadra of ADOPT (Figure 13):
Figure 13. Differ
To know if the potential advant population for the adoption o organized as part of the relat profit, environmental and risk o
•The population
• The innovatio
n
nts are associated with the specific influences on the innovation and its relative advantage (Geoff Kueh
learning, relative advantage, the population and the practice in the et al., 2017).
uadrants follow multi-directions lines related to each o
. Different quadrants that ADOPT evaluates (source: CSIRO, 2017b
dvantage gained from adopting the innovation is enou tion of a particular innovation, the first six questio
elative advantage for the population quadrant. The risk orientation, the enterprise scale, the managemen
•Relative advantage •Learning Population-specific influences on the ability to learn about the
innovation Relative advantage for population Relative advantage of the innovation Learnability Characteristics of the innovation 17 s on the ability of the Kuehne et al., 2011).
in the ADOPT (Geoff Kuehne
ach one of the questions
2017b).
s enough to convince the uestions of ADOPT are . These aspects are the ement horizon with profit
18
and environmental advantages of the innovation incorporated and the possible short-term constraints (Kuehne et al., 2017).
Some innovations will be challenging to adopt in comparison to others. The learnability characteristics of the innovation quadrant consider the innovation-specific influences on the ability to learn about the innovation, the three subsequent questions of the survey are expressed in topics of observability, trialing ease and innovation complexity, the two last questions are directly related to the trialability of the innovation. (Kuehne et al., 2017).
The population-specific influences on the ability to learn about the innovation quadrant include questions 10 to 13 and measures the learnability of the population. This situation includes the learning process of gathering information, reassessment of the beliefs of the target population and the review for adopting or not the innovation. Constraints in the learning process could reduce the adoption time possibility. The networks of the target population are evaluated through advisory support and group involvement. Also, the relative skills and knowledge are assessed to the farmers' network and previous skills, and the last question related to the innovation awareness (Kuehne et al., 2017).
The more significant quadrant is the relative advantage of the innovation quadrant, includes nine questions, focused on the relative advantage of the innovation characteristics, specifically in how the target population perceives them. The profit advantages are measured by the questions related to the future benefits and in the years used, also the time for profits the realized. The environmental advantage is also incorporated including the time for the environmental benefits are going to be realized. Also, the investment costs with questions focused on the upfront costs and the reversibility of the innovation. The risk and ease and convenience of the innovation are also included.
Even do all the quadrants are interconnected, the relative advantage for the population and the relative advantage of the innovation influence directly the peak adoption level. Meanwhile, the time to peak adoption is directly influenced by the short terms constraints, the awareness score and the learning of relative advantage. The rest of the variables have a participation in the intermediate equations of these concepts.
After completing the questionnaire, the result of using the software is an adoption curve that displays the number of years and the percentage of adoption of an innovation related to the target population. Along with a sensitivity analysis that helps to point out the opportunity areas for the improvement of the adoption of the innovation.
19 The outcome is the generation of a report. It includes a table containing the years and the predicted pick level of adoption, the expected adoption level at five and ten years from the start; and optionally if it was inputted in the tool, the set year of the innovation to be adopted and the adoption level at that year. It also includes a series of graphs representing the adoption level, the sensitivity analysis to step change for response in peak adoption level and in the time to peak adoption level (CSIRO, 2017c).
The informatics use of ADOPT is described in the next steps:
1.- The downloadable version must be signed by an agreement of copyright protection before accessing to it. After the registration as a user, one copy of the software can be downloaded onto one single computer. An Excel file is then available, to open the tool. The agreement can be found in Appendix A.
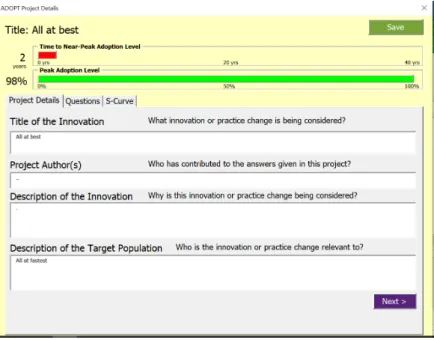
2.- A window will appear, it is essential to select the option USE ADOPT, and select a new or old project to work (Figure 14):
Figure 14. Access window to ADOPT (CSIRO, 2017b)
20
Figure 15. General information of the project and results displayed in the ADOPT tool (CSIRO, 2017b).
4.- After pressing the ‘Next' button, the first question will be displayed (Figure 16), with several multiple-choice answers. It is essential to ask the interviewer the reasons for its answer. As mentioned before, the number of questions is 22, those are divided into different topics related to the four quadrants that the tool is based on (relative advantage for the population quadrant, learnability characteristics of innovation quadrant, population-specific influences on the ability to learn about the innovation quadrant and relative advantage of the innovation quadrant). The content of each original question, the possible answers and the explanation of each of them, can be found in the Appendix B. It is important to recall that the program is first developed for the farming sector.
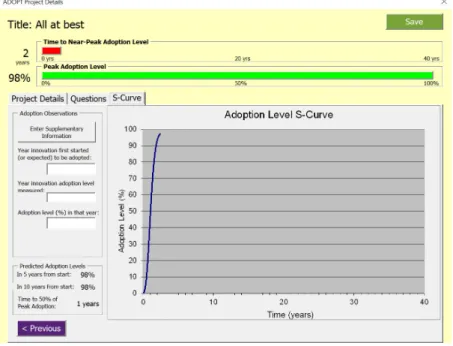
21 5.-afterward, the last window will generate the preliminary adoption curve (Figure 17).
Figure 17. Adoption curve display in the ADOPT tool (CSIRO, 2017b).
6.- A report of the summited data can be generated in the main window, including information on the adoption level, rate of adoption and a corresponding sensitivity analysis of both factors.
3.3 Adaptation of the ADOPT to the NBS context
Understanding that NBSs is a relatively new concept (Eggermont et al., 2015), an adjustment of ADOPT was necessary to give to the first scenarios created, a more aligned sense of adoption respecting not only the possible profits given to the population, but to the different environmental and wellbeing benefits too. This as part of the main intentions that go along with the implementation of NBSs for improving the resilience in the communities.
3.4 Development of a structured elicitation process
Following the structured workshop setting explained by Kuehne et al. (2017), as part of the ADOPT implementation; the next stage of the thesis consisted in the development of a structured elicitation process as a complement of the application of ADOPT.
The structured elicitation process was proposed considering general concepts explained by Aspinall and Cooke (2013), the community readiness handbook from the Tri-ethnic Center for
22
Prevention Research (2014) protocol developed by Hemmin
Elicitation is the process of ge instead of searching for it in d making context (Aspinall, W., elicitation that depends in the s the expert elicitation of various each expert, giving a rational process (Aspinall, W., 2010). elicitation there are weights th appraisal of performance by on be determined by applying a sc the two more significant differen
The IDEA protocol (Hemming describes the steps to follow "Aggregate" (Figure 18). The information and the previous co phase consists of three steps. I of each expert. Then the Discu rest of the experts. Estimate, w Finally, in the Post-elicitation discuss and correct their answe
Figu
014) from the Colorado University and a structure mming et al. (2018) called the IDEA protocol.
of getting information (Macmillan Dictionary, 2018) d it in documents, for scientific (and planning) purpos W., & Cooke, R. 2013). It can be divided into two ty the single opinion of an expert, and ii) structured elicit arious participants through a methodology that weig ional consensus that allows reducing uncertainty in th
. Aspinall, W. and Cooke, R. (2013: p.11), explain hts that can be assigned by experts views. One wa by one or more technical facilitators, on the other han g a scoring rule measure to an empirical test of judgm ifferences in the weighting scheme.
ming, Burgman, Hanea, McBride, & Wintle, 2018) it ollow in the elicitation protocol: "Investigate," "Discu The protocol starts with a Pre-elicitation phase whe ous contact with the potential participants takes place. teps. Investigation refers to the own reasoning and com
Discuss dynamic, with shares in an anonymous way th ate, which focuses in the second round of questions a tion phase, which coincides with Aggregate, where answer for a having some conclusions of the process.
Figure 18. IDEA protocol, from Hemming, et al. (2017).
ctured expert elicitation
18) directly from experts urposes in the decision-wo types: i) unstructured
elicitation that combines t weights the opinions of ty in the decision-making xplain that for structured ne way is related to the er hand, the weights can judgment skill, these are
it is an acronym, that Discuss, "Estimate" and e where the background lace. Next, the Elicitation d compilation of answers way the opinions with the ions after the discussion. here the experts review, cess.
23 The third factor that was considered into the workshop methodology preparation was the idea of community readiness. According to the Tri-Ethnic Center for Prevention Research (Tri-ECPR) from the Colorado University, “community readiness is the degree to which a community is willing and prepared to take action on an issue” (Tri-ethnic Center for Prevention Research 2014).
The concept was first applied in the Kentucky Conference for Prevention Research1991 by the head of the Midwest Prevention Project (MPP), Mary Ann Pentz (Edwards, Jumper-Thurman, Plested, Oetting, & Swanson, 2000). This program was aimed at the prevention of substance use among middle school students. In this context, "If a program was started even though the community was not ready, initiation was likely to lead only to failure" (Edwards et al., 2000).
Therefore, although the term was used first in the health sector, the basis of the concept allows it to be used in other areas of society. Consequently, community readiness can be applied to the sustainable development of communities, to measure if they are prepared for the transition to technologies and programs that allow them to be more resilient to climate change.
With all these bases, an inclusive methodology was developed for a participative workshop setting for the different types of stakeholders. The performing steps in the case study were the following ones:
1. For the thesis purposes, the participants from the academic and governmental sectors were contacted and invited beforehand by email, with a date proposed for each workshop (see Appendix E). And for establishing the general logistics for realizing the workshops in the city (but depending on the NBSs context also representatives for the private sector and the citizenship organizations could be added).
2. During the workshops, an introduction of the general topic to the audience was performed along with the delivery of an implicit consent letter for the participation in the workshop (see Appendix C) in which the participants agreed to contribute with the study.
3. The workshop was divided into two rounds. The first round was performed with the participants filling the survey of twenty-two questions -adapted for ADOPT-NBSs- and giving a brief explanation of the reasons for setting the score they chose (see Appendices D and F). On the other hand, the second round, consisted of a similar activity. But this time the participants were conformed into heterogenic discussion groups, giving them the possibility to exchange different types of opinions; with the purpose of determining if their view changed or not respecting their first individual answers about the perception in the
24
adoption of green roofs in the city of Eindhoven. The time invested in each activity is described in appendices E and D.
4. After that activity, the answers of all the participants were calculated as an average per question and then set into the ADOPT for their analysis, resulting in the level of adoption and rate of adoption graphs.
5. A group presentation and discussion about the results was conducted.
6. In the end, the participants filled a feedback form, with their comments for the continuous improvement of this type of workshops (see Appendix G).
3.5 Implementation of a participatory workshop
The application of this methodology was made in the city of Eindhoven in the Netherlands, which is one of the participant cities of the UNaLab project. The workshop setting had two sessions orientated to the assessment of the possible adoption of green roofs in the city. The first one was performed in the Technical University of Eindhoven (TU/e), with postgraduate students holding a background orientated to urban planning and architecture and the second one took place in the Municipality of the city with personnel of the Urban Planning department.
3.6 Results analysis
The results were described regarding the two participatory workshop sessions in Eindhoven, in the forms of tables and graphs created by ADOPT.
As stated before the individual results of each session were evaluated along with the comparison of the answers of both groups that participated; the analysis was done per question and in a global form, this action allowed to have an average result that was used to have a generalization of the view of the participants.
3.7 ADOPT-NBSs
This section reconstructs the equations that compose ADOPT (see Table 2 and 3). Also, it is described the content adapted from the questions of ADOPT into the NBSs context (green roofs in particular).
25 One of the main objectives of this process is to understand how the responses to individual questions affect the level and rate of adoption of assessed innovations by the tool. Paying more attention to the specific positive or negative impact in the adoption graphs, rather than in the detailed values generated in the MS-Excel scenario, this because the level and rate of adoption could change depending on the scenario created. Another specific aspect is the adaptation of the questions to focus the tool to the right audience by making the survey more practical for NBSs purposes.
In that sense, organized by innovation quadrants, this section describes the questions related to the “Relative advantage for the population” quadrant (Section 3.7.1), the ‘Learnability characteristics of innovation’ quadrant (Section 3.7.2), the “Population-specific Influences on the Ability to Learn About the innovation” quadrant (Section 3.7.3) and the “Relative Advantage of the Innovation” quadrant (Section 3.7.4). For understanding the influence of each question in the peak adoption and time to peak adoption levels, graphs per question were created combining the different possible responses based on a scenario created with middle level answers of ADOPT. The individual analysis is explained in the next sections.
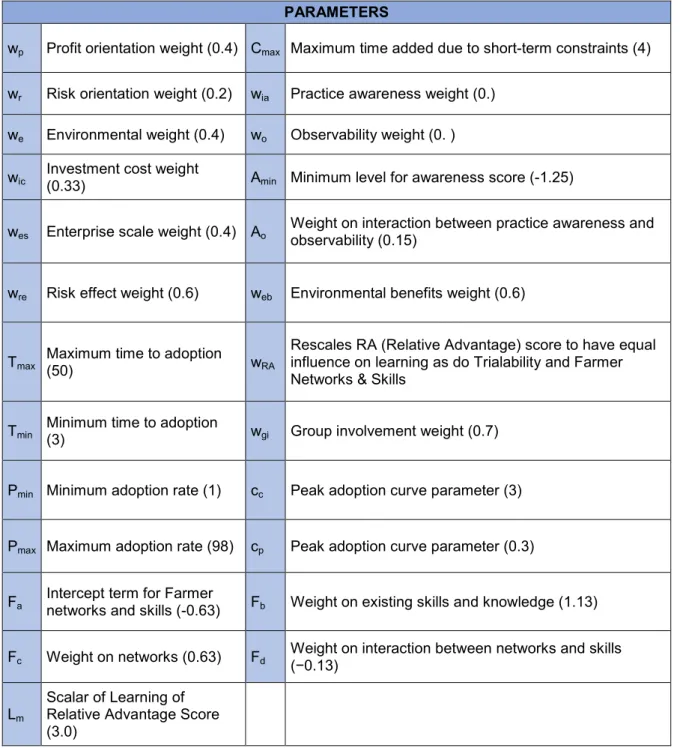
Table 2. Peak Adoptions equations (Geoff Kuehne et al., 2017) Peak adoption
Profit advantage = (Profit benefit in years used +
Profit benefit in future*(1 + Discount rate)−Years to Future Profit Benefit)/2
Environmental benefit (advantage) = web*Environmental benefit*(1+Discount rate)-Years to environmental benefit
Discount rate = 0.02 if Almost all have a long-term management horizon; 0.04 if A majority have a long-term management horizon; 0.06 if About half have a long-term management horizon; 0.08 if A Minority have a long-term management horizon; 0.1 if Almost none have a long-term management horizon.
Relative advantage = [(1 + wp*Profit orientation) *Profit advantage + (1 + wr*Risk orientation)*Risk + Ease & convenience + (1 + we*Environmental orientation)*Environmental advantage]*(1 + wes*Enterprise scale) + wic*(Investment cost – Max investment cost)