www.hydrol-earth-syst-sci.net/16/2347/2012/ doi:10.5194/hess-16-2347-2012
© Author(s) 2012. CC Attribution 3.0 License.
Earth System
Sciences
Coupling the modified SCS-CN and RUSLE models to simulate
hydrological effects of restoring vegetation in the Loess Plateau of
China
G. Y. Gao1,2, B. J. Fu1, Y. H. L ¨u1, Y. Liu1,3, S. Wang1, and J. Zhou1
1State Key Laboratory of Urban and Regional Ecology, Research Center for Eco-Environmental Sciences, Chinese Academy
of Sciences, 100085 Beijing, China
2State Key Laboratory of Soil Erosion and Dryland Farming on the Loess Plateau, Institute of Water and Soil Conservation,
Chinese Academy of Sciences and Ministry of Water Resources, Yangling 712100 Shaanxi, China
3Lab for Agriculture and Environment, Institute of Remote Sensing Applications, Chinese Academy of Sciences,
100101 Beijing, China
Correspondence to:B. J. Fu ([email protected])
Received: 19 March 2012 – Published in Hydrol. Earth Syst. Sci. Discuss.: 29 March 2012 Revised: 29 June 2012 – Accepted: 29 June 2012 – Published: 28 July 2012
Abstract.Predicting event runoff and soil loss under differ-ent land covers is essdiffer-ential to quantitatively evaluate the hy-drological responses of vegetation restoration in the Loess Plateau of China. The Soil Conservation Service curve num-ber (SCS-CN) and Revised Universal Soil Loss Equation (RUSLE) models are widely used in this region to this end. This study incorporated antecedent moisture condition (AMC) in runoff production and initial abstraction of the SCS-CN model, and considered the direct effect of runoff on event soil loss by adopting a rainfall-runoff erosivity fac-tor in the RUSLE model. The modified SCS-CN and RUSLE models were coupled to link rainfall-runoff-erosion model-ing. The effects of AMC, slope gradient and initial abstrac-tion ratio on curve number of SCS-CN, as well as those of vegetation cover on cover-management factor of RUSLE, were also considered. Three runoff plot groups covered by sparse young trees, native shrubs and dense tussock, respec-tively, were established in the Yangjuangou catchment of Loess Plateau. Rainfall, runoff and soil loss were monitored during the rainy season in 2008–2011 to test the applicabil-ity of the proposed approach. The original SCS-CN model significantly underestimated the event runoff, especially for the rainfall events that have large 5-day antecedent precipi-tation, whereas the modified SCS-CN model was accurate in predicting event runoff with Nash-Sutcliffe model efficiency (EF) over 0.85. The original RUSLE model overestimated
low values of measured soil loss and underpredicted the high values with EF values only about 0.30. In contrast, the pre-diction accuracy of the modified RUSLE model improved with EF values being over 0.70. Our results indicated that the AMC should be explicitly incorporated in runoff production, and direct consideration of runoff should be included when predicting event soil loss. Coupling the modified SCS-CN and RUSLE models appeared to be appropriate for evaluat-ing hydrological effects of restorevaluat-ing vegetation in the Loess Plateau. The main advantages, limitations and future study scopes of the proposed models were also discussed.
1 Introduction
The Soil Conservation Service curve number (SCS-CN) model is a simple and empirical model with clearly stated assumptions and only a few data requirements to estimate runoff for a given rainfall event (Ponce and Hawkins, 1996). It accounts for the major runoff producing characteristics in-cluding soil type, land use/treatment, surface condition and soil moisture condition, and incorporates them in a single CN parameter (Ponce and Hawkins, 1996). Mishra and Singh (2003) summarized the application of the SCS-CN model in storm water modeling for single rainfall events, long-term hydrologic simulation as well as predicting infiltration and rainfall-excess rates, and discussed its potential to simulate sediment yield and transport of urban pollutants. The SCS-CN model has also been adopted by many hydrological and ecological models to determine runoff, such as CREAMS (Knisel, 1980), ANSWERS (Beaslry et al., 1980), AGNPS (Young et al., 1989), EPIC (Sharply and Williams, 1990) and SWAT (Neitsch et al., 2005).
On the other hand, the SCS-CN has its own disadvantages. One of the main disadvantages is that there is no explicit guideline on how to change the antecedent moisture condi-tion (AMC) with the antecedent rainfall of certain duracondi-tion (Ponce and Hawkins, 1996). The standard SCS-CN model incorporates an empirical method to classify AMC into three distinct levels, viz., AMC I (dry), AMC II (normal) and AMC III (wet), based on the amount of 5-day antecedent precipi-tation (P5). However, this method usually led to poor results and failure of SCS-CN model to predict runoff (Mishra and Singh, 2002; Huang et al., 2007). Therefore, many studies aimed at improving the method and finding a better way to incorporate the AMC (e.g. Mishra and Singh, 2002; Mishra et al., 2006a; Michel et al., 2005; Huang et al., 2007; Sahu et al., 2010).
The Universal Soil Loss Equation (USLE, Wischmeier and Smith, 1978) and its revised version (RUSLE, Renard et al., 1997) are the most widely used empirical models to predict annual soil loss at field scale resulting from sheet and rill ero-sion. The USLE/RUSLE models have their advantages over the physical based models such as WEPP and EUROSEM, because they are accurate and easy to use in terms of parame-terization. However, their applications to storm-based events usually led to large errors (Kinnell, 2005). Risse et al. (1993) and Tiwari et al. (2000) observed that the USLE/RUSLE models overestimated low values of measured soil loss and underpredicted the high values. This result was mainly due to that runoff and soil loss were considered as separate en-tities without reference to any intrinsic link between them (Kinnell, 2009). In reality, the linkage between runoff and soil loss is fundamental as the soil lost from the areas of in-terest is usually discharged across the downslope boundary with surface-water flow (Kinnell, 2010). Therefore, the ac-curacy of USLE/RUSLE models can be improved if they are coupled with a hydrologic rainfall-excess model.
Mishra et al. (2006b) coupled the SCS-CN method with USLE model to compute the lumped quantity of event
sed-iment yield from a number of watersheds. The coupling in Mishra et al. (2006b) was based on three hypotheses that need further verification. Among these hypotheses, two are particularly questionable: (1) the maximum potential reten-tion parameter (S) of SCS-CN model can be expressed in terms of the USLE parameters; and (2) the sediment deliv-ery ratio is equal to the runoff coefficient (Kinnell, 2009). In reality, the logical way to link soil loss and the parameterS
should be through the effect ofSin predicting runoff ratios rather than through attempts to signifySusing USLE (Kin-nell, 2009). To consider direct effect of runoff on predicting soil loss, Kinnell (2007) included the runoff ratio in rainfall erosivity index of RUSLE, and applied it to predict event soil loss (Kinnell, 2010; Bagarello et al., 2008, 2010). However, runoff and soil loss modeling was decoupled in their stud-ies as the runoff volume was obtained from measurements, not by model prediction. In addition, the approach was only used in bare plots, and its application in plots with different vegetation types needs further investigation.
The objectives of this study are as follows: firstly, to incor-porate AMC in runoff production and initial abstraction of the SCS-CN model, and consider the direct effect of runoff on event soil loss by adopting a rainfall-runoff erosivity fac-tor in the RUSLE model; secondly, to couple the modified SCS-CN and RUSLE models with the rainfall-runoff-erosion modeling and; thirdly, to apply the proposed approach to pre-dict event runoff and soil loss from restored vegetation plots in the Loess Plateau of China.
2 Model theory
2.1 Rainfall-runoff modeling
2.1.1 Original SCS-CN model
The SCS-CN method is based on the principle of the wa-ter balance and two fundamental assumptions (Mishra and Singh, 2002). The first assumption is that the ratio of direct runoff to potential maximum runoff is equal to the ratio of infiltration to potential maximum retention. The second as-sumption states that the initial abstraction is proportional to the potential maximum retention. The water balance equa-tion and the two assumpequa-tions are expressed mathematically:
P =Ia+F+Q (1)
Q P−Ia =
F
S (2)
Ia=λS (3)
whereP is the total precipitation (mm),Ia is the initial
ab-straction before runoff (mm),F is the cumulative infiltration after runoff begins (mm),Qis direct runoff (mm),S is the potential maximum retention (mm), andλis the initial ab-straction coefficient. Combination of Eqs. (1) and (2) leads to the popular form of the original SCS-CN method:
Q= (P−Ia)2
P−Ia+S forP > Ia
Q=0, forP ≤Ia (4)
The parameterScan vary in the range of 0≤S≤ ∞, and it is directly linked to the curve number CN:
S=25 400
CN −254 (5)
where the CN is a dimensionless variable, and it depends on land use, hydrological soil group, hydrologic conditions, and antecedent moisture conditions.
2.1.2 Modified SCS-CN model
The variability of antecedent rainfall and the associated soil moisture amount is an important source of the inherent curve number variability encountered in applications of the SCS-CN method (Ponce and Hawkins, 1996). The incorporation of antecedent moisture in the original SCS-CN method in terms of three AMC levels permits unreasonable sudden jumps in the CN-variation, which results in corresponding jumps in computed runoff (Mishra et al., 2006a). To circum-vent these problems, Mishra and Singh (2002) suggested an SCS-CN-based equation incorporating antecedent moisture andP5for computation of runoff.
Using the C=Sr concept, where C is the runoff coef-ficient (=Q/(P−Ia)) andSr is the degree of saturation, Mishra and Singh (2002) modified the original SCS-CN method for accounting antecedent moistureM:
Q P−Ia
=F+M
S+M (6)
whereMis antecedent moisture representing the amount of moisture available in the soil profile before the start of the storm (mm).
Substituting Eq. (6) into Eq. (1) leads to
Q=(P−Ia)(P−Ia+M) P−Ia+M+S
. (7)
TheM on the day of onset of rainfall is assumed to be the amount of water infiltrated due to the antecedent 5-day rain-fall (M=F ), prior to which the soil is completely dry:
M=P5−Ia−Q. (8)
Assuming the antecedent moisture condition to be dry for 5 days before the onset of the considered rain storm, substitut-ing Eq. (4) into Eq. (8) results in the expression ofM(Mishra and Singh, 2002):
M= (P5−λSI)SI P5+(1−λ)SI
(9) whereSIis the potential maximum retention corresponding to the AMC I condition (mm). SinceSI=S+M, it follows
M=0.5h−(1+λ)S+p(1−λ)2S2+4P 5S
i
. (10)
Here+sign before the square root is retained forM≥0, and
P5≥λS.
In the original SCS-CN method, Ia is given by Eq. (3),
following non-linearIa−Srelation incorporating antecedent
moisture:
Ia= λS
2
S+M (11)
For a completely antecedent dry condition orM=0, Ia= λS, which is the same as Eq. (3). Substituting Eq. (11) into Eq. (7), one can obtain the simulated event runoff of the mod-ified SCS-CN method:
Q=(P−
λS2
S+M)(P− λS2
S+M+M)
P−SλS+M2 +M+S (12)
2.2 Soil loss modeling
2.2.1 Original RUSLE model
The USLE/RUSLE models predict long-term average an-nual soil loss using six factors that are associated with cli-mate, soil, topography, vegetation and management. They have also been used for time intervals shorter than the mean annual one, such as the event scale (Kinnell, 2005; Bagarello et al., 2010):
Ae=ReKLSCP (13)
whereAeis the event soil loss (t ha−1),Reis the event rain-fall erosivity factor (MJ mm ha−1h−1)given by the product of total kinetic energy of the rainstorm (E, MJ ha−1) and
maximum 30-min intensity during the event (I30, mm h−1)
(Re=EI30),Kis the soil erodibility factor (t h MJ−1mm−1),
LS is the slope-length and steepness factor,C is the cover-management factor, and P is the conservation support-practice factor.
2.2.2 Modified RUSLE model
Many studies have indicated that the USLE/RUSLE overes-timated low event soil losses and underesoveres-timated high event soil losses (Kinnell, 2005, 2007, 2010). The failure to con-sider runoff explicitly is a primary factor for USLE/RUSLE model to produce systematic errors in the prediction of event erosion (Kinnell, 2005). In reality, erosion is a hydrologi-cally driven process, and it is well known that event soil loss is given by the product of the runoff amount and bulk sed-iment concentration for an event (Kinnell, 2005; Bagarello et al., 2010). Modern understanding of rainfall erosion pro-cesses recognizes that runoff is a primary independent factor in modeling rainfall erosion. To directly consider the effect of runoff, Kinnell (2007) proposed the event rainfall-runoff ero-sivity index (QREI30,QRis the runoff ratio) to replace the
USLE/RUSLE rainfall erosivity factor (EI30), and
substan-tial improvement of prediction accuracy was obtained (Kin-nell, 2007, 2010). Bagarello et al. (2008, 2010) found that the event soil loss was proportional to the power function of
QREI30term. In terms of above results, the following
modi-fied RUSLE model is used to predict event soil loss:
Ae=a(QREI30)bKLSCP (14)
whereaandbare empirical coefficients.
Equation (14) differs from both the USLE-M by Kinnell (1998) and the USLE-MM by Bagarello et al. (2010). In the USLE-M, the proportionality betweenAe and the erosivity
termQREI30 is direct, i.e. the coefficientb is equal to one.
The USLE-MM includes an exponent for theQREI30 term
withb greater than one. As noted by Kinnell (1998, 2010), changing the event rainfall-runoff factor from the EI30index
has consequences on a number of the other factors used in the model. In particular, the original soil erodibility factor can-not be used to predict soil loss. In the USLE-M, a new value of the soil erodibility (KUM)is used, while in the
USLE-MM the a coefficient is considered to be representative of soil erodibility. However, it is difficult to directly determine the new soil erodibility. In Eq. (14), the original soil erodi-bility is used, and the coefficientais used to account for the effects of changing rainfall erosivity in a simple way. In this way, the modified RUSLE model can encompass both the USLE-M and USLE-MM.
In the modified RUSLE model, the effects from event rain-fall and runoff on soil loss as well as the impact of event ero-sivity index on other factors are explicitly considered. The predicted event runoff of the modified SCS-CN method is substituted into Eq. (14) to determineQR. In this way, the event rainfall-runoff-erosion modeling is directly coupled, which is very useful for practical application.
3 Model application
3.1 Study area
The study area is the Yangjuangou catchment (36°42′N, 109°31′E) located in the middle part of the Loess Plateau, Shaanxi Province, China (Fig. 1). The catchment has a to-tal area of 2.02 km2with elevation ranging from 1050 m to 1298 m. It is a typical gully and hilly area with a gully den-sity of 2.74 km km−2, and the slope gradients range from 10◦ to 30◦ (Li et al., 2003). The area has a semi-arid continen-tal climate with an average annual rainfall of 535 mm. The rainfall is mainly concentrated between June and September with large inter-annual variations. Soil in the study area is mainly derived from loess, which is fine silt to silt in texture. The soil type is Calcaric Cambisol characterized by a uni-form texture and weak structure, and it is vulnerable to wa-ter erosion (Li et al., 2003). The average erosion rate of the Yangjuangou catchment was 90.42 t ha−1yr−1between 1980 and 1990 and 62.73 t ha−1yr−1during 1992–1996 (Li et al., 2003), and 36.41 t ha−1yr−1in 2006 (Wang et al., 2009).
Fig. 1.Location of the study area and distribution of the three runoff plot groups.
the 1980s on infertile and steep cultivated lands with low crop yields. Driven by the implementation of the Grain-for-Green project since 1998, most of the cultivated lands on steep slopes have been abandoned for natural or artificial revegetation. At present, the main land use types are grass-land, forestland and shrubland formed at different restoration stages. The main forest species in the Yangjuangou catch-ment is acacia (Robinia pseudoacacia), which was planted in the 1980s or after 1999. The dominant grass species are
Artemisia sacrorum,Stipa bungeanaandArtemisia scoparia. The main shrub species are Prunus armeniaca and Hip-pophae rhamnoide. As a result of human disturbances and changes of the natural environmental conditions, mosaic of patchy land cover is the typical landscape pattern in the Yangjuangou catchment.
3.2 Data collection
Three runoff plot groups with different land cover types were installed in the catchment in 2008 (Figs. 1 and 2). Each group included three closed runoff plots with a fixed width of 2 m and lengths of 5, 9 and 13 m, respectively. Two numbers were used to define the runoff plot. For example, plot 11, plot 12 and plot 13 indicated that these plots belonged to Group 1 and their lengths were 5, 9 and 13 m, respectively. The slope gradients of all plots were somewhat different (see Table 1). Each plot was surrounded by inserting galvanized iron sheets into soil with depth of 10 cm on the upper and side
bound-aries. The lower boundary of the plots was made of gut-ter, which collected and channeled water leaving the plot. A stock tank was connected to the gutter with plastic pipe to store runoff. The stock tanks were covered by a plate in order to avoid direct entrance of rainfall.
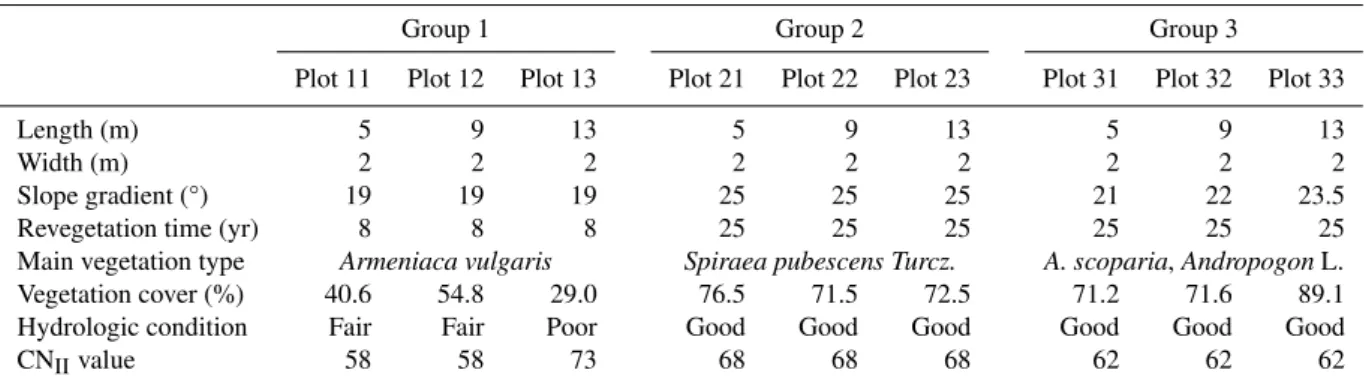
Group 1 plots were at the initial stage of revegetation and had been abandoned for 8 yr. Group 2 and Group 3 plots had been revegetated for 25 yr. The vegetation of Group 1 plots was sparse apricot (Armeniaca vulgaris) planted in rows at interval distances of 2.5 or 5 m. Patchy biological crusts cov-ered most of the soil surface of plots in Group 1. Dense native shrubs (Spiraea pubescens Turcz.) with an arborous layer of sparse artificial (acacia) covered plots of Group 2. Plots of Group 3 were dominated by dense tussock (A. scoparia) and beard grass (AndropogonL.). Liu et al. (2012) used a digi-tal camera (Finepix S1000, Fujifilm) and a 50 × 50 cm sub-plot mesh to perpendicularly photograph the surface of each runoff plot. The resulting images were transferred to digital vegetation cover maps in ArcMap. The vegetation cover ratio of each runoff plot could be easily obtained from these maps. Table 1 shows the main characteristics of each runoff plot.
Table 1.Main characteristics of each runoff plot in the three groups.
Group 1 Group 2 Group 3
Plot 11 Plot 12 Plot 13 Plot 21 Plot 22 Plot 23 Plot 31 Plot 32 Plot 33
Length (m) 5 9 13 5 9 13 5 9 13
Width (m) 2 2 2 2 2 2 2 2 2
Slope gradient (°) 19 19 19 25 25 25 21 22 23.5 Revegetation time (yr) 8 8 8 25 25 25 25 25 25 Main vegetation type Armeniaca vulgaris Spiraea pubescens Turcz. A. scoparia,AndropogonL. Vegetation cover (%) 40.6 54.8 29.0 76.5 71.5 72.5 71.2 71.6 89.1 Hydrologic condition Fair Fair Poor Good Good Good Good Good Good CNIIvalue 58 58 73 68 68 68 62 62 62
were tested using standard soil testing methods (Liu et al., 1996). Soil properties of each runoff plot group are shown in Table 2.
Rainfall, runoff and erosion of the nine runoff plots were monitored during the rainy season in 2008, 2009, 2010 and 2011. Rainfall depth was measured with an accuracy of 0.2 mm using a tipping bucket rain gauge that was con-nected to a data logger. The runoff mixed with the sediment discharged from each plot was collected after each rainfall event, and the volume was measured. After settling for 24 h, sediment was separated from water. Sediment from the gut-ters was also collected and added to the stock tank sediment since this was also output from the plot. The collected sed-iment was first air-dried for more than 24 h, and dried in an oven at a temperature of 105◦C for longer than 8 h until con-stant weight was achieved. Calculations of runoff in mm and erosion rate in t ha−1were obtained for each event. In total, there were 21 and 16 rainfall events that produced runoff and sediment, respectively. Table 3 provided the statistical char-acteristics of the rainfall for the simulated runoff events. The largest rainfall event occurred on 15 June 2008 with rain-fall depth of 76.4 mm, and the most intensive storm was on 25 August 2009 with rainfall intensity of 30.72 mm h−1. The largestI30 reached 52.8 mm h−1 on 28 June 2008, and the rainfall event on 19 July 2009 had the largestP5(79.6 mm).
It is generally accepted that different erosive mechanisms can be expected in plots with different lengths. In particu-lar, occurrence of interrill erosion alone can be presumed for the short plots, whereas both rill and interrill processes are expected on longest plots. In this study, the erosion status was observed at the end of each erosive event. There was only little rill generated in Plot 13 as it had the longest length and smallest vegetation cover. Sheet or interrill erosion dom-inated in the other runoff plots. Therefore, the effect of spe-cific erosion processes on soil loss can be ignored in the soil loss simulation.
Table 2.Soil properties of the three runoff plot groups.
Group 1 Group 2 Group 3 Sand (%) 22.83 24.40 24.39 Silt (%) 72.96 71.25 71.10 Clay (%) 4.21 4.36 4.5 BD∗(g cm−3) 1.04 1.30 1.17 TN (%) 0.06 0.12 0.10 TC (%) 1.91 2.53 2.22 SOC (g kg−1) 7.41 16.44 20.05 TP (g kg−1) 0.61 0.65 0.62 pH 8.42 8.28 8.32 EC (µs cm−1) 133.03 153.80 139.00
∗BD: bulk density
Table 3. Statistical characteristics of rainfall for the simulated
runoff events.
Rainfall Rainfall intensity I30a P5b
depth (mm) (mm h−1) (mm h−1) (mm) Mean 38.46 5.32 22.32 22.75 Max 76.40 30.72 52.80 79.60 Min 15.80 1.52 2.76 0.00 SD 18.52 6.30 17.08 25.73
aI
30: maximum 30-min intensity during the event.
bP
5: 5-day antecedent precipitation.
3.3 Determination of model parameters
3.3.1 Parameters for rainfall-runoff modeling
There are two parameters in the original or modified SCS-CN model. One is the initial abstraction coefficientλ, and the other is the curve number CN. λ was assumed to be equal to 0.2 in its original development. However, the as-sumption ofλ=0.2 has frequently been questioned for its validity and applicability, invoking a critical examination of theIa−Srelationship for pragmatic applications (Pronce and
Group 1
Group 2
Group 3
Fig. 2.Pictures of runoff plot in the three groups.
ratio represents the effects of soil and cover characteristics on the runoff process, and theoretically it is not a constant in different areas and for different rainfall events. It is generally accepted that theλvalue lies in the range of 0 to 0.3. Mishra and Singh (1999) obtained values ofλ from 0 to 0.042 for three watersheds less than 1 km2 in the USA and for one 3124 km2watershed located in India, respectively. Huang et al. (2007) optimized theλvalue to be 0.001 for four plots in the Loess Plateau. Fu et al. (2011) found that the prediction accuracy forλ=0.05 was greater than that forλ=0.2 using SCS-CN method to simulate plot runoff of 757 rainfall events in Zizhou and Xifeng cities located in the Loess Plateau of China. Similar results have been obtained from plots or wa-tersheds in USA (Hawkins et al., 2002), semi-arid tropical highlands of northern Ethiopia (Descheemaeker et al., 2008) and the Three Gorges area of China (Shi et al., 2009). In this study, the value of λ is not optimized using the measured rainfall-runoff data, as optimization of parameters cannot ad-equately examine the applicability of the modified SCS-CN model. Furthermore, the obtained optimization value is only reasonable for the studied plots, which limits the applications of the model in other areas. Therefore, the two commonly used values (λ=0.05, 0.2) are directly applied in the SCS-CN model for comparison.
For the CN value, it needs the following steps to deter-mine it with considering the effect of AMC, slope gradient and initial abstraction ratio. First, in terms of the hydrologic soil group (set to B) and hydrologic condition (determined by the measured vegetation cover), the CNIIvalue for the
nor-mal AMC (AMC II) can be determined from USDA-NRCS handbook with land cover and hydrologic soil-cover com-plexes of each runoff plot (see runoff curve numbers for arid and semiarid ranges as shown in Table 9-2 of USDA-NRCS, 2004). The CNIIvalue for each runoff plot is listed in Table 1.
Second, the CNII value obtained from the USDA-NRCS
handbook corresponds to a slope of 5 %, and it should be adjusted to the actual slope. Huang et al. (2006) used SCS-CN method to evaluate an 11-yr runoff plot experiment with slopes ranging from 14 % to 140 % in Xifeng city located in the Loess Plateau of China, and proposed the following equation to consider the effect of slope on CNIIvalue:
CNIIα=CNII
322.79+15.63α
α+323.52 (15)
where CNIIα is the slope-adjusted CNII value, andαis the
slope steepness (%).
Third, the above-determined CNIIαvalue is the median CN
value taken as a representative value for the AMC II condi-tion. It should be converted to AMC I (dry) or AMC III (wet) condition depending on the magnitude ofP5with the follow-ing relations (Hawkins et al., 1985):
CNIα=
CNIIα
2.281−0.0128CNIIα
CNIIIα=
CNIIα
0.427+0.00573CNIIα
(17)
where CNIαand CNIIIαare the slope-adjusted CN values
cor-responding to the AMC I and AMC III condition, respec-tively.
Finally, ifλ=0.05 is used in SCS-CN method, a new set of curve numbers must be developed (Hawkins et al., 2002). Hawkins et al. (2002) developed the following relationship that converted the 0.20-based CN to 0.05-based CN from model fitting results using rainfall-runoff data:
CN0.05=
100 1.879hCN100
0.20−1 i1.15
+1
(18)
S0.05=0.8187S0.201.15 (19)
where CN0.05andS0.05(mm) are the CN and potential water
storage values with λ=0.05, respectively, and CN0.20 and S0.20(mm) are the values withλ=0.2.
3.3.2 Parameters for soil loss modeling
In the original or modified RUSLE model, the six erosivity factors are determined in the following. The event rainfall erosivity factor (Re)is calculated as follows (Brown and
Fos-ter, 1987):
Re=EI30= n
X
r=1 (ervr)
!
I30 (20)
whereerandvrare the unit rainfall energy (MJ ha−1mm−1)
and the rainfall volume (mm) during a time periodr, respec-tively. The unit rainfall energy (er)is calculated for each time interval (Brown and Foster, 1987):
er=0.29[1−0.72 exp(−0.05ir)] (21) whereiris the rainfall intensity during the time interval (mm
h−1).
This study employs the method developed from EPIC by Sharply and Williams (1990) to estimate the soil erosivityK
factor. The calculation formula is as follows:
K= {0.2+0.3 exp[−0.0256Sa(1−Si/100)]}
S
i
Cl+Si
0.3
1− 0.25C
C+exp(3.72−2.95C) 1−
0.7Sn
Sn+exp(−5.51+22.9Sn)
(22) whereSais the sand content (%);Si is the silt content (%);
Cl is the clay content (%);C is the organic carbon content (%); andSn=1−Sa/100.
For each plot, a value of the topographic factor,LS, is calculated according to the following relationships (Nearing, 1997; Renard et al., 1997):
L=
λ
22.13 m
(23)
S= −1.5+ 17
1+exp(2.3−6.1 sinβ) (24)
m= F
1+F (25)
F = sinβ/0.0896
3(sinβ)0.8+0.56 (26)
whereλ is the slope length (m), mis the slope-length ex-ponent, andF is the ratio of rill erosion to interrill erosion which depends on the slope angle,β(◦).
Vegetation type and vegetation cover play major roles in controlling soil loss, especially in the restoration lands of arid and semi-arid regions. Many experimental studies have verified that soil loss exponentially decreased with vegeta-tion cover ratio for a specific vegetavegeta-tion type (Moreno-de las Heras et al., 2009; Bartley et al., 2010; Garcia-Estringana et al., 2010; Podwojewski et al., 2011). Based on numerous ob-served plot data in Ansai city located in the middle part of the Loess Plateau of China, Jiang et al. (1996) proposed the following exponential functions to describe the relationship between the cover-managementC factor and cover ratio of woodland and grassland:
Cgrassland=exp [−0.0418(Vcover−5)] (27)
Cwoodland=exph−0.0085(Vcover−5)1.5i (28) whereCgrasslandandCwoodlandare the cover-management
fac-tor of woodland and grassland, respectively, and Vcover is
vegetation cover (%). The above relationships have also been verified by Zhang et al. (2003) with observation data from 33 plots with nine types of grassland and woodland in the Loess Plateau of China. In this study, Eqs. (27) and (28) are used to determine theC factor of the nine plots. As there is no soil conservation practice for all the plots, theP factor is set to be 1 (P =1).
In the modified RUSLE model, there is no independent method to determine the introduced empirical coefficientsa
0 4 8 12
0 4 8 12
Observed runoff (mm)
Si
m
u
la
te
d
ru
n
o
ff
(m
m
)
1:1 line
Original SCS-CN (λ=0.2)
0 4 8 12
0 4 8 12
Observed runoff (mm)
Simu
la
te
d
r
u
n
o
ff
(
mm)
1:1 line
Original SCS-CN (λ=0.05)
0 4 8 12
0 4 8 12
Observed runoff (mm)
S
imu
lat
ed
r
uno
ff
(
mm
)
1:1 line
Modified SCS-CN (λ=0.2)
0 4 8 12
0 4 8 12
Observed runoff (mm)
S
im
u
la
te
d r
uno
ff
(
m
m
)
1:1 line
Modified SCS-CN (λ=0.05)
λ λ λ
λ
(a) (b)
(c) (d)
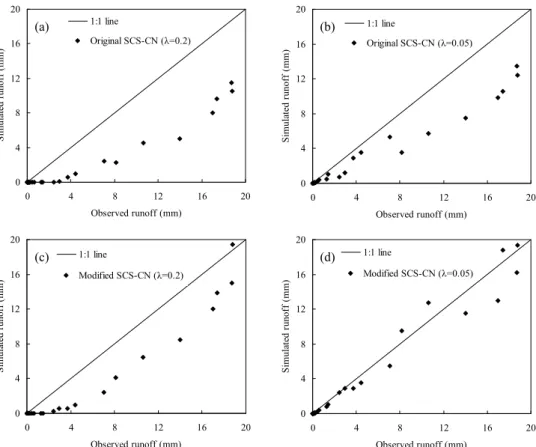
Fig. 3.Comparison between observed and predicted event runoff using(a)original SCS-CN (λ=0.2),(b)original SCS-CN (λ=0.05),(c)
modified SCS-CN (λ=0.2) and(d)modified SCS-CN (λ=0.05) models for Group 1 runoff plots.
3.4 Model performance evaluation criteria
In this study, the following four popular statistical criteria are used to measure the agreement between predicted and observed values of event runoff and soil loss. A good agree-ment indicates a good model performance, and vice versa.
EF=1− N
P
i=1
(Oi−Pi)2
N
P
i=1
(Oi−O)2
(29)
RMSE= v u u t 1
N N
X
i=1
(Oi−Pi)2 (30)
NRMSE= s
1 N
N
P
i=1
(Oi−Pi)2
O (31)
e= 1 N
N
X
i=1
(Pi−Oi) (32)
where EF is the Nash-Sutcliffe model efficiency, RMSE is the mean- square error, NRMSE is the normalized root-mean-square error,eis the bias,Oi andPi are the observed
and predicted runoff or soil loss of thei-th rainfall event, re-spectively,Ois the average observed runoff or soil loss, and
N is the total number of rainfall events that produce runoff or soil loss. EF=1 indicates a perfect agreement between observed and predicted values, and its decreasing values dicate poor agreement. A higher RMSE or NRMSE value in-dicates poor model performance. Bias represents the average differences between the predicted and observed values.
4 Results and discussion
4.1 Prediction results of event runoff
0 4 8 12 16 20
0 4 8 12 16 20
Observed runoff (mm)
S
imu
la
te
d r
unof
f (
m
m
)
1:1 line
Original SCS-CN (λ=0.2)
0 4 8 12 16 20
0 4 8 12 16 20
Observed runoff (mm)
Si
m
u
la
te
d
ru
n
o
ff
(m
m
)
1:1 line
Original SCS-CN (λ=0.05)
0 4 8 12 16 20
0 4 8 12 16 20
Observed runoff (mm)
Si
m
u
la
te
d
ru
n
o
ff (
m
m
)
1:1 line
Modified SCS-CN (λ=0.2)
0 4 8 12 16 20
0 4 8 12 16 20
Observed runoff (mm)
S
im
u
la
te
d r
unof
f (
m
m
)
1:1 line
Modified SCS-CN (λ=0.05)
λ λ λ
λ
(a) (b)
(c) (d)
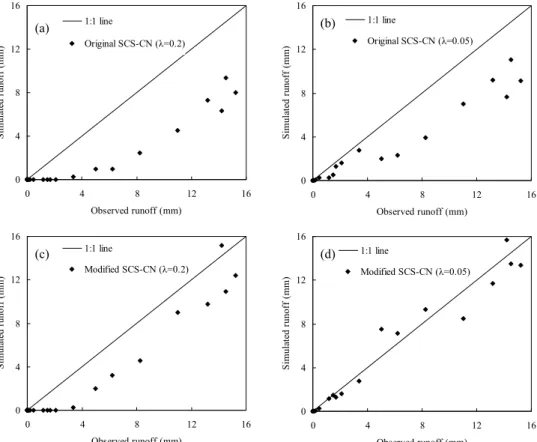
Fig. 4.Comparison between observed and predicted event runoff using(a)original SCS-CN (λ=0.2),(b)original SCS-CN (λ=0.05),(c)
modified SCS-CN (λ=0.2) and(d)modified SCS-CN (λ=0.05) models for Group 2 runoff plots.
the three plots that belonged to the same group, because the SCS-CN model cannot take the effect of plot length into ac-count. The original SCS-CN model (λ=0.2) significantly underestimates the observed runoff (Figs. 3a, 4a and 5a). There are many rainfall events that produce small runoff, but the simulation results of the original SCS-CN model (λ=0.2) for these events are almost equal to 0. The origi-nal SCS-CN model (λ=0.05) predicts the low event runoff well, but it underestimates the high event runoff, especially for the rainfall events that have largeP5(Figs. 3b, 4b and 5b). Although the predicted runoff of large rainfall events by the modified SCS-CN model (λ=0.2) is closer to the observed results compared to the original SCS-CN model (λ=0.2 or 0.05), the modified SCS-CN model (λ=0.2) still underes-timates the high event runoff (Figs. 3c, 4c and 5c). Further-more, it does not predict runoff for the small rainfall event, which is similar to the original SCS-CN model (λ=0.2). Compared to the above three models, the prediction results of the modified SCS-CN model (λ=0.05) are consistent with the observations, having a ratio close to 1 : 1, as shown in Figs. 3d, 4d and 5d. This result indicates that the modified SCS-CN model (λ=0.05) predicts both the small and large event runoff well.
The AMCs of the observed 21 rainfall-runoff events are determined based on the amount of P5. Only four
rain-fall events have normal soil moisture conditions (AMC II, 36 mm< P5<53 mm). Thirteen rainfall events have the
AMC I conditions (P5<36 mm), and four rainfall events
have the AMC III conditions (P5>53 mm). The observed
re-sults (not shown here) indicate that most of the rainfall events with AMC I condition produce small or no runoff, whereas those with AMC II and AMC III conditions result in sig-nificant runoff. As shown in Figs. 3, 4 and 5, the original SCS-CN models underestimate the observed event runoff, especially those with AMC II and AMC III conditions, al-though the original SCS-CN model (λ=0.05) can well pre-dict the runoff events with AMC I condition. Compared to them, the simulation results of the modified SCS-CN mod-els are closer to the observed event runoff with AMC II and AMC III conditions, especially in that the modified SCS-CN model (λ=0.05) can adequately describe almost all the runoff events. The above results indicate that the AMC plays a significant role in rainfall-runoff production and estimation, and the modified SCS-CN model (λ=0.05) can account for most of the AMC conditions.
0 4 8 12 16
0 4 8 12 16
Observed runoff (mm)
S
imu
la
te
d r
u
n
o
ff
(
mm)
1:1 line
Original SCS-CN (λ=0.2)
0 4 8 12 16
0 4 8 12 16
Observed runoff (mm)
Si
m
u
la
te
d
ru
n
o
ff (m
m
)
1:1 line
Original SCS-CN (λ=0.05)
0 4 8 12 16
0 4 8 12 16
Observed runoff (mm)
S
im
u
la
te
d r
uno
ff
(
m
m
)
1:1 line
Modified SCS-CN (λ=0.2)
0 4 8 12 16
0 4 8 12 16
Observed runoff (mm)
Si
m
u
la
te
d
ru
n
o
ff (m
m
)
1:1 line
Modified SCS-CN (λ=0.05)
λ λ λ
λ
(c) (d) (b) (a)
Fig. 5.Comparison between observed and predicted event runoff using(a)original SCS-CN (λ=0.2),(b)original SCS-CN (λ=0.05),(c)
modified SCS-CN (λ=0.2) and(d)modified SCS-CN (λ=0.05) models for Group 3 runoff plots.
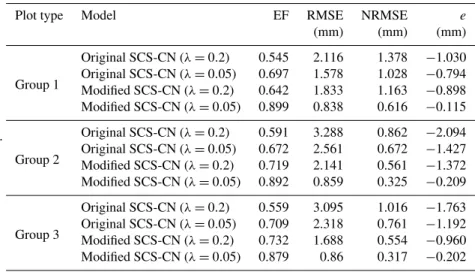
and the modified SCS-CN model (λ=0.2) do. The EF val-ues of the modified SCS-CN model (λ=0.05) are 0.899 for Group 1 plot, 0.892 for Group 2 plot, and 0.879 for Group 3 plot. The bias values of the other three models are negative (most of them are less than−1 mm; see Table 4), indicat-ing that these three models substantially underestimate the event runoff, as shown from Figs. 3, 4 and 5. The above com-parison results of the model performance evaluation criteria further prove the advantages of the modified SCS-CN model (λ=0.05) over the other three models.
The simulated efficiency of the modified SCS-CN model is also compared with other studies that used the SCS-CN method to simulate event plot runoff in the Loess Plateau. Fu et al. (2011) used SCS-CN with λ=0.05 to simulate runoff from farmland plots in Zizhou (205 rainfall events) and Xifeng (552 rainfall events) experiment stations, and the EF values were only 0.25 and 0.51, respectively. Huang et al. (2006) reported a EF value of 0.826 for the pasture and alfalfa plots in Xifeng, which was used in the CN equation (Eq. 15) to simulate runoff. The EF value of the SCS-CN method in which the CN value was a non-linear equation of surface soil moisture was 0.779 in the city of Suide (Huang et al., 2007). It should be noted that the parameters of the non-linear equation andλin Huang et al. (2007) were determined
by optimization, whereas in this study all the parameters in the SCS-CN model were independently determined. The ef-ficiency of the modified SCS-CN model (λ=0.05) is better than other forms of SCS-CN method in the above-mentioned studies conducted by other researches, as both the effects of antecedent moisture condition and slope gradient are explic-itly considered in the modified SCS-CN model.
4.2 Prediction results of event soil loss
The simulated event soil losses of the three runoff plot groups in 2008 are compared with the measurements for calibra-tion of the modified RUSLE model (Fig. 6). The estimated values of the empirical coefficients a and b in the modi-fied RUSLE model are 1.723 and 1.548, respectively. Thea
value lies in the range of the ratio between the soil erodibil-ity of the USLE-M and USLE (1.40–3.87) obtained by Kin-nell and Risse (1998). Furthermore, as noted by Bagarello et al. (2010), after using an exponent of the event rainfall-runoff erosivity (QREI30)term in the soil loss model, the
Table 4.Values of model performance evaluation criteria to predict event runoff of the three runoff plot groups
.
Plot type Model EF RMSE NRMSE e
(mm) (mm) (mm)
Group 1
Original SCS-CN (λ=0.2) 0.545 2.116 1.378 −1.030 Original SCS-CN (λ=0.05) 0.697 1.578 1.028 −0.794 Modified SCS-CN (λ=0.2) 0.642 1.833 1.163 −0.898 Modified SCS-CN (λ=0.05) 0.899 0.838 0.616 −0.115
Group 2
Original SCS-CN (λ=0.2) 0.591 3.288 0.862 −2.094 Original SCS-CN (λ=0.05) 0.672 2.561 0.672 −1.427 Modified SCS-CN (λ=0.2) 0.719 2.141 0.561 −1.372 Modified SCS-CN (λ=0.05) 0.892 0.859 0.325 −0.209
Group 3
Original SCS-CN (λ=0.2) 0.559 3.095 1.016 −1.763 Original SCS-CN (λ=0.05) 0.709 2.318 0.761 −1.192 Modified SCS-CN (λ=0.2) 0.732 1.688 0.554 −0.960 Modified SCS-CN (λ=0.05) 0.879 0.86 0.317 −0.202
reflect the impact of changing the event rainfall erosivity factor on soil erodibility. Figure 6 shows that the simulated event soil loss agrees well with the measured values. The EF, RMSE, NRMSE and e values of modified RUSLE model simulation results are 0.810, 0.163 t ha−1, 0.231 t ha−1 and 0.033 t ha−1, respectively. This again reflects the fact that the modified RUSLE model is well calibrated.
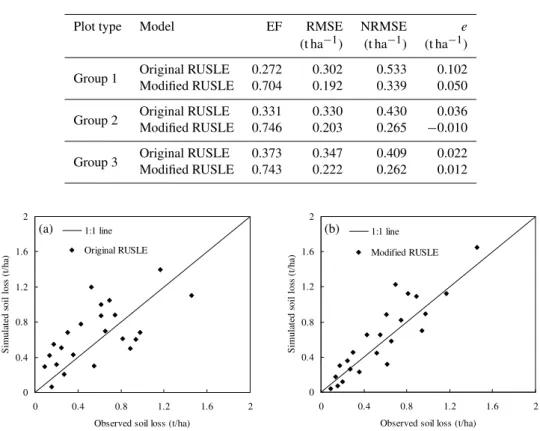
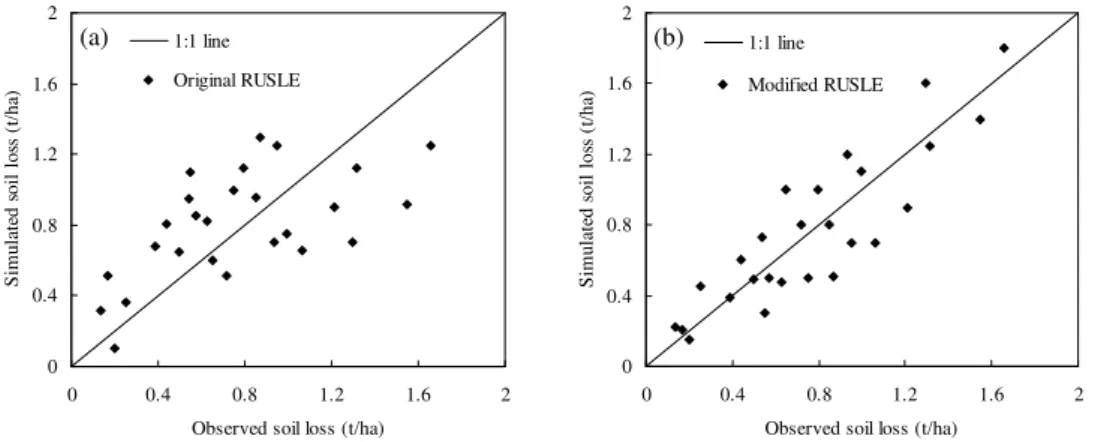
Figures 7, 8 and 9 show the comparison between the ob-served and predicted event soil loss of the Group 1, Group 2 and Group 3 runoff plots during the rainy season of 2009– 2011. The predicted event soil loss of the original RUSLE model is significantly different from the observed ones. In general, the original RUSLE model overestimates low event soil losses and underestimates high event soil losses (Figs. 7a, 8a and 9a), which have also been indicated by Kin-nell (2005, 2007, 2010). With respect to the original RUSLE model, the predicting results of the modified RUSLE model are more satisfactory (Figs. 7b, 8b and 9b). The better per-formance of the modified RUSLE model is also supported by its larger EF and smaller RMSE, NRMSE andevalues than those of the original RUSLE model, as shown in Ta-ble 5. The EF values of the modified RUSLE model are over 0.70, whereas those of the original RUSLE are only about 0.30.
Besides using the estimatedQRfrom the modified
SCS-CN model, we also used Eq. (14) with the measured runoff ratio to simulate the event soil loss. This is necessary to separately establish the approximations from the modified RUSLE model’s structure and from the unavoidable uncer-tainties associated with runoff estimation. The EF values of the modified RUSLE model with measured runoff ratio for Group 1, Group 2 and Group 3 runoff plots are 0.816, 0.865 and 0.847, respectively. The performance of the modified RUSLE model with the measured runoff ratio improves to some degree compared to that with the estimated runoff ra-tio. Furthermore, with the measured runoff ratio, the
mod-0 0.4 0.8 1.2 1.6 2
0 0.4 0.8 1.2 1.6 2 Observed soil loss (t/ha)
S
im
u
la
te
d
s
o
il
lo
ss
(
t/h
a)
1:1 line
Modified RUSLE
Fig. 6.Comparison between observed and simulated event soil loss
using observed data of the three runoff plot groups in 2008 to cali-brate the modified RUSLE model.
ified RUSLE model can better account for observed varia-tions in sediment yield of plots with different lengths. This result indicates that including runoff coefficient in the ero-sivity term is the base for the satisfactory performance of the modified RUSLE model, and that developing procedures for accurately estimating the runoff coefficient is desirable, as it can further improve the soil loss prediction and has practical importance.
4.3 Physical interpretation of model performance
Table 5.Values of model performance evaluation criteria to predict event soil loss of the three runoff plot groups.
Plot type Model EF RMSE NRMSE e
(t ha−1) (t ha−1) (t ha−1)
Group 1 Original RUSLE 0.272 0.302 0.533 0.102 Modified RUSLE 0.704 0.192 0.339 0.050
Group 2 Original RUSLE 0.331 0.330 0.430 0.036 Modified RUSLE 0.746 0.203 0.265 −0.010
Group 3 Original RUSLE 0.373 0.347 0.409 0.022 Modified RUSLE 0.743 0.222 0.262 0.012
0 0.4 0.8 1.2 1.6 2
0 0.4 0.8 1.2 1.6 2
Observed soil loss (t/ha)
S
imula
te
d
so
il
los
s (
t/
h
a)
1:1 line
Original RUSLE
0 0.4 0.8 1.2 1.6 2
0 0.4 0.8 1.2 1.6 2
Observed soil loss (t/ha)
Simu
la
te
d
s
o
il
lo
ss
(
t/h
a)
1:1 line
Modified RUSLE
(b) (a)
Fig. 7.Comparison between observed and predicted event soil loss during 2009–2011 using(a)original RUSLE and(b)modified RUSLE
models for Group 1 runoff plots.
explicitly consider the effect of antecedent moisture amount in soil on production of runoff. For the rainfall events that have large P5, there is a considerable amount of water in
the soil before the start of rainstorm, which can reduce in-filtration and enhance runoff, whereas the original SCS-CN model assumes that the soil is complete dry (Eq. 2), and the effect of antecedent moisture is ignored. Therefore, even though the initial abstraction can be reasonably estimated with λ=0.05, the original SCS-CN model can only pre-dict the low event runoff accurately with small or no an-tecedent moisture, and still underestimates the event runoff produced by the rainfall events that have largeP5. After
con-sideration of the antecedent moisture, the prediction perfor-mance of modified SCS-CN model substantially improves withλ=0.05, but there are still considerable errors for the modified SCS-CN model with λ=0.2. Therefore, the an-tecedent moisture should be directly incorporated into the SCS-CN model (Eq. 6) andλ=0.05 is suitable for the initial abstraction coefficient in the study area. Combined effects of the above two factors result in the good performance of the modified SCS-CN model (λ=0.05) compared to the other three models.
In rainfall erosion, soil particle detachment is caused by raindrops impacting the soil surface and by flow shear. Sedi-ment downslope transport is mainly driven by the interaction
between raindrop impact and flow (raindrop-induced salta-tion and rolling) or by flow alone (flow-driven saltasalta-tion and rolling) (Kinnell, 2010). Therefore, rainfall drives the start of the soil loss, but both the rainfall and the runoff play an im-portant role in producing sediment yield across the downs-lope boundary of an area. Although empirical relationships tend to exist between runoff amount and E, and between peak runoff rate andI30, this implicit embedding through the EI30 index in the original RUSLE model cannot deal with
the effect of runoff on soil loss and the response of soil loss to changes in the initial soil moisture status (Kinnell, 2010). This accounts for the failure of the original RUSLE model to reasonably predict event soil loss. The detailed reason for overestimation of low event soil losses and the underestima-tion of high event soil loss by the original RUSLE model needs further investigation.
The better performance of the modified RUSLE model is caused by two reasons. Firstly, the effect of runoff is di-rectly considered in the modified RUSLE model through the rainfall-runoff erosivity index (Eq. 14). Secondly, the predic-tion accuracy level of event runoff achieved by the modified SCS-CN model (λ=0.05) is sufficient, which ensures the ability ofQREI30index to predict event erosion. Moreover,
0 0.4 0.8 1.2 1.6 2
0 0.4 0.8 1.2 1.6 2
Observed soil loss (t/ha)
S
imula
te
d s
o
il
l
o
ss
(
t/
h
a)
1:1 line
Original RUSLE
0 0.4 0.8 1.2 1.6 2
0 0.4 0.8 1.2 1.6 2
Observed soil loss (t/ha)
S
imula
te
d
so
il
los
s (
t/
h
a)
1:1 line
Modified RUSLE
(b) (a)
Fig. 8.Comparison between observed and predicted event soil loss during 2009–2011 using(a)original RUSLE and(b)modified RUSLE
models for Group 2 runoff plots.
0 0.4 0.8 1.2 1.6 2
0 0.4 0.8 1.2 1.6 2
Observed soil loss (t/ha)
S
imula
te
d s
o
il
l
o
ss
(
t/
h
a)
1:1 line
Original RUSLE
0 0.4 0.8 1.2 1.6 2
0 0.4 0.8 1.2 1.6 2
Observed soil loss (t/ha)
S
imula
te
d s
o
il
l
o
ss
(
t/ha
)
1:1 line
Modified RUSLE
(b) (a)
Fig. 9.Comparison between observed and predicted event soil loss during 2009–2011 using(a)original RUSLE and(b)modified RUSLE
models for Group 3 runoff plots.
ability of the modified RUSLE model to account for vari-ations in event soil loss. It may also improve the potential of the model to react to spatial variations in runoff and soil loss that resulted from spatial variations in soil and vegeta-tion (Kinnell, 2010).
4.4 Discussion of the proposed approach
The proposed approach in this study coupled the modi-fied SCS-CN and RUSLE models to link the rainfall-runoff-erosion modeling. It has the following advantages. Firstly, it substantially incorporates AMC in runoff production and directly considers runoff in soil loss to overcome the major disadvantage of the traditional SCS-CN and RUSLE mod-els. Secondly, main stand and vegetation conditions of runoff plot (e.g. soil property, plot scale, plot slope, vegetation type, and vegetation cover), which are critical to runoff and soil loss, are explicitly incorporated into the model param-eters. Thirdly, compared to models such as WEPP and EU-OSEM, the proposed approach is straightforward, and almost all of the parameters (only empirical coefficientsaandb in
the modified RUSLE model are optimized) can be indepen-dently determined from observations without using measured rainfall-runoff and soil loss data. Finally, it accurately pre-dicts event runoff and soil loss of different type of restor-ing vegetation in the Loess Plateau, which has complex ge-ographical and climatic conditions. Results with reasonable accuracy could be expected in other regions. These advan-tages ensure that the proposed approach is useful for general applications. However, the approach still has its limitations.
Firstly, the physical base of determining antecedent mois-ture amount withP5is not robust and clear (Michel et al.,
2005; Sahu et al., 2010), and it is not adequate to represent antecedent moisture condition only by the antecedent rain-fall (Ali and Roy, 2010). In this study, the P5 was used as
an indicator of the antecedent soil moisture conditions. It was employed both forM estimation (Eq. 9) and for mod-ulating the CNI and CNIII values (Eqs. 16 and 17). In this
Many studies have compared the use of in situ (and mod-eled) soil moisture observations with the other indices based on antecedent rainfall, baseflow and groundwater table for the estimation ofS (Brocca et al., 2009a; Tramblay et al., 2010, 2011; Coustau et al., 2012). Additionally, satellite-derived soil moisture observations have been employed for this purpose (Brocca et al., 2009b, 2011b; Beck et al., 2010). In all of these studies, the common aspect is that actual soil moisture, especially the moisture of surface soil layer, is the best indicator of soil moisture conditions and is more corre-lated with theSor CN parameters of the SCS-CN model than antecedent precipitation (Huang et al., 2007; Tramblay et al., 2010). Therefore, it is necessary to estimateS or CN values continuously to allow representation of varying soil moisture conditions. Huang et al. (2007) proposed a non-linear equa-tion between the measured CN values and soil moisture val-ues in the top 15 cm of soil in the runoff plots of the Loess Plateau, China. Brocca et al. (2009a) incorporated actual soil moisture observation for the direct estimation of theS pa-rameter by assuming a simple linear relationship in Central Italy, which has also been used in a continuous rainfall-runoff model to obtain a low parameterized but reliable modeling tool aimed at flood simulation (Brocca et al., 2010, 2011a). Unfortunately, because the soil moisture data are not avail-able from the field experiment to directly determineSor CN values, it is difficult to incorporate the above approach into the modified SCS-CN model in this study.
Secondly, the developed models are unable to account for plot-scale effects of runoff and soil loss, and its applicability should be further verified at long plots. For runoff simulation, the SCS-CN model was originally proposed for catchment-scale hydrologic modeling. Although it has been applied at plot scale (Shen et al., 2003; Huang et al., 2006, 2007; Fu et al., 2011), the suitability of using data collected at relatively short plots (not longer than 13 m in this study) to check the applicability of the SCS-CN model needs further investiga-tion. Furthermore, the study of Liu et al. (2012) indicated that the runoff coefficient increased with plot length in Group 1 plots, while it decreased with increasing plot length in Group 2 and Group 3 plots. There is also some evidence that runoff decreases with plot length (Joel et al., 2002; Parsons et al., 2006). However, the SCS-CN model is unable to take the ef-fect of plot length on runoff into consideration. A potential solution to this problem is to incorporate established scale-parameter relationships into the model. Moreover, agricul-tural fields are generally longer. The applicability of the de-veloped SCS-CN model on relatively long fields should be tested.
According to the USLE/RUSLE scheme, soil loss per unit area should increase with plot length. However, according to the literature, an increasing relationship was often not de-tected. For example, field observations in the Negev High-lands showed that frequency and magnitude of the specific runoff yield decreased with increasing area as a result of flow discontinuity and deposition processes along the
hill-slope (Yair and Raz-Yassif, 2004). Moreno-de las Heras et al. (2010) observed that unit area sediment yield de-clined with increasing plot length for the undisturbed and moderately disturbed sites, but it actually increased for the highly disturbed sites, which was especially clear under high-intensity rainfall conditions in a Mediterranean dry environ-ment. Therefore, the plot-scale effects of runoff and erosion were dependent on the extent of degradation. Liu et al. (2012) found that soil loss rates decreased with the plot area in Group 2 and Group 3 plots with longer restoration time, but they increased over an area threshold in Group 1 plot located at the early stage of revegetation, which was not totally con-sistent with the USLE/RUSLE model. One of the main rea-sons for the complex plot-scale effects of soil loss is the con-nectivity and distribution of runoff and sediment source and sink areas on hillslope (Yair and Raz-Yassif, 2004; Parsons et al., 2006; Moreno-de las Heras et al., 2010). Therefore, not only plot length, but the other factors such as rainfall regime, soil property, and vegetation cover contribute to scale varia-tions of runoff and soil loss. As indicated by Kinnell (2008), considering the runoff coefficient as a factor in the RUSLE model can capture the plot-scale effects of soil loss to some extent, which is also proved by the simulation results of mod-ified RUSLE model with the measured runoff ratio in this study. However, as a conceptual model, the physical base and model structure make the modified RUSLE model difficult to fully incorporate the scale variations of sediment yield, and further studies are needed to test its applicability on long plots.
5 Conclusions
In this study, the modified SCS-CN and RUSLE models were coupled to predict event runoff and soil loss from restoring vegetation plots in the Loess Plateau of China. The effects of antecedent moisture condition on runoff production (Eq. 6) and initial abstraction (Eq. 11) were explicitly accounted for in the modified SCS-CN model. Antecedent moisture condi-tion, slope gradient and initial abstraction ratio were incor-porated to determine the curve number, and two initial ab-straction coefficient values (λ=0.05, 0.2) were used in the SCS-CN model. In the modified RUSLE model, direct ef-fect of runoff on event soil loss was considered by adopting a rainfall-runoff erosivity index (QREI30)to replace the tradi-tional rainfall erosivity factor (EI30)(Eq. 14). By determin-ing the runoff ratioQR, the rainfall-runoff-erosion modeling
was linked with predicted runoff of the modified SCS-CN model.
The simulation results indicated that the original SCS-CN model (λ=0.05, 0.2) and modified SCS-CN model (λ=0.2) underestimated the event runoff, especially for the rainfall events that have large 5-day antecedent precipita-tion. Compared to these three models, the modified SCS-CN model (λ=0.05) accurately predicted event runoff with Nash-Sutcliffe model efficiency (EF) greater than 0.85. The original RUSLE model overestimated low values of mea-sured soil loss and underpredicted the high values, whereas the modified RUSLE model could well predict both the small and large event soil loss with EF over 0.70.
It can be found from this study that the antecedent mois-ture should be directly incorporated into the SCS-CN model andλ=0.05 is suitable for the initial abstraction coefficient in the study area. Direct consideration of runoff in the event rainfall-runoff erosivity can substantially improve the capac-ity of the RUSLE model to predict event soil loss. Coupling the modified SCS-CN and RUSLE models has great practical importance for runoff and soil loss simulation in the Loess Plateau. The main advantages, limitations and future study scopes of the proposed models were also discussed in detail. This evaluation is useful for future model applications and additional model development.
Acknowledgements. This research was financially supported by the National Natural Science Foundation of China (Grant Nos. 41101096, 40930528 and 41171156), Open Fund from State Key Laboratory of Soil Erosion and Dryland Farming on the Loess Plateau (Grant No. 10501-280), and the CAS/SAFEA International Partnership Program for Creative Research Teams of “Ecosystem Processes and Services”. We thank the editor Lixin Wang, the two anonymous reviewers and Luca Brocca for their constructive comments which improved the overall quality of the manuscript. Edited by: L. Wang
References
Ali, G. A. and Roy, A. G.: A case study on the use of appropri-ate surrogappropri-ates for antecedent moisture conditions (AMCs), Hy-drol. Earth Syst. Sci., 14, 1843–1861, doi:10.5194/hess-14-1843-2010, 2010.
Bagarello, V., Di Piazza, G. V., Ferro, V., and Giordano, G.: Predict-ing unit plot soil loss in Sicily, south Italy, Hydrol. Process., 22, 586–595, 2008.
Bagarello, V., Ferro, V., and Giordano, G.: Testing alternative ero-sivity indices to predict event soil loss from bare plots in South-ern Italy, Hydrol. Process., 24, 789–797, 2010.
Baltas, E. A., Dervos, N. A., and Mimikou, M. A.: Technical Note: Determination of the SCS initial abstraction ratio in an experi-mental watershed in Greece, Hydrol. Earth Syst. Sci., 11, 1825– 1829, doi:10.5194/hess-11-1825-2007, 2007.
Bartley, R., Corfield, J. P., Abbott, B. N., Hawdon, A. A., Wilkin-son, S. N., and NelWilkin-son, B.: Impacts of improved grazing land management on sediment yields, Part 1: hillslope processes, J. Hydrol., 389, 237–248, 2010.
Beasley, D. B., Huggins, L. F., and Monke, E. J.: ANSWERS: a model for watershed planning, Trans. ASAE, 23, 938–944, 1980. Beck, H. E., de Jeu, R. A. M., Schellekens, J., van Dijk, A. I. J. M., and Bruijnzeel, L. A.: Improving Curve Number based storm runoff estimates using soil moisture Proxies, IEEE J. Sel. Top. Appl. Earth Observ. Remote Sens, 2, 1939–1404, 2010. Brocca, L., Melone, F., Moramarco, T., and Morbidelli, R.:
An-tecedent wetness conditions based on ERS scatterometer data, J. Hydrol., 364, 73–87, 2009a.
Brocca, L., Melone, F., Moramarco, T., and Singh, V. P.: Assimila-tion of observed soil moisture data in storm rainfall-runoff mod-eling, J. Hydrol Eng. ASCE, 14, 153–165, 2009b.
Brocca, L., Melone, F., Moramarco, T., Wagner, W., Naeimi, V., Bartalis, Z., and Hasenauer, S.: Improving runoff prediction through the assimilation of the ASCAT soil moisture product, Hydrol. Earth Syst. Sci., 14, 1881–1893, doi:10.5194/hess-14-1881-2010, 2010.
Brocca, L., Melone, F., and Moramarco, T.: Distributed rainfall-runoff modeling for flood frequency estimation and flood fore-casting, Hydrol. Process., 25, 2801–2813, 2011a.
Brocca, L., Melone, F., Moramarco, T., and Wagner, W.: What per-spective in remote sensing of soil moisture for hydrological ap-plications, Proc. SPIE 8174, 81740A, doi:10.1117/12.898034, 2011b.
Brown, L. C. and Foster, G. R.: Storm erosivity using idealized in-tensity distribution, Trans. ASAE, 30, 379–386, 1987.
Cao, S. X., Chen, L., and Yu, X. X.: Impact of China’s Grain for Green Project on the landscape of vulnerable arid and semi-arid agricultural regions: a case study in northern Shaanxi Province, J. Appl. Ecol., 46, 536–543, 2009.
Coustau, M., Bouvier, C., Borrell-Estupina, V., and Jourde, H.: Flood modelling with a distributed event-based parsi-monious rainfall-runoff model: case of the karstic Lez river catchment, Nat. Hazards Earth Syst. Sci., 12, 1119–1133, doi:10.5194/nhess-12-1119-2012, 2012.
Feng, X. M., Sun, G., Fu, B. J., Su, C. H., Liu, Y., and Lam-parski, H.: Regional effects of vegetation restoration on water yield across the Loess Plateau, China, Hydrol. Earth Syst. Sci. Discuss., 9, 4161–4191, doi:10.5194/hessd-9-4161-2012, 2012. Fu, B. J., Zhao, W. W., Chen, L. D., Zhang, Q. J., L¨u, Y. H., Gulick,
H., and Poesen, J.: Assessment of soil erosion at large watershed scale using RUSLE and GIS: a case study in the Loess Plateau of China, Land Degrad. Dev., 16, 73–85, 2005.
Fu, S., Zhang, G., Wang, N., and Luo, L.: Initial abstraction ra-tio in the SCS-CN method in the Loess Plateau of China, Trans. ASABE, 54, 163–169, 2011.
Garcia-Estringana, P., Alonso-Bl´azquez, N., Marques, M. J., Bi-enes, R., and Alegre, J.: Direct and indirect effects of Mediter-ranean vegetation on runoff and soil loss, Eur. J. Soil Sci., 61, 174–185, 2010.
Hawkins, R. H., Hjelmfelt, A. T., and Zevenbergen, A. W.: Runoff probability, storm depth and curve numbers, J. Irrig. Drain. Eng. ASCE, 111, 330–340, 1985.
Hawkins, R. H., Jiang, R., Woodward, D. E., Hjelmfelt, A. T., Van Mullem, J. A., and Quan, Q. D.: Runoff curve number method: examination of the initial abstraction ratio, in: Proceedings of the Second Federal Interagency Hydrologic Modeling Conference, Las Vegas, US Geological Survey, Lakewood, Colorado, 2002. Huang, M. B., Gallichand, J., Wang, Z. L., and Goulet, M.: A
mod-ification to the Soil Conservation Service curve number method for steep slopes in the Loess Plateau of China, Hydrol. Process., 20, 579–589, 2006.
Huang, M. B., Gallichand, J., Dong, C. Y., Wang, Z. L., and Shao, M. A.: Use of moisture data and curve number method for es-timating runoff in the Loess Plateau of China, Hydrol. Process., 21, 1471–1481, 2007.
Jiang, Z. S., Wang, Z. Q., and Liu, Z.: Quantitative study on spatial variation of soil erosion in a small watershed in the loess hilly region, J. Soil Water Conserv., 2, 1–9, 1996 (in Chinese). Joel, A., Messing, I., Seguel, O., and Casanova, M.: Measurement
of surface water runoff from plots of two different sizes, Hydrol. Process., 16, 1467–1478, 2002.
Kinnell, P. I. A.: Why the universal soil loss equation and the revised version of it do not predict event erosion well, Hydrol. Process., 19, 851–854, 2005.
Kinnell, P. I. A.: Runoff dependent erosivity and slope length fac-tors suitable for modeling annual erosion using the Universal Soil Loss Equation, Hydrol. Process., 21, 2681–2689, 2007. Kinnell, P. I. A.: Comment on “Scale relationships in hillslope
runoff and erosion” (Earth Surface Processes and Landforms 31: 1364–1383 (2006)), Earth Surf. Proc. Land., 33, 1632–1636, 2008.
Kinnell, P. I. A.: Comment on “SCS-CN based time distributed sed-iment yield model” by Tyagi et al. Journal of Hydrology 352 (2008) 388–403, J. Hydrol., 367, 293–294, 2009.
Kinnell, P. I. A.: Event soil loss, runoff and the Universal Soil Loss Equation family of models: A review, J. Hydrol., 385, 384–397, 2010.
Kinnell, P. I. A. and Risse, L. M.: USLE-M: Empirical modelling rainfall erosion through runoff and sediment concentration, Soil Sci. Soc. Am. J., 62, 1667–1672, 1998.
Knisel, W. G.: CREAMS: a field-scale model for chemical, runoff and erosion from agricultural management systems, Conserva-tion Research Report, vol. 26, South East Area, US Department
of Agriculture, Washington, DC, 1980.
Li, Y., Poesen, J., Yang, J. C., Fu, B., and Zhang, J. H.: Evaluating gully erosion using137Cs and210Pb/137Cs ratio in a reservoir catchment, Soil Till. Res., 69, 107–115, 2003.
Liu, G. S., Jiang, N. H., Zhang, L. D., and Liu, Z. L.: Soil Physical and Chemical Analysis and Description of Soil Profile, Chinese Standardization Publishing House, Beijing, 1996 (in Chinese). Liu, Y., Fu, B. J., L¨u, Y. H., Wang, Z., and Gao, G. Y.: Hydrological
responses and soil erosion potential of abandoned cropland in the Loess Plateau, China, Geomorphology, 138, 404–414, 2012. L¨u, Y. H., Fu, B. J., Feng, X. M., Zeng, Y., Liu, Y., Chang,
R. Y., Sun, G., and Wu, B. F.: A policy-driven large scale ecological restoration: quantifying ecosystem services changes in the Loess Plateau of China, PLoS ONE, 7, e31782, doi:10.1371/journal.pone.0031782, 2012.
Michel, C., Andr´eassian, V., and Perrin, C.: Soil conservation ser-vice curve number method: how to mend a wrong soil mois-ture accounting procedure?, Water Resour. Res., 41, W02011, doi:10.1029/2004WR003191, 2005.
Mishra, S. K. and Singh, V. P.: SCS-CN-based hydrologic simula-tion package, in: Mathematical Models in Small Watershed Hy-drology and Applications, edited by: Singh, V. P. and Frevert, D. K., Water Resources Publications, Littleton, Colorado, 391–464, 2002.
Mishra, S. K. and Singh, V. P.: Soil Conservation Service Curve Number (SCS-CN) Methodology, Kluwer Academic Publishers, Dordrecht, The Netherlands, 2003.
Mishra, S. K., Sahu, R. K., Eldho, T. I., and Jain, M. K.: An im-proved Ia-S relation incorporating antecedent moisture in SCS-CN methodology, Water Resour. Manag., 20, 643–660, 2006a. Mishra, S. K., Tyagi, J. V., Singh, V. P., and Sing, R.: SCS-CN
mod-eling of sediment yield, J. Hydrol., 324, 301–322, 2006b. Mishra, S. K., Pandey, R. P., Jain, M. K., and Singh, V. P.: A rain
duration and modified AMC-dependent SCS-CN procedure for long duration rainfall-runoff events, Water Resour. Manag., 22, 861–876, 2008.
Moreno-de las Heras, M., Merino-Mart´ın, L., and Nicolau, J. M.: Effect of vegetation cover on the hydrology of reclaimed mining soils under Mediterranean-Continental climate, Catena, 77, 39– 47, 2009.
Moreno-de las Heras, M., Nicolau, J. M., Merino-Mart´ın, L., and Wilcox, B. P.: Plot-scale effects on runoff and erosion along a slope degradation gradient, Water Resour. Res., 46, W04503, doi:10.1029/2009WR007875, 2010.
Nearing, M. A.: A single continuous function for slope steepness influence on soil loss, Soil Sci. Soc. Am. J., 61, 917–919, 1997. Neitsch, S. L., Arnold, J. G., Kiniry, J. R., and Williams, J. R.: Soil
and water assessment tool theoretical documentation, Texas Wa-ter Resources Institute, College Station, TX, 2005.
Parsons, A. J., Brazier, R. E., Wainwright, J., and Powell, D. M.: Scale relationships in hillslope runoff and erosion, Earth Surf. Proc. Land., 31, 1384–1393, 2006.
Podwojewski, P., Janeau, J. L., Grellier, S., Valentin, C., Lorentz, S., and Chaplot, V.: Influence of grass soil cover on water runoff and soil detachment under rainfall simulation in a sub-humid South African degraded rangeland, Earth Surf. Proc. Land., 36, 911– 922, 2011.
Rendard, K. G., Foster, G. R., Weesies, G. A., McCool, D. K., and Yoder, D. C.: Predicting Soil Erosion by Water: A Guide to Con-servation Planning with the Revised Universal Soil Loss Equa-tion (RUSLE), Agricultural Handbook, No. 703, US Department of Agriculture, Washington, DC, 1997.
Risse, L. M., Nearing, M. A., Nicks, A. D., and Laflen, J. M.: Error assessment in the Universal Soil Loss Equation, Soil Sci. Soc. Am. J., 57, 825–833, 1993.
Sahu, R .K., Mishra, S. K., and Eldho, T. I.: An improved AMC-coupled runoff curve number model, Hydrol. Process., 24, 2834– 2839, 2010.
Sharpley, N. and Williams, J. R. (Eds.): EPIC-Erosion Productivity Impact Calculator: 1. Model Documentation, USDA Tech. Bull. No. 1768, 1990.
Shen, Y. F., Qin, Q. J., and Wu, Y. H.: Researches of the effects of vegetation types on soil erosion on Loess Plateau, Acta Agricul-turae Boreali-occidentails Sinica, 12, 5–8, 2003 (in Chinese). Shi, Z. H., Chen, L. D., Fang, N. F., Qin, D. F., and Cai, C. F.:
Research on the SCS-CN initial abstraction ratio using rainfall-runoff event analysis in the Three Gorges Area, China, Catena, 77, 1–7, 2009.
Suresh Babu, P. and Mishra, S. K.: An improved SCS-CN-inspired model, J. Hydrol. Eng., doi:10.1061/(ASCE)HE.1943-5584.0000435, in press, 2012.
Tiwari, A. K., Rosse, L. M., and Nearing, M. A.: Evaluation of WEPP and its comparison with USLE and RUSLE, Trans. ASAE, 43, 1129–1135, 2000.
Tramblay, Y., Bouvier, C., Martin, C., Didon-Lescot, J.-F., Todor-ovik, D., and Domergue, J.-M.: Assessment of initial soil mois-ture conditions for event-based rainfall-runoff modeling, J. Hy-drol., 387, 176–187, 2010.
Tramblay, Y., Bouvier, C., Ayral, P.-A., and Marchandise, A.: Im-pact of rainfall spatial distribution on rainfall-runoff modelling efficiency and initial soil moisture conditions estimation, Nat. Hazards Earth Syst. Sci., 11, 157–170, doi:10.5194/nhess-11-157-2011, 2011.
USDA-NRCS: National Engineering Handbook, Part 630 Hydrol-ogy, Chapter 9, Hydrological Soil-Cover Complexes, US Gov-ernment Printing Office, Washington, DC, 2004.
Wang, L., D’Odorico, P., Evans, J. P., Eldridge, D., McCabe, M. F., Caylor, K. K., and King, E. G.: Dryland ecohydrology and climate change: critical issues and technical advances, Hydrol. Earth Syst. Sci. Discuss., 9, 4777–4825, doi:10.5194/hessd-9-4777-2012, 2012.
Wang, Y. F., Fu, B. J., Chen, L. D., L¨u, Y. H., and Luo, C. Y.: Effects of land use change on soil erosion intensity in small watershed of Loess Hilly Region: A quantitative evaluation with 137-Cesium tracer, Chinese Journal of Applied Ecology, 20, 1571–1576, 2009 (in Chinese).
Wei, W., Chen, L. D., and Fu, B. J.: Responses of water erosion to rainfall extremes and vegetation types in a loess semiarid hilly area, NW China, Hydrol. Process., 23, 1780–1791, 2009a. Wei, W., Chen, L. D., and Fu, B. J.: Effects of rainfall change on
water erosion processes in terrestrial ecosystems: a review, Prog. Phys. Geogr., 33, 307–318, 2009b.
Wischmeier, W. H. and Smith, D. D.: Predicting Rainfall Erosion Losses: A Guide to Conservation Planning, Agricultural Hand-book, No. 537, US Department of Agriculture, Washington, DC, 1978.
Xiao, B., Wang, Q. H., Fan, J., Han, F. P., and Dai, Q. H.: Applica-tion of the SCS-CN model to runoff estimaApplica-tion in a small water-shed with high spatial heterogeneity, Pedosphere, 21, 738–749, 2011.
Yair, A. and Raz-Yassif, N.: Hydrological processes in a small arid catchment: scale effects of rainfall and slope length, Geomor-phology, 61, 155–169, 2004.
Young, R. A., Onstad, C. A., Bosch, D. D., and Anderson, W. P.: AGNPS: a nonpoint-source pollution model for evaluating agri-cultural watersheds, J. Soil Water Conserv., 44, 168–173, 1989. Zhang, X. C. and Liu, W. Z.: Simulating potential response of
hy-drology, soil erosion, and crop productivity to climate change in Changwu tableland region on the Loess Plateau of China, Agr. Forest Meteorol., 131, 127–142, 2005.