Submitted31 October 2013 Accepted 14 April 2014 Published17 June 2014
Corresponding author
Kimberly M. Dohms, kim.dohms@uleth.ca
Academic editor
Michael Wink
Additional Information and Declarations can be found on page 7
DOI10.7717/peerj.371
Copyright
2014 Dohms and Burg
Distributed under
Creative Commons CC-BY 3.0
OPEN ACCESS
Limited geographic genetic structure
detected in a widespread Palearctic
corvid,
Nucifraga caryocatactes
Kimberly M. Dohms and Theresa M. Burg
Department of Biological Sciences, University of Lethbridge, Lethbridge, AB, Canada
ABSTRACT
The Eurasian or spotted nutcracker (Nucifraga caryocatactes) is a widespread resident corvid found throughout the Palearctic from Central Europe to Japan. Characterized by periodic bouts of irruptive dispersal in search ofPinusseed crops, this species has potential for high levels of gene flow across its range. Previous analysis of 11 individu-als did not find significant range-wide population genetic structure. We investigated population structure using 924 base pairs of mitochondrial DNA control region sequence data from 62 individuals from 12 populations distributed throughout the nutcracker’s range. We complemented this analysis by incorporating additional genetic data from previously published sequences. High levels of genetic diversity and limited population genetic structure were detected suggesting that potential barriers to dispersal do not restrict gene flow in nutcrackers.
Subjects Biogeography, Ecology, Evolutionary Studies
Keywords Nucifraga caryocatactes, Eurasian nutcracker, Phylogeography, Palearctic distribution, Corvid, Mitochondrial DNA
INTRODUCTION
In Eurasia, phylogeographic studies of many widespread vertebrate species have revealed a variety of geographical patterns of population structure influenced by current and historical landscapes, with little overall consensus among species. Using mitochondrial DNA, east–west splits have been documented for a variety of vertebrates including bats (Flanders et al., 2009), and several avian species (e.g., Eurasian magpie (Pica pica;
Figure 1 Nutcracker tissue sample locations throughout Eurasia.Black squares denote locations; cor-responding abbreviations are labelled beside squares. Refer toTable 1andTable S1for further location information. Black diamonds denote locations of previously published partial control region sequences obtained from GenBank with corresponding sample codes fromHaring, Gamauf & Kryukov (2007).
mountain ranges (e.g., Ural Mountains), large areas of inhospitable habitat (e.g., Tibetan Plateau), or large bodies of water.
The Eurasian nutcracker (Nucifraga caryocatactes, Linnaeus, 1758) is a corvid with a widespread Palearctic distribution. Although generally classified as a resident species of continental coniferous forests, nutcrackers are known to irruptively disperse to take ad-vantage of mast conifer seed crops (Haring, Gamauf & Kryukov, 2007), similar to its North American sister species, Clark’s nutcracker (N. columbiana;Tomback, 1998). Strong geo-graphic genetic structure has not been found in Clark’s nutcracker, despite numerous po-tential physical barriers to dispersal and thus gene flow (Dohms & Burg, 2013). A previous study by Haring and colleagues (2007) found no population structure inN. caryocatactes
throughout Eurasia. However,Haring, Gamauf & Kryukov (2007)only used 11 specimens, thus additional data may shed further light on nutcracker population genetic structure.
In this study, we use a highly variable and rapidly evolving mitochondrial DNA marker, the control region, to further investigate population structure ofN. caryocatactesin Eurasia. Based on the ecology of this species, we predict little range-wide population genetic structure.
MATERIALS & METHODS
Samples
Tissue samples (n=62) collected throughout the Eurasian nutcracker’s range (Fig. 1)
of Washington (Table S1). Previously published control region (CR) sequences (n=11)
were obtained from GenBank (EU070770andEU070886–EU070895;Haring, Gamauf & Kryukov, 2007).
DNA extraction, PCR amplification, and sequencing
DNA from muscle samples stored in ethanol or lysis buffer was extracted using a modified Chelex extraction protocol (Walsh, Metzger & Higuchi, 1991;Burg & Croxall, 2001). A 924 bp fragment starting at position 46 of the control region (CR;Saunders & Edwards, 2000) was amplified using two primers: L46 SJ (5′-TTT GGC TAT GTA TTT CTT TGC-3′;
developed for Steller’s jay (Cyanocitta stelleri; T Birt & K Lemmen, 2005, unpublished data)) and H1030 JCR 18 (5′-TAA ATG ATT TGG ACA ATC TAG G-3′; developed for Aphelocomajays (Saunders & Edwards, 2000)). DNA was amplified in a Master gradient thermocycler (Eppendorf) in 25µL reactions with 1x goTaq Flexi buffer (Promega), 2.5 mM MgCl2, 200µM dNTP, 0.4µM of each primer, and 1 unit goTaq Flexi taq polymerase (Promega). DNA sequencing was performed on an ABI 3730xl DNA Analyzer at McGill University and G´enome Qu´ebec Innovation Centre.
Alignment and analysis
We edited and aligned sequences from chromatograms and an overlapping subset of 305 bp from previously published CR sequences from GenBank (Haring, Gamauf & Kryukov, 2007) using MEGA v5.0 (Tamura et al., 2007). Two unrooted statistical parsimony networks (95% probability) were constructed with TCS v1.21 (Clement, Posada & Crandall, 2000): one for the samples sequenced as part of this study (924 bp) and a second network for the 305 bp common fragment (this study;Haring, Gamauf & Kryukov, 2007). We calculated the number of haplotypes (Hn), haplotype diversity (Hd), and nucleotide
diversity (π) for museum samples using DnaSP v5.10 (Rozas et al., 2003).
RESULTS
Genetic analyses
We sequenced and aligned the 924 bp control region (CR) sequences for 62 individuals from 12 populations (Table 1; GenBank accession nos.KJ999615–KJ999676). We aligned 11 additional GenBank sequences (Haring, Gamauf & Kryukov, 2007) with sequences from our samples and obtained a 305 bp area of overlap. Statistical parsimony networks did not suggest strong geographic structure for the 924 bp sequence (Fig. 2), nor for the larger dataset using the overlapping 305 bp fragment for all 73 individuals (Fig. 3). Ncarcar5 could not be connected to the network in the larger dataset, which was also found by
Haring, Gamauf & Kryukov (2007).
Figure 2 Statistical parsimony network for 924 bp mitochondrial DNA sequence.Statistical parsimony network ofNucifraga caryocatactes for 924 bp of the mitochondrial DNA control region sequenced from museum samples (n=62). Each square represents one individual and colours correspond to author-defined populations, as per figure legend. Circles indicate inferred haplotypes. Refer toTable 1 for population abbreviations.
Figure 3 Statistical parsimony network of 305 bp mitochondrial DNA sequence.Statistical parsimony network ofNucifraga caryocatactesfor overlapping sequences of 305 bp of the mitochondrial control region (Domain II) sequenced from museum samples (n=62) and GenBank sequences (n=11;Haring, Gamauf & Kryukov, 2007). Each coloured square represents one individual and colours correspond to author-defined populations. Black solid circles indicate inferred haplotypes. Open circles represent haplotypes; text in circles represents GenBank sequences as perFig. 1andHaring, Gamauf & Kryukov (2007). Refer toTable 1for population abbreviations found in the legend.
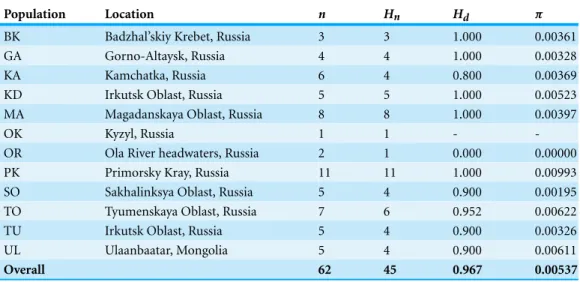
(Table 1). Nucleotide diversity ranged from 0.00000 (OR) to 0.00993 (PK;Table 1). Overall haplotype diversity (Hd) 0.967 and nucleotide diversity (π) was 0.00537.
DISCUSSION
Table 1 Diversity of a 924 bp mitochondrial DNA sequence.Haplotype diversity for a 924 bp fragment of mtDNA control region from 12 populations ofNucifraga caryocatactesthroughout Eurasia.
Population Location n Hn Hd π
BK Badzhal’skiy Krebet, Russia 3 3 1.000 0.00361
GA Gorno-Altaysk, Russia 4 4 1.000 0.00328
KA Kamchatka, Russia 6 4 0.800 0.00369
KD Irkutsk Oblast, Russia 5 5 1.000 0.00523
MA Magadanskaya Oblast, Russia 8 8 1.000 0.00397
OK Kyzyl, Russia 1 1 -
-OR Ola River headwaters, Russia 2 1 0.000 0.00000
PK Primorsky Kray, Russia 11 11 1.000 0.00993
SO Sakhalinksya Oblast, Russia 5 4 0.900 0.00195
TO Tyumenskaya Oblast, Russia 7 6 0.952 0.00622
TU Irkutsk Oblast, Russia 5 4 0.900 0.00326
UL Ulaanbaatar, Mongolia 5 4 0.900 0.00611
Overall 62 45 0.967 0.00537
Notes.
n, number of individuals in population;Hn, number of haplotypes;Hd, haplotype diversity;π, nucleotide diversity
within the population.
and relatively high nucleotide diversity. No geographic clustering was observed in statistical parsimony networks, even when integrating samples from the western part of the range. Despite potential barriers to dispersal for this species, such as isolation on an island (e.g., Sakhalin Oblast (SO)) or peninsula (e.g., Kamchatka (KA)), most populations ofN. caryocatactesdo not appear to be geographically differentiated from each other, likely due to gene flow during irruptive dispersal in search of mast pine seed crops. Overall, our work supports that done byHaring, Gamauf & Kryukov (2007)where no significant split was seen between the east and west for nutcrackers and is similar to the pattern found in
N. caryocatactessister species,N. columbiana(Dohms & Burg, 2013).
Compared toHaring, Gamauf & Kryukov (2007), our study found a higher level of haplotype diversity (Hd =0.967 vs 0.844 andπ=0.00537 vs 0.00279). This may be due to the portion of control region sequenced and the larger sample sizes used in this study. The sequences obtained from our samples are predominantly composed of domains I and II of the mtDNA control region (Saunders & Edwards, 2000), whereasHaring, Gamauf & Kryukov (2007)sequenced primarily domain II, which is considered less variable (Ruokonen & Kvist, 2002).
dispersal potential of nutcrackers, it is possible that a large population expanded out of a single refugium, but it is equally plausible that expansion occurred out of multiple refugia with subsequent gene flow between geographically distinct populations due to irruptive dispersal events. The multiple refugia scenario could have produced the large number of haplotypes, often with high levels of sequence divergence pattern seen here. For example, individuals from Primorsky Kray (PK) are found scattered throughout the parsimony network (Fig. 2), in some cases with a large number of mutations between PK individuals and other haplotypes, yet found clustered with geographically distant individuals from Irkutsk Oblast (KD) and KA. This level of divergence is often associated with isolation in and subsequent colonization from multiple refugia (Hewitt, 2004). With the high haplotype diversity across all populations, it is not possible to determine which population(s), if any sampled here, may be in the location of the original refugium or refugia. Without additional present day samples from the Alps and Himalaya Mountain ranges, it is difficult to tell using genetic signatures if these areas served as refugia for nutcrackers during the LGM.
Our findings do not support a single refugium in the Altai Mountains of southern Mon-golia, as postulated byHaring, Gamauf & Kryukov (2007). Rather, our data show highly divergent haplotypes which could be the result of prolonged isolation in multiple refugia. Scots pine (Pinus sylvestris), an important source of food for nutcrackers, is thought to have survived in refugia near the Alps (Naydenov et al., 2007) and in the east, unglaciated portions of the Himalayas could have served as a refugium for high latitude species (Zhuo, Baoyin & Petit-Maire, 1998;Owen, Finkel & Caffee, 2002). Alternatively, high levels of plant endemism have been found in the mountains of southern and eastern China, suggestive of long-term suitable habitats (Zhuo, Baoyin & Petit-Maire, 1998). Nutcrackers may have survived in these bands of suitable habitat in the southwest and southeast areas of Eurasia and expanded northward from multiple refugia as glaciers retreated.
CONCLUSIONS
Overall, Eurasian nutcrackers exhibit limited geographic genetic structure throughout their range, as might be expected from a resident bird with irruptive dispersal patterns. Our study found high genetic diversity, which suggests that a population bottleneck has not occurred in this species as previously hypothesized. A more detailed phylogeographical study could include additional genetic sampling from northern and southern parts ofN. caryocatactes’range to further investigate structure across the range of this species.
ACKNOWLEDGEMENTS
ADDITIONAL INFORMATION AND DECLARATIONS
Funding
Funding for this project was provided by a Natural Science and Engineering Research Council (NSERC) Discovery Grant (TMB) and Post-Graduate Scholarship D (KMD) and Alberta Innovates (AI) New Faculty Award (TMB) and Graduate Scholarship (KMD). The funders had no role in study design, data collection and analysis, decision to publish, or preparation of the manuscript.
Grant Disclosures
The following grant information was disclosed by the authors:
Natural Science and Engineering Research Council (NSERC): Discovery Grant (TMB) and Post-Graduate Scholarship D (KMD).
Alberta Innovates (AI): New Faculty Award (TMB) and Graduate Scholarship (KMD).
Competing Interests
The authors declare there are no competing interests.
Author Contributions
• Kimberly M. Dohms conceived and designed the experiments, performed the
exper-iments, analyzed the data, wrote the paper, prepared figures and/or tables, reviewed drafts of the paper.
• Theresa M. Burg conceived and designed the experiments, contributed
reagents/materials/analysis tools, wrote the paper, reviewed drafts of the paper.
Animal Ethics
The following information was supplied relating to ethical approvals (i.e., approving body and any reference numbers):
We did not handle any live vertebrate animals during this study. All animals sequenced here were sequenced from tissue samples provided by the Burke Museum, thus animal care approval was not required for this specific study.
DNA Deposition
The following information was supplied regarding the deposition of DNA sequences:
GenBank: NUCA.sqn BK001KJ999615, NUCA.sqn BK002KJ999616,
NUCA.sqn BK003KJ999617, NUCA.sqn GA001KJ999618, NUCA.sqn GA002KJ999619,
NUCA.sqn GA003KJ999620, NUCA.sqn GA004KJ999621, NUCA.sqn KA001KJ999622,
NUCA.sqn KA002KJ999623, NUCA.sqn KA003KJ999624, NUCA.sqn KA004KJ999625,
NUCA.sqn KA005KJ999626, NUCA.sqn KA006KJ999627, NUCA.sqn KD001KJ999628,
NUCA.sqn KD002KJ999629, NUCA.sqn KD003KJ999630, NUCA.sqn KD004KJ999631,
NUCA.sqn KD005KJ999632, NUCA.sqn MA001KJ999633, NUCA.sqn MA002KJ999634,
NUCA.sqn MA003KJ999635, NUCA.sqn MA004KJ999636, NUCA.sqn MA005KJ999637,
NUCA.sqn MA006KJ999638, NUCA.sqn MA007KJ999639, NUCA.sqn MA008KJ999640,
NUCA.sqn PK002KJ999644, NUCA.sqn PK003KJ999645, NUCA.sqn PK004KJ999646,
NUCA.sqn PK005KJ999647, NUCA.sqn PK006KJ999648, NUCA.sqn PK007KJ999649,
NUCA.sqn PK008KJ999650, NUCA.sqn PK009KJ999651, NUCA.sqn PK010KJ999652,
NUCA.sqn PK011KJ999653, NUCA.sqn SO001KJ999654, NUCA.sqn SO002KJ999655,
NUCA.sqn SO003KJ999656, NUCA.sqn SO004KJ999657, NUCA.sqn SO005KJ999658,
NUCA.sqn TO001KJ999659, NUCA.sqn TO002KJ999660, NUCA.sqn TO003KJ999661,
NUCA.sqn TO004KJ999662, NUCA.sqn TO005KJ999663, NUCA.sqn TO006KJ999664,
NUCA.sqn TO007KJ999665, NUCA.sqn TU001KJ999666, NUCA.sqn TU002KJ999667,
NUCA.sqn TU003KJ999668, NUCA.sqn TU004KJ999669, NUCA.sqn TU005KJ999670,
NUCA.sqn UL001KJ999671, NUCA.sqn UL002KJ999672, NUCA.sqn UL003KJ999673,
NUCA.sqn UL004KJ999674, NUCA.sqn UL005KJ999675, NUCA.sqn OK001KJ999676.
Supplemental Information
Supplemental information for this article can be found online athttp://dx.doi.org/ 10.7717/peerj.371.
REFERENCES
BrunhoffC, Galbreath KE, Fedorov VB, Cook JA, Jaarola M. 2003.Holarctic phylogeography of the root vole (Microtus oeconomus): implications for late Quaternary biogeography of high latitudes.Molecular Ecology12:957–968DOI 10.1046/j.1365-294X.2003.01796.x.
Burg TM, Croxall JP. 2001.Global relationships amongst black-browed and grey-headed albatrosses: analysis of population structure using mitochondrial DNA and microsatellites.
Molecular Ecology10:2647–2660DOI 10.1046/j.0962-1083.2001.01392.x.
Clement M, Posada D, Crandall KA. 2000.TCS: a computer program to estimate gene genealogies.
Molecular Ecology9:1657–1659DOI 10.1046/j.1365-294x.2000.01020.x.
Dohms KM, Burg TM. 2013.Molecular markers reveal limited population genetic structure in a North American corvid, Clark’s Nutcracker (Nucifraga columbiana).PLoS ONE8:e79621
DOI 10.1371/journal.pone.0079621.
Ferrando A, Ponsa M, Marmi J, Domingo-Roura X. 2004.Eurasian otters,Lutra lutra,have a dominant mtDNA haplotype from the Iberian Peninsula to Scandinavia.Journal of Heredity 95:430–435DOI 10.1093/jhered/esh066.
Flanders J, Jones G, Benda P, Dietz C, Zhang S, Li G, Sharifi M, Rossiter SJ. 2009. Phylogeography of the greater horseshoe bat,Rhinolophus ferrumequinum: contrasting results from mitochondrial and microsatellite data. Molecular Ecology 18:306–318
DOI 10.1111/j.1365-294X.2008.04021.x.
Haring E, Gamauf A, Kryukov A. 2007.Phylogeographic patterns in widespread corvid birds.
Molecular Phylogenetics and Evolution45:840–862DOI 10.1016/j.ympev.2007.06.016.
Hewitt GM. 2004.Genetic consequences of climatic oscillations in the Quaternary.Philosophical Transactions of the Royal Society B: Biological Sciences359:183–195DOI 10.1098/rstb.2003.1388. Kryukov A, Iwasa MA, Kakizawa R, Suzuki H, Pinsker W, Haring E. 2004.Synchronic
east–west divergence in azure-winged magpies (Cyanopica cyanus) and magpies (Pica pica). Journal of Zoological Systematics and Evolutionary Research 42:342–351
Naydenov K, Senneville S, Beaulieu J, Tremblay F, Bousquet J. 2007.Glacial vicariance in Eurasia: mitochondrial DNA evidence from Scots pine for a complex heritage involving genetically distinct refugia at mid-northern latitudes and in Asia Minor.BMC Evolutionary Biology 7:233DOI 10.1186/1471-2148-7-233.
Owen LA, Finkel RC, Caffee MW. 2002.A note on the extent of glaciation throughout the Himalaya during the global Last Glacial Maximum.Quaternary Science Reviews21:147–157
DOI 10.1016/S0277-3791(01)00104-4.
Pitra C, Lieckfeldt D, Alonso JC. 2000.Population subdivision in Europe’s great bustard inferred from mitochondrial and nuclear DNA sequence variation.Molecular Ecology9:1165–1170
DOI 10.1046/j.1365-294x.2000.00983.x.
Rozas J, S´anchez-DelBarrio JC, Messeguer X, Rozas R. 2003.DnaSP, DNA polymorphism analyses by the coalescent and other methods. Bioinformatics 19:2496–2497
DOI 10.1093/bioinformatics/btg359.
Ruokonen M, Kvist L. 2002.Structure and evolution of the avian mitochondrial control region.
Molecular Phylogenetics and Evolution23:422–432DOI 10.1016/S1055-7903(02)00021-0. Saunders MA, Edwards SV. 2000.Dynamics and phylogenetic implications of mtDNA control
region sequences in New World jays (Aves: Corvidae).Journal of Molecular Evolution51:97–109. Tamura K, Dudley J, Nei M, Kumar S. 2007. MEGA4: molecular evolutionary genetics
analysis (MEGA) software version 4.0.Molecular Biology and Evolution 24:1596–1599
DOI 10.1093/molbev/msm092.
Tomback DF. 1998.Clark’s nutcracker (Nucifraga columbiana).The Birds of North America 24:DOI 10.2173/bna.331.
Walsh PS, Metzger DA, Higuchi R. 1991.Chelex 100 as a medium for simple extraction of DNA for PCR-based typing from forensic material.Biotechniques10:506–513.
Zhang R, Song G, Qu Y, Alstrom P, Ramos R, Xing X, Ericson PG, Fjeldsa J, Wang H, Yang X, Kristin A, Shestopalov AM, Choe JC, Lei F. 2012.Comparative phylogeography of two widespread magpies: importance of habitat preference and breeding behavior on genetic structure in China.Molecular Phylogenetics and Evolution65:562–572
DOI 10.1016/j.ympev.2012.07.011.
Zhuo Z, Baoyin Y, Petit-Maire N. 1998.Paleoenvironments in China during the Last Glacial
Maximum and the Holocene optimum.Episodes21:152–158.
Zink RM, Drovetski SV, Rohwer S. 2002.Phylogeographic patterns in the great spotted woodpeckerDendrocopos majoracross Eurasia. Journal of Avian Biology 33:175–178
DOI 10.1034/j.1600-048X.2002.330208.x.