Modeling Inter-trial Variability of Saccade
Trajectories: Effects of Lesions of the
Oculomotor Part of the Fastigial Nucleus
Thomas Eggert1*, Farrel R. Robinson2, Andreas Straube1
1Department of Neurology, Ludwig-Maximilians University, Munich, Germany,2Department of Biological Structure, University of Washington, Seattle, Washington, United States of America
Abstract
This study investigates the inter-trial variability of saccade trajectories observed in five rhe-sus macaques (Macaca mulatta). For each time point during a saccade, the inter-trial vari-ance of eye position and its covarivari-ance with eye end position were evaluated. Data were modeled by a superposition of three noise components due to 1) planning noise, 2) signal-dependent motor noise, and 3) signal-signal-dependent premotor noise entering within an internal feedback loop. Both planning noise and signal-dependent motor noise (together called accumulating noise) predict a simple S-shaped variance increase during saccades, which was not sufficient to explain the data. Adding noise within an internal feedback loop enabled the model to mimic variance/covariance structure in each monkey, and to estimate the noise amplitudes and the feedback gain. Feedback noise had little effect on end point noise, which was dominated by accumulating noise. This analysis was further extended to saccades executed during inactivation of the caudal fastigial nucleus (cFN) on one side of the cerebellum. Saccades ipsiversive to an inactivated cFN showed more end point vari-ance than did normal saccades. During cFN inactivation, eye position during saccades was statistically more strongly coupled to eye position at saccade end. The proposed model could fit the variance/covariance structure of ipsiversive and contraversive saccades. Inacti-vation effects on saccade noise are explained by a decrease of the feedback gain and an increase of planning and/or signal-dependent motor noise. The decrease of the fitted feed-back gain is consistent with previous studies suggesting a role for the cerebellum in an inter-nal feedback mechanism. Increased end point variance did not result from impaired
feedback but from the increase of accumulating noise. The effects of cFN inactivation on saccade noise indicate that the effects of cFN inactivation cannot be explained entirely with the cFN’s direct connections to the saccade-related premotor centers in the brainstem.
Author Summary
In movement control, online feedback compensation of internal noise directly affects the statistics of the movement trajectory, namely the development of the variance during the
a11111
OPEN ACCESS
Citation:Eggert T, Robinson FR, Straube A (2016) Modeling Inter-trial Variability of Saccade Trajectories: Effects of Lesions of the Oculomotor Part of the Fastigial Nucleus. PLoS Comput Biol 12 (6): e1004866. doi:10.1371/journal.pcbi.1004866
Editor:Adrian M Haith, Johns Hopkins University, UNITED STATES
Received:November 26, 2015
Accepted:March 14, 2016
Published:June 28, 2016
Copyright:© 2016 Eggert et al. This is an open access article distributed under the terms of the
Creative Commons Attribution License, which permits unrestricted use, distribution, and reproduction in any medium, provided the original author and source are credited.
Data Availability Statement:Data can be accessed ashttp://dx.doi.org/10.12751/g-node.o1g64d.
Funding:The study was funded by NIH grants EY018585 and 2T32EY007031-36. The funders had no role in study design, data collection and analysis, decision to publish, or preparation of the manuscript.
movement and the correlation of the effectors position during the movement and its end position. We used here the statistics of the movement trajectory to gain inference about features of the underlying noise sources and of the actual feedback mechanism. We devel-oped a method to analytically determine the statistics of movement trajectories resulting from noise entered inside and outside of an internal feedback loop and obtained a general model of noise in the output of feedback controlled motor systems. In detail we consider here the special case of saccade control and show that the number of free model parame-ters is small enough to identify the contribution of the noise components inside and out-side of the loop, and the strength of the feedback. The model was fitted to the inter-trial saccade variability observed in five rhesus monkeys (Macaca mulatta). By comparing our parameter estimates for saccades under control conditions to saccades executed during inactivation of the fastigial nucleus (the main cerebellar output to the brainstem saccade generator) we quantify the role of the cerebellum in feedback motor control.
Introduction
Biologically controlled movement may be seen as output of a dynamic system driven by non-deterministic inputs. Repeated natural movements exhibit a considerable amount of inter-trial variability even if external noise related to the stimulus, the task, and perturbing forces is mini-mized. This trial to trial variability indicates that movement control is subject to internally gen-erated noise. It is important to investigate the origin of this noise and the dynamics of the system it is passed through. The primary data source for empirical research on this topic is the time course of the output variance and the covariance of the output between different time points during the movement. Such data contain relevant information since the variance/covari-ance structure of the output of a dynamic system driven by a random input signal is a function of the system dynamics and of the power density of the input signal. For linear systems, effi-cient methods to compute the variance/covariance structure of the output for a given input noise do exist. However, a number of difficulties interfere with the interpretation of inter-trial variance of natural movements. First, the input noise which is generated within the system is normally not directly observable. Second, the dynamic relationship between a noise source and the observed output is not known in detail. Third, the observed variance may result from multi-ple noise sources such as sensory noise, cellular noise, and peripheral motor noise [1]. The decomposition of the observed variance into its different components may not be possible without ambiguity.
In pure horizontal saccadic eye movements these problems are less pronounced. A model of peripheral motor noise for saccades already exists [2,3] which approximates motor noise entering at the level of the oculomotor neurons (ONs) by additive white Gaussian noise with a standard deviation that scales linearly with firing rate. This model very successfully explains the saccade main sequence, i.e., the relation between saccade amplitude, peak velocity, and duration [4–6], as a consequence of minimizing variance of eye position during a post-move-ment period in the presence of signal-dependent motor noise. The internal movepost-move-ment com-mands in the noise model of Harris and Wolpert [2] are based on well-established dynamic properties of the oculomotor plant describing the dependence of eye position during saccades on the activity of the ON [7,8]. The model of Harris and Wolpert [2] predicts both the time course of eye position variance and also the covariance of eye position during any two time points during the saccade. It provides a statistical model of inter-trial variability of the saccade
trajectory induced by signal-dependent noise in the ONs and solves major parts of the above-mentioned difficulties associated with the modeling of motor noise.
It is important to underline that the model of Harris and Wolpert [2] was not designed to provide a statistical model of experimentally observed noise of the saccade trajectory. Its pur-pose was to identify the best motor plan (represented by the time course of ON activity) for minimizing end point variance. Therefore, this model explicitly excludes all noise sources that may enter the saccadic system upstream from the ONs.
The current study models inter-trial variance of saccade trajectories and can therefore not avoid the problem that the observed variance may result from multiple noise sources. Ideally, a model would allow us to decompose the noise into its different components. To that end we will start with the model of Harris and Wolpert [2] and will extend it with two different noise components that enter upstream from the ON. These extensions are motivated as follows.
First, it is known that burst-like activity related to horizontal saccades occurs not only in the ONs, but also in a number of different premotor burst neurons belonging to the so-called brainstem pulse generator [9]. Thus, it seems plausible that motor noise affects not only the activity of ONs but also the activity of other premotor burst neurons (PBNs). An essential dif-ference between the ONs and PBNs is that ON activity is propagated feedforward through the dynamics of muscle recruitment and the mechanics of the eyeball, whereas PBN activity is also subject to internal feedback [10–15]. This difference may be very important for the variability of the saccade trajectory induced by signal-dependent motor-noise added at these different lev-els of the motor system. Therefore, the present study investigates how signal-dependent noise added within a premotor feedback loop affects the variability of saccade trajectories in compar-ison to signal-dependent noise in the ONs, downstream from the feedback loop. If these two different noise sources affect the noise structure of saccade trajectories differently, then a suc-cessful noise model could provide new insight into the relative contributions of the different noise sources and it could also provide evidence for an internal feedback loop and a quantita-tive estimate of its gain.
The second motivation for extending the model of saccadic motor noise of Harris and Wol-pert [2] is that, in addition to motor noise, variability of the neural signals driving the brain-stem saccade generator (e.g. planning noise) also affects saccades. Noise entering upstream from the motor system would cause variability of saccade trajectories; even in the absence of motor-noise (i.e. noise entering directly at the levels of saccade-related burst activity). There-fore, theoretical models of saccadic motor noise such as the model of Harris and Wolpert [2] cannot characterize the variability of experimentally observed saccades without accounting for non-motor noise affecting sensory processing, target selection, and cortical representations of the initial motor error. In the following we will summarize all noise sources that contribute to the variability of the planned saccade amplitude under the term“planning noise”.
The question of how the variability of saccades can be modeled by an explicit decomposition into different noise components was previously addressed by a study of van Beers [16]. This previous approach is extended by the current study in two ways: In the concluding remarks of his study, van Beers [16] mentioned that the exact contribution of noise entering within a pre-motor feedback loop to end point variance is not known. Our attempt to distinguish between motor noise that is propagated feedforward through the motor plant and premotor feedback noise is a first approach to fill this gap. The second new aspect is that the current study will model the dynamic evolution of the variance of eye position during the saccade, whereas the study of van Beers [16] is focused on modeling of end point variance and the correlation between saccade parameters (amplitude, duration, peak velocity).
(cFN) on one side of the cerebellum. The cFN is one of the major cerebellar structures involved in the control of visually guided saccades [17]. This comparison is of particular interest since the most prominent impairment of motor control in cerebellar lesions (not only in the control of saccades but also in the control of posture and limb movements) is the loss of precision and accuracy. According to theories of cerebellar function [18–20], these deficits are related to the role of the cerebellum in shaping feedforward motor commands and in predicting the sensory consequences of the movement. These predictions, in comparison with actual sensory affer-ents, can be used for driving online feedback and adaptive modifications of the system. For sac-cades which are not affected by visual online feedback [21–23], a number of studies [24–28] suggest that the cerebellum is involved in the above-mentioned internal feedback. However, the anatomical substrates of this internal feedback loop are not known [29]. A noise model that would allow to estimate the gain of the internal feedback in both control saccades and saccades during cFN inactivation could reveal new details about the contribution of the cerebellum to internal feedback.
Results
Inter-trial variability of saccades under control conditions
Fig 1Ashows the saccade trajectories of one monkey. These saccades, made under control con-ditions, were selected by their motor error which was restricted to 10±2.5 deg.
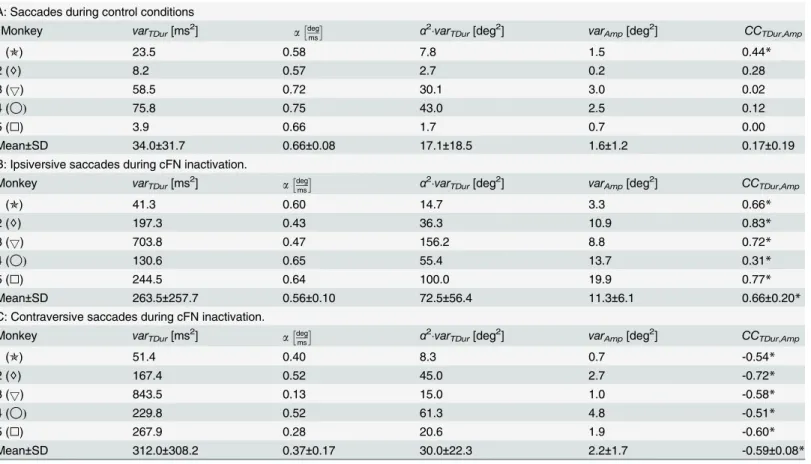
Statistics of duration and amplitude. Averaged across all monkeys, saccade amplitude was 10.1±0.2 (mean ± SD) deg and saccade duration was 40.0±2.5 ms. The inter-trial variance of the saccade duration was 34±32 ms2and the inter-trial variance of the saccade amplitude was 1.6±1.2 deg2(Table 1A, columnsvarTDur,varAmp). The correlation coefficient between
duration and amplitude was only 0.17±0.19 (Table 1A, columnCCTDur,Amp) and did not
(except in one monkey) significantly differ from zero. This shows that the inter-trial variability of amplitude and duration was not sufficiently explained by planning noise alone. If it were
Fig 1. Saccades under control conditions.Eye position traces of monkey 4 during saccades under control conditions (A), and during cFN inactivation for saccades ipsiversive (B) and contraversive (C) to the side of the inactivated cFN.
doi:10.1371/journal.pcbi.1004866.g001
(i.e. if the motor noise was negligibly small compared to planning noise), then the relationship between amplitude and duration would be determined by the main sequence. Each small devia-tion (ΔAmp) of a saccade amplitude from its mean would be roughly proportional to the
corre-sponding deviation (ΔTDur) of the saccade duration from its mean:ΔAmp =αΔTdur.
Consequently, the variance of the saccade amplitudevarAmpwould approachα2varTDurand
the coefficient of the correlation between saccade duration and amplitude would be close to one. The absence of a strong correlation between amplitude and duration in the observed data may be explained by control commands which entered the motor system independently from the planned feedforward command. Such planning-independent control commands can include motor noise destabilizing and/or online feedback stabilizing saccade amplitudes. In the absence of any feedback, motor noise would cause the variance of saccade amplitude to increase above the planning varianceα2var
TDur. But in contrast to this scenario the
experimen-tally observed variance of the saccade amplitude (Table 1A, columnvarAmp) was about 10
times smaller thanα2var
TDursuggesting that some type of internal feedback stabilized saccade
amplitude despite considerable variance of the saccade duration.
Table 1. Inter-trial statistics of saccade duration and amplitude for each monkey.
A: Saccades during control conditions
Monkey varTDur[ms2] adegms α2varTDur[deg2] varAmp[deg2] CCTDur,Amp
1 (✯) 23.5 0.58 7.8 1.5 0.44*
2 (♢) 8.2 0.57 2.7 0.2 0.28
3 (5) 58.5 0.72 30.1 3.0 0.02
4 (◯) 75.8 0.75 43.0 2.5 0.12
5 (□) 3.9 0.66 1.7 0.7 0.00
Mean±SD 34.0±31.7 0.66±0.08 17.1±18.5 1.6±1.2 0.17±0.19
B: Ipsiversive saccades during cFN inactivation.
Monkey varTDur[ms2] adegms α2varTDur[deg2] varAmp[deg2] CCTDur,Amp
1 (✯) 41.3 0.60 14.7 3.3 0.66*
2 (♢) 197.3 0.43 36.3 10.9 0.83*
3 (5) 703.8 0.47 156.2 8.8 0.72*
4 (◯) 130.6 0.65 55.4 13.7 0.31*
5 (□) 244.5 0.64 100.0 19.9 0.77*
Mean±SD 263.5±257.7 0.56±0.10 72.5±56.4 11.3±6.1 0.66±0.20*
C: Contraversive saccades during cFN inactivation.
Monkey varTDur[ms2] adegms α2varTDur[deg2] varAmp[deg2] CCTDur,Amp
1 (✯) 51.4 0.40 8.3 0.7 -0.54*
2 (♢) 167.4 0.52 45.0 2.7 -0.72*
3 (5) 843.5 0.13 15.0 1.0 -0.58*
4 (◯) 229.8 0.52 61.3 4.8 -0.51*
5 (□) 267.9 0.28 20.6 1.9 -0.60*
Mean±SD 312.0±308.2 0.37±0.17 30.0±22.3 2.2±1.7 -0.59±0.08*
varTDur: variance of total saccade duration.α: slope of the dependency of total saccade amplitude on saccade duration according to the main sequence
estimated for each monkey and saccade condition.α2varTDur: expected variance of the saccade amplitude if all saccades were to exactly obey the main
sequence.varAmp: variance of the saccade amplitude.CCTDur,Amp: Pearson’s correlation coefficient between the total duration and the amplitude of the saccade. Significant correlations are marked by an asterisk. Inter-trial variances and correlation coefficients were computed across all available saccades with motor errors between 8.5 and 12.5 deg. In all cases,varAmpwas smaller thanα2varTDur, and |CCTDur,Amp| was smaller than 1.
Using only the variances of amplitude and duration it is not possible to estimate the relative contributions of planning noise, motor noise, and internal feedback in more detail. To estimate these contributions we analyzed the variance and covariance trajectories and compared them to the predictions of our noise model.
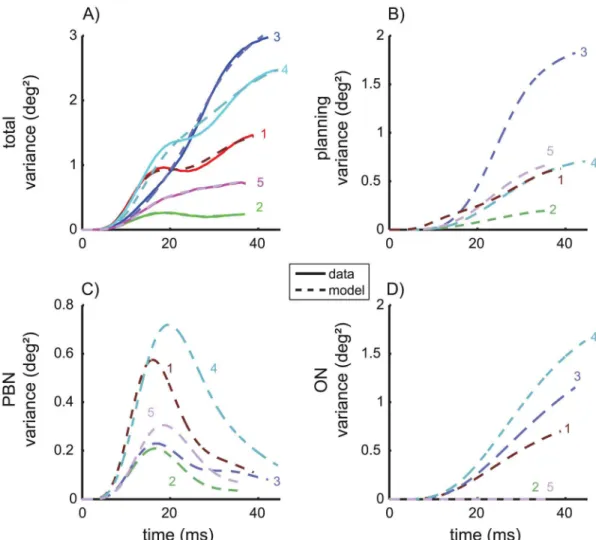
Variance- and covariance trajectories. The variance trajectories (Fig 2A, solid) show how the variance changed during the saccade. Only monkeys 3 and 5 showed a simple S-shaped increase of the variance. The trajectories of the other 3 animals showed a double S-shape. In monkeys 1 and 2 this double S-shape was strong enough to induce a local maximum in the var-iance occurring about 18–19 ms after saccade onset. For each monkey, we determined the four model parameters [kA,kON,kPBN,g] that optimally fitted the measured variance/covariance
tra-jectories. The three parameterskA,kON, andkPBNreflect the strength of the signal dependent
planning noise, ON noise, and PBN noise respectively. The parametergdenotes the gain of the internal feedback (seeMethods, Modeling noise of the saccade trajectory). This full noise model was able to explain these inter-individual differences because the time courses of the three noise components of this model differ in shape: Both planning noise (Fig 2B) and
ON-Fig 2. Variance trajectories under control conditions.A) Solid: measured variance of eye position during saccades with 10 deg motor error. time = 0: saccade onset. Dashed: sum of the three different components of the variance model shown in B/C/D. Variance of the eye position due to planning noise (B,Eq 10), signal-dependent noise in the premotor burst neurons (C,Eq 19), and signal-dependent noise in the oculomotor neurons (D,Eq 15).
doi:10.1371/journal.pcbi.1004866.g002
motor noise (Fig 2D) showed a simple S-shape and a monotonic increase, whereas signal-dependent noise in the PBN (Fig 2C) is characterized by a bell-shaped increase-decrease pat-tern. The fitted superposition (Fig 2A, dashed) of the three different noise components matched the measured variance/covariance trajectories with a mean squared error (MSE) of 0.0018 deg4.
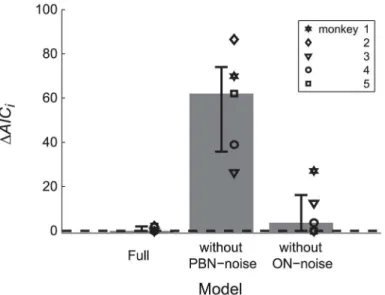
To test whether the different noise components of the model could be identified we fitted also two reduced models to the data in which either the ON noise or the PBN noise was con-strained to zero. The MSE of the full model and those of the two reduced models differed sig-nificantly from each other (ANOVA: F(2,8) = 21.269; p<0.002). The post-hoc test showed that the MSE of the model without PBN noise (MSE = 0.0208 deg4), was larger (Scheffé: p<0.005) than both the MSE of the full model and of the model without ON noise (MSE = 0.0031 deg4). The MSE did not differ significantly between the full model and that without ON noise (Scheffé: p = 0.6). Thus, including the PBN noise improved the model, whereas omitting the ON noise did not significantly impair its ability to explain the experimentally observed noise. The same was suggested by the Akaike information criterion which showed larger values of
ΔAICifor the model without PBN noise than for the other two models (Fig 3).
The underlying cause of these results is that the shape of the variance/covariance trajectories of the planning noise and of the ON noise were similar (seeFig 2B/2D), which prevents a clear distinction between the contribution of planning noise and ON noise on the basis of the observed variance and covariance trajectories. As a consequence of this overfitting the apparent absence of ON noise in two monkeys (#2 and #5,Fig 2D) cannot be interpreted because increasing the strength of ON noise (increasingkON) on the costs of planning noise (decreasing
kA) has only minimal impact on the residual error. Since parameter estimates obtained from
fitting of underdetermined models cannot be interpreted, the simplified model without signal-dependent noise in the ON (kON= 0) was used for all following estimates of the remaining
parameters [kA,kPBN,g]. This does not mean that ON noise is assumed to be absent or
irrele-vant, but being unable to distinguish ON noise from planning noise, we confined ourselves to
Fig 3. Model comparison.Model comparison between the full model and two simplified models in which the motor noise of the PBN or the ON is constrained to zero. All three models were fitted to the variance and covariance trajectories of the control saccades for each monkey (symbols). Small values ofΔAICiindicate little loss of explanatory value of the model with respect to the best model. Bars and whiskers indicate median and quartiles.
fit the saccade variability with a superposition of planning noise and PBN noise while bearing in mind that the fitted planning noise may actually represent a mixture between real planning noise and ON noise. To avoid confusion, we will therefore rename the fitted planning-noise component in the simplified modelaccumulating noisesince the monotonic accumulation is the common characteristic difference of planning noise and ON noise in comparison to the bell-shaped curves of the PBN noise. The fits of the variance and covariance trajectories of con-trol saccades achieved by the simplified model are shown inFig 4A/4D.
The mean of the noise coefficients of the accumulating noise for the simplified model (Table 2A) waskA= 0.11±0.05. Inserting the values ofkA(Table 2A) and the observed saccades
amplitudes inEq 12for each monkey revealed that the variance of the saccade amplitude that the model attributes to accumulating noise (1.5±1.1 deg2) amounted to 94% of the total vari-ance of the observed amplitude 1.6 deg2(Table 1,varAmp). In the simplified model, the
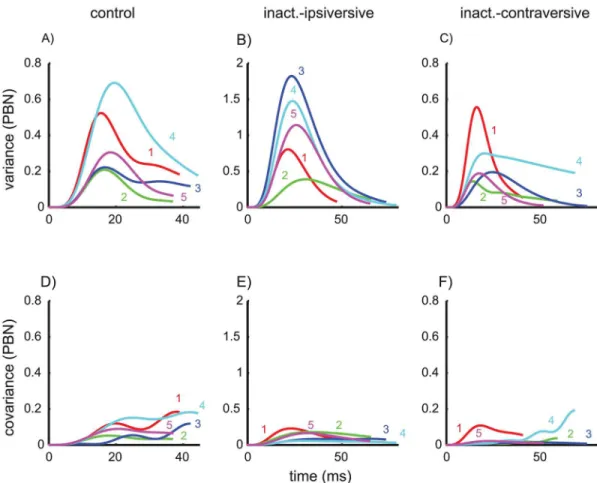
variabil-ity of eye position due to PBN noise (Fig 5A) showed peak variances of 0.4±0.2 deg2and end point variances of only 0.11±0.07 deg2. This indicates that the noise component attributed to PBN noise (even though this component contributed significantly to the overall explanatory value of the model) was small compared to the component attributed to accumulating noise.
Fig 4. Variance- and covariance trajectories.Data (solid) and model fits (dashed) of the simplified model without ON noise (fitted parameters: [kA,kPBN,g]; fixed:kON= 0). The top row shows the variance trajectories for the three saccade conditions: control saccades (A), and saccades ipsiversive (B) and contraversive (C) to the side of an inactivated cFN. The bottom row (D/E/F) shows the corresponding covariance trajectories (i.e. the covariance between the eye position at the time shown on the abscissa and the eye position at the end of the saccade). Note the different scaling of the axes for each saccade condition.
doi:10.1371/journal.pcbi.1004866.g004
The coefficients of determination were very close to one (Table 2A, R2), underlining the good-ness of the fits.
Effects of cFN inactivation on saccade gain and main sequence
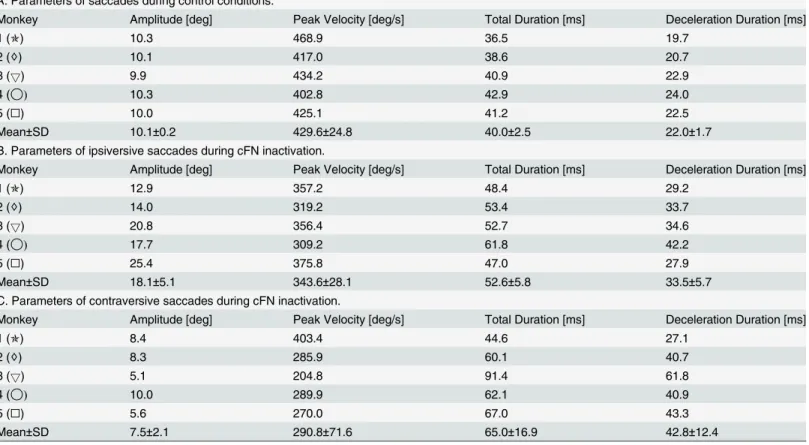
As reported previously [17,30,31], saccades ipsiversive to the side of an inactivated cFN were hypermetric and those contraversive to it were hypometric (Table 3,‘Amplitude’). Also the increase in the total duration of the saccade and in the duration of the deceleration phase (i.e. the time between the peak velocity and the saccade end) is fully compatible with these previous reports. However, pooling saccade duration and peak velocity across saccades to targets with the same eccentricity has the disadvantage that effects of cFN inactivation on these parameters reflect the effects on both the saccade gain and the main sequence. Therefore, to assess the effect on the main sequence independently of the effects on the saccade gain, we evaluated peak veloc-ity, total duration, and deceleration duration for saccades with amplitudes of 10 deg (Table 3, columns 3–5). The motor errors necessary to evoke saccades with 10 deg amplitude differed across the saccade conditions (control: 9.9±0.2, ipsiversive: 5.9±1.6, contraversive: 14.3±4.2
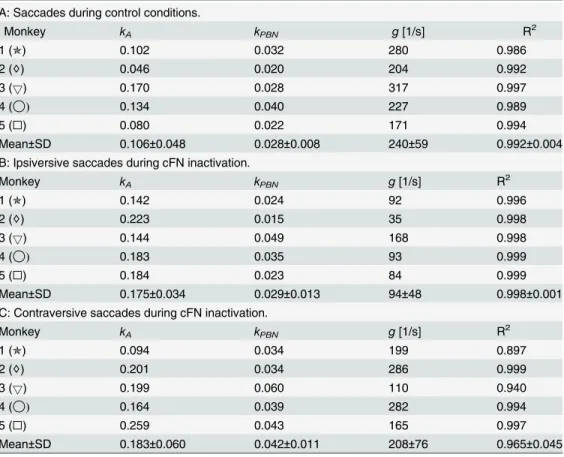
Table 2. A. Parameters of the simplified noise model without ON noise (Fig 10;kON= 0).
A: Saccades during control conditions.
Monkey kA kPBN g[1/s] R2
1 (✯) 0.102 0.032 280 0.986
2 (♢) 0.046 0.020 204 0.992
3 (5) 0.170 0.028 317 0.997
4 (◯) 0.134 0.040 227 0.989
5 (□) 0.080 0.022 171 0.994
Mean±SD 0.106±0.048 0.028±0.008 240±59 0.992±0.004
B: Ipsiversive saccades during cFN inactivation.
Monkey kA kPBN g[1/s] R2
1 (✯) 0.142 0.024 92 0.996
2 (♢) 0.223 0.015 35 0.998
3 (5) 0.144 0.049 168 0.998
4 (◯) 0.183 0.035 93 0.999
5 (□) 0.184 0.023 84 0.999
Mean±SD 0.175±0.034 0.029±0.013 94±48 0.998±0.001
C: Contraversive saccades during cFN inactivation.
Monkey kA kPBN g[1/s] R2
1 (✯) 0.094 0.034 199 0.897
2 (♢) 0.201 0.034 286 0.999
3 (5) 0.199 0.060 110 0.940
4 (◯) 0.164 0.039 282 0.994
5 (□) 0.259 0.043 165 0.997
Mean±SD 0.183±0.060 0.042±0.011 208±76 0.965±0.045
kA: coefficient of variation of the planning noiseEq (12).kPBN: noise coefficient of signal-dependent noise in the pre motor burst neuron. g: gain of the internal feedback loop. R2: coef
ficient of determination. The feedback gain was significantly smaller for ipsiversive saccades during cFN inactivation (Table 2B) than under control conditions (Table 2A).
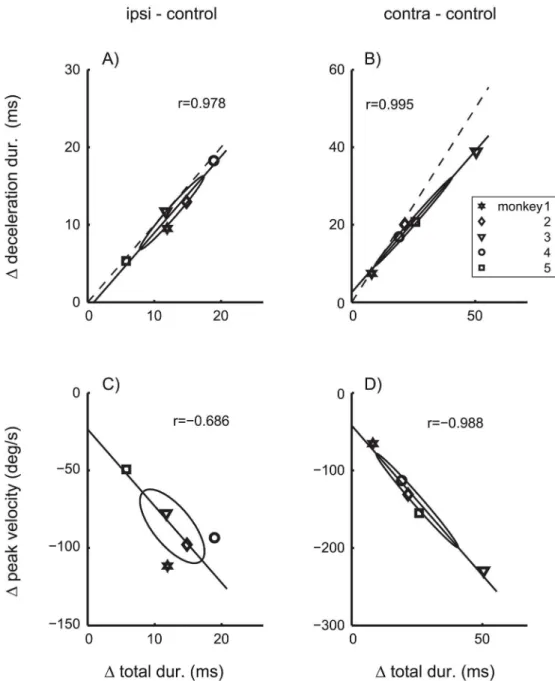
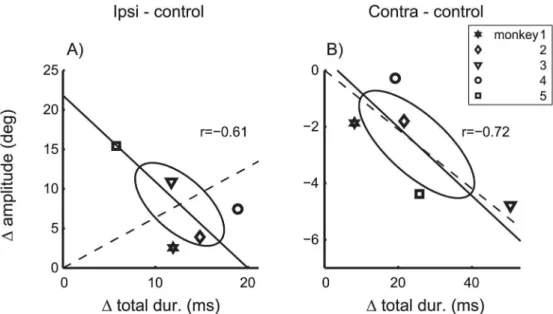
deg), due to the saccade dysmetria induced by the inactivation of the cFN. The differences of peak velocity, total duration, and deceleration duration betweenTable 3B/3C and 3Areflect changes of the main sequence and the saccade velocity profile independent of changes of the saccade gain (seeMethods, Data analysis, Mean saccade trajectory).Fig 6shows the distribution of the components of effects on the velocity profile (ΔVP) across monkeys. The coefficients of
correlation between these effects were all larger than 0.68, differed significantly (p<0.01) from zero forFig 6A/6B/6D, and the major axes of all covariance ellipses pointed towards the origin. This is a critical feature for the distribution of random variables that are proportional to each other. The proportionality indices ofΔVPwereIprop= 0.68 for ipsilateral, andIprop= 0.96 for
contralateral inactivation effects. These results show that the three components ofΔVP were
roughly proportional to each other, and that for each of the five monkeys the distortions of the velocity profile induced by cFN inactivation were dominated by a single parametric factor quan-tifying the strength of this distortion in each monkey.
If the inactivation effects on saccade amplitude were dominated by the same (monkey spe-cific) factor, the inactivation effects on saccade amplitude (Δamplitude) should also be roughly
proportional to the effects on saccade duration (Δtotal dur.). Depending on the sign of the
effect on amplitude this would predict either positive (ipsilateral) or negative (contralateral)
Fig 5. Noise component entering within the internal feedback loop.The component of the variance (A/B/C) and covariance (D/E/F) trajectories predicted by PBN noise (rPBNinFig 10) entering within the internal feedback loop. The two parameters [kPBN,g] determining this noise component were fitted together with the noise coefficientkAin the simplified model without ON noise (kONfixed to zero). Fits were computed separately for each monkey and for each saccade condition. The sum of these curves and the corresponding fitted planning noise result in the dashed curves inFig 4. Note the different scaling of the axes for each saccade condition.
doi:10.1371/journal.pcbi.1004866.g005
coefficients of correlations betweenΔtotal dur. andΔamplitude.Fig 7shows that this
expecta-tion was not confirmed. The coefficients of correlaexpecta-tion did not differ significantly from zero (p>0.1) for either ipsilateral (Fig 7A) or contralateral (Fig 7B) inactivation effects. For contra-versive saccades, the proportionality index of the total effect vector (Iprop= 0.83) was only
slightly smaller than that ofΔVPonly (Iprop= 0.96). In contrast, for ipsiversive saccades, the
proportionality index of the total effect vector (Iprop= 0.22) decreased to about a third of that of ΔVPonly (Iprop= 0.68). Thus, the inactivation effects on the saccade amplitude were roughly
proportional to the effects on the velocity profile for contraversive saccades, but not for ipsiver-sive saccades. For example,Fig 7Ashows that monkey 5 (Symbol□) showed the strongest effect on saccade amplitude but at the same time the smallest effect on the velocity profile of 10 deg saccades. These results suggest that, for ipsiversive saccades, cFN inactivation effects on the saccade gain dissociate from those on saccade dynamics, and that both of these inactivation effects vary independently across monkeys.
Effects of cFN inactivation on inter-trial saccade variability
Saccade amplitude. In the example saccades inFig 1, the end-point variability of ipsiver-sive saccades during cFN inactivation (Fig 1B) was significantly larger than that of the control condition (Fig 1A). The variability of contraversive saccades (Fig 1C) was less affected by the cFN inactivation than the variability of ipsiversive saccades. The corresponding group statistics
Table 3. Parameters.
A: Parameters of saccades during control conditions.
Monkey Amplitude [deg] Peak Velocity [deg/s] Total Duration [ms] Deceleration Duration [ms]
1 (✯) 10.3 468.9 36.5 19.7
2 (♢) 10.1 417.0 38.6 20.7
3 (5) 9.9 434.2 40.9 22.9
4 (◯) 10.3 402.8 42.9 24.0
5 (□) 10.0 425.1 41.2 22.5
Mean±SD 10.1±0.2 429.6±24.8 40.0±2.5 22.0±1.7
B. Parameters of ipsiversive saccades during cFN inactivation.
Monkey Amplitude [deg] Peak Velocity [deg/s] Total Duration [ms] Deceleration Duration [ms]
1 (✯) 12.9 357.2 48.4 29.2
2 (♢) 14.0 319.2 53.4 33.7
3 (5) 20.8 356.4 52.7 34.6
4 (◯) 17.7 309.2 61.8 42.2
5 (□) 25.4 375.8 47.0 27.9
Mean±SD 18.1±5.1 343.6±28.1 52.6±5.8 33.5±5.7
C. Parameters of contraversive saccades during cFN inactivation.
Monkey Amplitude [deg] Peak Velocity [deg/s] Total Duration [ms] Deceleration Duration [ms]
1 (✯) 8.4 403.4 44.6 27.1
2 (♢) 8.3 285.9 60.1 40.7
3 (5) 5.1 204.8 91.4 61.8
4 (◯) 10.0 289.9 62.1 40.9
5 (□) 5.6 270.0 67.0 43.3
Mean±SD 7.5±2.1 290.8±71.6 65.0±16.9 42.8±12.4
Amplitudes are given for saccades with a motor error of 10 deg. All other parameters (peak velocity, saccade duration, and the duration of the deceleration phase) are specific for saccade amplitudes of 10 deg.
on the inter-trial variance of the saccade amplitude (Table 1A/1B/1CcolumnvarAmp) showed
that this variance differed significantly between conditions (three levels: control, ipsiversive-inact., contraversive-inact.; repeated measures ANOVA on log(varAmp): F(2,8) = 9.35; p<0.01).
More specifically, the variance of the amplitude of ipsiversive saccades during cFN inactivation (mean: 11.3 deg2) was larger (Scheffé post hoc: p<0.02) than that of control saccades (1.6 deg2)
Fig 6. Effects of cFN inactivation on saccade dynamics.Differences of parameters of saccades with 10 deg amplitude between cFN inactivation and control condition. Inactivation effects on the duration of the deceleration phase (Δdeceleration dur.) and on the peak velocity (Δpeak velocity) are plotted versus the effect on the total saccade duration (Δtotal dur.) of saccades ipsiversive (A/C) and contraversive (B/D) to the lesion side. Symbols indicate data of individual monkeys (using the same symbols as in the Tables). The covariance ellipses show large coefficients of correlation (Pearson’s r) and have their largest main axes passing close to the origins of the plots. Dashed: Lines through the origin with unity slope. cFN-inactivation effects on the different aspects of saccade dynamics were roughly proportional to each other.
doi:10.1371/journal.pcbi.1004866.g006
or contraversive saccades during cFN inactivation (2.2 deg2). The inactivation effect onvarAmp
of the contraversive saccades was not significant (Scheffé: p = 0.71). During cFN inactivation, the correlation between saccade duration and amplitude (Table 1B/1C, columnCCTDur,Amp)
differed significantly from zero and was larger than under control conditions. This indicates that, during cFN inactivation, saccade amplitude was less stabilized against variations in sac-cade duration. This decreased compensation for sacsac-cade duration is consistent with reduced gain in the internal feedback (see next section).
Variance- and covariance trajectories. Comparing the variance and covariance trajecto-ries of control saccades (Fig 4A/4D) and saccades during cFN inactivation (Fig 4B/4E and 4C/ 4F) shows that these time courses differed in their shape and not just by a scaling in time and/or amplitude. This difference indicates that the effects of cFN inactivation on the entire variance structure can provide additional information about the cFN's role in the underlying control mechanisms. Even though the effects of inactivation seem to be quite variable from monkey to monkey, the good fit of the model (dashed) to the data (solid) and the model inFig 4shows that appropriate adjustments of the three parameters [kA,kPBN,g] (Table 2) of the simplified noise
model can well approximate the variance structure for all monkeys in all saccade conditions. The paired differences of the fitted model parameters between saccades during cFN inacti-vation and control saccades (Fig 8) reveals that the feedback gain (g) of ipsiversive saccades during cFN inactivation was 145±39 s-1smaller (T(4) = -8.43; p<0.002) than that of control saccades (Fig 8C, left bar). However, cFN inactivation did not completely prevent internal feed-back in ipsiversive saccades since the feedfeed-back gain (94±48 s-1;Table 2B, columng) fitted to this saccade condition was still significantly larger than zero (T(4) = 4.43; p<0.02). None of the other effects of ipsilateral cFN inactivation on the fitted model parameter shown inFig 8A/8B
(ΔkA,ΔkPBN) differed significantly from zero or correlated significantly with the effect on the
feedback gain (ρ(Δg,ΔkA) = 0.08; p = 0.9;ρ(Δg,ΔkPBN) =−0.61; p = 0.3).
Fig 7. Effects of cFN inactivation on saccade gain and saccade dynamics.Δamplitude: Amplitude differences of saccades with 10 deg motor error.Δtotal dur.: Duration differences of saccades with 10 deg amplitudes. Differences were computed between saccades during cFN inactivation and control conditions and are shown separately for ipsiversive (A) and contraversive (B) saccades. Symbols denote individual monkeys. Dashed: connecting line between the origin and the mean across monkeys. The strong deviation between dashed and solid lines in A) indicates to a dissociation of effects on gain and dynamics.
Even though cFN inactivation effects onΔk
Adid not reach significance on the group level,
the individual sizes of the ipsilateralΔkAranged up to 0.18 (Fig 8A), corresponding to effects
on the end point variance of up to 3.2 deg2(= 0.182102deg2, seeEq 12). Therefore, given the high values of R2, the large variability of the effects onΔkAseems to reflect behavioral
differ-ences between monkeys. To analyze this hypothesis in more detail, we performed a model comparison between the simplified model (fitted parameters: [kA,kPBN,g],Table 2B) and an
even further reduced model in which only the two parameters [kPBN,g] were fitted, and the
noise coefficientkAwas fixed to the values obtained from the fit to the control condition
(Table 2A, columnkA). Both models were fitted to the observed ipsiversive variance/covariance
trajectories during cFN inactivation. For the model with fixedkA, theAICdifferences were
larger than 30 in four of five monkeys (all except monkey 3). In contrast, for the model with freekA, theAICdifferences were smaller than 2. This shows that for all but one animal the
empirical data did not support the model with fixedkA. Four monkeys showed an increase of
kAduring cFN inactivation for ipsiversive saccades. This indicates that, for ipsiversive saccades
of these four monkeys, cFN inactivation induced an increase of the planning noise.
Fig 8. Effects of cFN inactivation on fitted model parameters.Differences of the three fitted parameters [kA,kPBN,g] of the noise model without ON noise between saccades during cFN inactivation (left bars: ipsiversive, right bar: contraversive) and control saccades. Bars and whiskers indicate mean±95% confidence interval of the mean. The gains (g) of the internal feedback loop (fitted to explain the observed variance and covariance trajectories) were smaller for ipsiversive saccades during cFN inactivation than for control saccades (C, left bar).
doi:10.1371/journal.pcbi.1004866.g008
Correlation trajectories. During cFN inactivation (Fig 9B/9C), the correlation of the eye position with saccade end positionEq (2)increased towards a value of 1 faster than during con-trol saccades (Fig 9A). This was quantified by computing, for each monkey and saccade condi-tion, the timetρ= 0.9after saccade onset when the correlation trajectory reached a value of 0.9
(ryeðtr¼0:9; AÞ ¼0:9Þ. We expressed this time as a percentage of the respective saccade dura-tionD. This percentage (P
r¼0:9 ¼
tr¼0:9
D 100) was larger for control saccades (63±8%) than for
ipsiversive (36±11%) or contraversive (43±10%) saccades during cFN inactivation (ANOVA: F(2,8) = 10.82; p<0.01; Scheffé: p<0.03). The difference ofPρ= 0.9between ipsi- and
contraver-sive saccades during cFN inactivation did not reach significance (Scheffé: p = 0.55). The faster increase of the correlation trajectory during cFN inactivation shows that the saccade end posi-tion depended more strongly on the eye posiposi-tion earlier during the saccade. This means that saccades executed during cFN inactivation are less efficient in online compensating for motor errors that occur early during its time course. Underlying reasons for this effect may be reduced online feedback and increased planning noise.
Modeled noise components. To understand how the model accounts for the different var-iance structures of control saccades and saccades during cFN inactivation it is necessary to con-sider how inactivation affects the different components of noise. During the control condition PBN noise played only a minor role in end point variance. This is because the variance trajec-tory of signal-dependent noise in the PBN had an increasing-decreasing pattern (Fig 2C) while the variance trajectory of both planning and ON noise increased monotonically (Fig 2B/2D). Similarly, decomposing the simplified model fits of the variance trajectories during cFN inacti-vation (Fig 4B/4C) into the components related to PBN noise and accumulating noise showed that the feedback gain was still large enough to compensate for this PBN noise at movement
Fig 9. Statistical coupling between eye position during the saccade and eye end position.Pearson’s correlation coefficient between the eye position during the saccade and the saccade end position. Time = 0 indicates the saccade onset and time = 1 the saccade end. Thin lines: correlation time courses for each monkey. Thick solid: average across monkeys. Thick dashed: first increase of the mean correlation above 0.9. In control saccades (A) this increase occurred at 64% of the total saccade duration and later than for saccades during cFN inactivation (B: ipsiversive: 38%; C: contraversive: 45%).
end (Fig 5B/5C). The variance of the PBN-component at movement end, expressed as a per-centage of its peak, was 30±15% for control saccades (Fig 5A) and 10±11% for ipsiversive sac-cades during cFN inactivation (Fig 5B). The difference was not significant (paired t-test: p = 0.11). The peak variances of the PBN-noise components (Fig 5) were larger in ipsiversive saccades during cFN inactivation (1.1±0.6 deg2) than during the control condition (0.4±0.2 deg2), but the difference (0.7 deg2) was much smaller than the corresponding effect on end point variance (11.3–1.6 = 9.7 deg2,Table 1A/1B).
Thus, inactivation effects on PBN noise did not contribute much to inactivation effects on end point variance (pair wise differences of columnsvarAmpbetweenTable 1B and 1A) which
were almost entirely explained by the ipsilateral inactivation effects on the components related to accumulating noise: the mean squared difference between these inactivation effects was 0.086 deg4and amounted to only 0.07% of the mean squared inactivation effects of the total observed end point variance.
The increase in accumulating noise of ipsiversive saccades during cFN inactivation was due to two different factors, the relative contribution of which differed between monkeys: first, the hypermetria of ipsiversive saccades during cFN inactivation (prominent in monkeys 3, 4, and 5, seeTable 3A/3B, columnAmplitude) and, second, the increased accumulating-noise coeffi-cientkA(prominent in monkeys 2 and 5, seeTable 2A/2B, columnkA). Correspondingly,
mon-key 5, who was strongly affected by both factors, also showed the strongest increase in end point variance (Table 1A/1B, columnvarAmp).
Discussion
The current study quantified time courses of inter-trial variability of eye position during sac-cades. The variance/covariance structure of this variability was modeled by superposition of different noise sources. Signal-dependent noise entering within a premotor feedback loop (PBN noise) was demonstrated to affect the variance/covariance structure of saccades in a very specific way that provides a new approach to disentangle feedback-controlled motor noise from accumulating noise (i.e. planning and ON noise). Simulations showed that PBN noise increases the variance trajectory during the saccade but plays a minor role for end point vari-ance which is dominated by accumulating noise. Inactivating the cFN on one side of the cere-bellum strongly increased the end point variance of ipsiversive but not contraversive saccades. For ipsiversive saccades, inactivation effects were also observed in the variance/covariance tra-jectories, reflected by a systematic decrease of the feedback gain of the fitted noise model. This decrease of the feedback gain, though significant, was too small to explain the increase of the ipsilateral end point variance. The proposed model explained this increase of end point vari-ance by an increase of planning and ON noise during cFN inactivation.
Signal dependency of noise sources
All three signal-dependent noise sources used in our model were assumed to show a variance
Eq (12), or power densities (Eqs14/18) proportional to the expectation of the squared mean signal. For ON noise this signal dependency was adopted from previous studies [2,3]. The study of Jones et al. [32] suggested that this type of signal dependency is closely related to the stochastic nature of muscle unit recruitment, and that force variability during voluntary iso-metric muscle contraction is ". . .independent of presynaptic noise in the motor command." So far it is not known whether this conclusion generalizes from tonic muscle activation to the fast changing dynamic changes occurring during saccades. Our findings provide a first hint that the variance trajectory of saccades may not be explained by signal-dependent noise in the ON alone but is also subject to signal-dependent noise entering within an internal feedback loop
(PBN noise). Even though this noise component was relatively small compared to "accumulat-ing noise", it significantly improved the model fit (Fig 3).
For the PBN noise, the assumption that power density increases with increasing firing rate of the PBN, is generally supported by basic statistics of neuronal firing rates. When these statis-tics are modeled by Poisson statisstatis-tics, the variance of the firing rate increases linearly with its expectation [33]. Our assumptionEq (18)deviates from that model since we assumed a qua-dratic rather than linear scaling of the power density. However, it is very difficult to judge whether the noise within the feedback loop follows the Poisson statistics or not, especially since the physiological origin of so called PBN noise is not known (see the discussion of the cFN-inactivation effects on the feedback gain below). Thus, the assumption expressed inEq 18must be considered a somewhat arbitrary but not implausible first approach.
The assumption that planning noise is signal dependentEq (12)is based on the consider-ation that the precision of the planned saccade amplitude relies on the precision of sensory sig-nals, target selection, and the motor plan. These signals are believed to be represented in spatiotopic maps the resolution of which decrease with increasing spatial eccentricity. This has been shown for visual target representations in cortical areas [34] as well as for representations of saccadic motor plan in the superior colliculus (SC) [15]. Consequently, a constant precision of a target location in such a map translates in a spatial uncertainty which increases with increasing target eccentricity. Assuming that the planned saccade amplitude is transformed by the motor system into the amplitude of the executed saccade with a certain gain factor (which does not necessarily equal one) leads directly to an approximation of the signal dependency of planning noise characterized by a constant coefficient of variationEq (12)(seeS1 Text). For target eccentricities about 10 deg used in the current studyEq 12it is a very close approxima-tion to models of planning noise [16] that include a coefficient of variation that depends on eccentricity. Notably, our result that the variance trajectory predicted by planning noise differs qualitatively from that of PBN noise (Fig 2B/2C) does not depend on whether the coefficient of variance of planning noise is assumed to be constant or not. This can be seen fromEq 10
which shows that the shape of the variance trajectory predicted by planning noise depends only on the planned saccade trajectoryyðt; AÞand not on assumptions concerning the signal dependency of the variance (s2A) of the planned saccade amplitude. Thus, these assumptions
have no impact on our main conclusion that PBN noise contributes to the variance of eye posi-tion during the saccades.
Inter-trial variance of control saccades
The analysis of the relation between amplitude and duration for a group of saccades with selected initial motor errors (10±2.5 deg) showed that the variance of the saccade amplitude
varAmpwas smaller than the lower limitα2varTDurexpected under the assumption that all
vari-ations of amplitude and duration are explained by varivari-ations along the main sequence. This finding is a reproduction of results of Jürgens et al. [11] who also underlined that, for saccades with identical initial motor errors, saccade amplitudes are remarkably stable despite consider-able variation in saccade duration. Whether thevarAmpwe observed was smaller than expected
depends critically on the correct estimation of main sequence slopea¼DAmp
DTdur. In our monkeys, αwas 0.66±0.08 deg/ms, and smaller than the value given by Fuchs (1967,α= 1 deg/ms), but
still larger than in humans (Becker [22]:α= 0.4 deg/ms; Jürgens et al.[11]:α= 0.2 deg/ms).
variation in saccade peak velocity. Quaia et al. [13] observed in three monkeys and for the motor error of 10 deg a "percent compensation for speed" ofCS= 53±15%; N = 3. The percent
compensation for speed we obtained by repeating the very same analysis with our data (CS=
54±18%; N = 5) did not differ from their results. However, as underlined by Quaia et al. [13], the mechanisms underlying such a partial compensation are not yet completely understood.
The current study extends previous findings by showing that such partial compensation of saccade amplitude for variation in other saccade parameters can be explained by internal feed-back of PBN activity that is contaminated by signal-dependent noise. In contrast to previous studies, we did not restrict our observation to just two saccade parameters (e.g.: amplitude and peak velocity) but considered the variance/covariance structure of the entire saccade trajectory. Thus, the empirical basis of the current study constitutes a more comprehensive description of the statistic process of saccade trajectories. The variance increase during the saccade showed single or double S-shapes (Fig 2A). In two animals, the variance reached a local maximum dur-ing the saccade. These empirical variance trajectories were compared with those predicted by three potential noise sources: variance of the planned saccade amplitude (1: planning noise) and signal-dependent motor noise entering at the input of an oculomotor plant (2: ON noise) or within in a premotor feedback loop (3: PBN noise). Both planning noise and ON noise induce monotonically increasing variance trajectories whereas PBN noise entering within an internal feedback loop induces increasing-decreasing variance trajectories (Fig 2B/2C/2D). This important difference between noise entering within or downstream from a premotor feed-back loop does not depend critically on the fine tuning of the particular model we used in our simulations. It holds for a large class of plant models and feedback models. The supplementary information (S3 Text) shows that this model class can be specified without referring to any par-ticular parameterization of the plant. The model comparison revealed that superposition of PBN noise with accumulating noise (planning and ON noise) could explain the measured vari-ance and covarivari-ance trajectory (Fig 4A/4D). The three model parameters [kA,kPBN,g] of this
simplified model explained not only the inter-trial trajectory noise as represented by a popula-tion estimate but also that of each individual monkey (Table 2A, column R2).
The explanatory power of this simplified model proved equal to the full model and superior to a model that included planning noise and ON noise but not PBN noise (Fig 3). We may infer two things from this. First, the predictions of the effects of planning-noise and ON-noise did not differ enough from one another to be unambiguously separated using the variance and covariance trajectories that we observed. Second, the significant contribution of the PBN noise suggests that a part of the observed trajectory noise is due to signal-dependent noise entering within an internal feedback loop. The proposed model fit offers an empirical estimate of the gain of this feedback (g= 240±59 s-1,Table 2A) whereas the gain values used in the literature so far (Dean [35]:g= 110 s-1; Van Opstal and Goossens [15]:g= 80 s-1) were not derived from experimental data.
Even though the observed variance and covariance trajectories suggest that signal-depen-dent noise entering within an internal feedback loop contributes significantly to the variance of eye position during the saccade, this noise component accounted only for a small proportion of the observed end point variance. End point variance was dominated by accumulating noise entering before or after the internal feedback loop. It is important to note that this efficiency of noise compensation achieved by premotor feedback explains why PBN noise can be ignored for minimizing end point variance. Thus, the current study supports the crucial role of ON noise for minimizing the variance of eye position at and shortly after movement end as put for-ward by Harris and Wolpert [2,3].
In a previous study [16] van Beers presented another approach to explain observed saccade variability as superposition of different variance components, namelysensory noiseand three
types of motor noise,signal dependent noise,constant noise, andtemporal noise. Comparing these components with those of the current study, one can identify van Beers'sensory noise
andsignal dependent noisewith our planning noise and ON noise, respectively. Like our results, van Beers [16] could not estimate the relative contribution ofsensory noiseandsignal dependent motor noisefrom the movement data. Based on literature on perceptual localization [36] he estimated thatsensory noiseaccounted for about 57% of end point variance. Since our PBN noise was almost irrelevant for end point variance, the very same estimate can be applied to our data (resulting in planning variance accounting for 32% of end point variance). How-ever, as already noted by van Beers [16], it is questionable whether estimates of perceptual sen-sory noisecan substitute estimates of the variance in planned saccade amplitude. Therefore we did not further pursue this approach and used the termplanning noiserater thansensory noise.
Unlike van Beers [16] we did not considerconstant motor noise(i.e. signal independent noise in the ON). This simplification is due to the limitation of our dataset to a small range of target eccentricities (10±2.5 deg). For such a dataset, model fitting does not substantially bene-fit from adding constant motor noise. Thus, ignoring constant motor noise was an appropriate simplification for our study, but does not argue against the concept ofconstant motor noiseper se. Addingconstant noisein our model of ON noise would not have improved its ability to explain the observed double S-shaped of the variance trajectories (Fig 2A) because the variance trajectory resulting from constant motor noise increases monotonically (as it can be shown by evaluatingEq 15withQON(τ) =const.). Therefore, not accounting for a potentialconstant motor noisedoes not compromise our conclusion that ON noise entering downstream from a premotor feedback loop alone is not sufficient to explain the time course of the variance of eye position during the saccade.
The proposed method is of potential interest for investigating the role of online feedback in other data sets. For example, it has been hypothesized that online feedback is impaired in sac-cades elicited by electrical stimulation of the SC [37]. Fitting our noise model to the variance/ covariance trajectories of these saccades would provide an empirical estimate of the feedback gain under these conditions and could contribute to testing of this hypothesis.
Effects of cFN inactivation on inter-trial variability of saccades
Decreased feedback gain. Inactivating the cFN on one side decreases the estimated feed-back gain for ipsiversive saccades. This indicates that, under control conditions, cFN activity aids local feedback in the saccade system. This conclusion is compatible with previous sugges-tions [24–26,35], but in addition to these studies, the current analysis also provides a quantita-tive estimate of the size of the cFN contribution to the internal feedback. During cFN
inactivation, the feedback gain for ipsiversive saccades decreased to about 39% (= 94/240) of its value during the control condition (Table 2A/2B). The feedback remaining after inactivation is unlikely to reflect residual cFN activity for three reasons. First, the muscimol injections cer-tainly reached the target cFN since all monkeys showed clear inactivation effects on saccade trajectory and gain (Table 3). Second, the injection probably affected all saccade-related neu-rons in the cFN. According to Robinson et al. [17], a muscimol injection of 4μl did not
inacti-vate more cFN neurons than did a 1μl injection at the same location. Third, GABAergic
perturbations induced by electrical stimulation of the SC. Many primate studies on saccade feedback control focus on brainstem-cerebellar loops [24,26,35]. However, primate experi-ments with electrical stimulation of the SC [40,41], or recordings of SC activity during sac-cades that were artificially slowed by muscimol injections in the omnipause neurons [42] suggested the existence of a feedback loop including the SC. In the monkey, it is not known at present whether the cFN is involved in such a feedback loop across the SC. The method for estimating the feedback gain that we used here does not make assumptions about the actual physiological substrate of the feedback or the so-called "premotor burst neuron" (PBN) and does not allow any corresponding inference. Signal-dependent noise entering within an inte-grating loop transfer function would cause the same characteristic increasing-decreasing pat-tern of the variance trajectory (Figs2Cand5A/5B/5C), independent of whether the feedback was provided by a single or by multiple parallel loops.
Increased end point variance. The model explained the increased end point variance of saccades ipsiversive to an inactivated cFN not by the decreased feedback gain (Fig 5A/5B) but by increased accumulating noise (planning and ON noise). This increase was due to two differ-ent factors. The first factor was the signal dependence of the accumulating noiseEq (12)which explains why end point variance was increased for the hypermetric ipsiversive saccades but not for the hypometric contraversive saccades. Both planning and ON noise may contribute to this factor since both show the same type of signal dependency (Eqs12/14). The second factor was the inactivation effect onkAwhich was observed in four of five monkeys (justified by the
model comparison showing that these effects contributed significantly to model performance during cFN inactivation). This second factor indicates that, for ipsiversive saccades, cFN inacti-vation has an amplifying effect on the signal dependence (kA) of accumulating noise.
Concerning the two potential components of accumulating noise, such an amplifying effect seems unlikely for the signal dependency of ON noise because it is believed to be determined by the mechanism of muscle recruitment [32], and because this mechanism should not depend on how much of the excitation of the ON is provided by the cFN.
The alternative explanation is that cFN inactivation affects the signal dependence of ning noise. For motor plans represented by the active position on a spatiotopic map, the plan-ning-noise coefficientkAis proportional to the inter-trial standard deviation of the motor plan
(seeS1 Text). Therefore, this alternative explanation would suggest that the inter-trial variabil-ity of internal representations of the motor plan would be affected by cFN inactivation, and implies that such effects occur upstream from the brainstem pulse generator. This is compati-ble with the suggestion of Pélisson et al. [30] that the saccade dysmetria induced by cFN inacti-vation is caused by projections of the cFN, not only to the immediate premotor centers of the reticular formation, but also to the SC. Our finding shows that most of the additional saccade variability during cFN inactivation accumulated monotonically during the saccade and could not be explained by noise entering within a feedback loop with reduced gain. This finding indicates that the variability of the neural signals driving the feedback loop is most probably affected by cFN inactivation.
In summary, effects of cFN inactivation on the variance/covariance structure can be mod-eled by two different mechanisms: 1) a gain decrease of internal feedback and 2) an increase of accumulating noise entering in a feedforward path outside of the feedback loop. Both of these effects help to explain why the correlation trajectory increased faster during cFN inactivation than under control conditions (Fig 9). Both reduced feedback gain and increased accumulating noise enlarge noise that is not compensated until the end of the saccade. These noise sources thereby increase the correlation of the eye position during the saccade with eye end position. Saccades executed during cFN inactivation were more variable across trials but show stronger statistical coupling across time within a trial.
Differences of cFN inactivation effects between monkeys
The ipsilateral inactivation effects on the fitted feedback gain (Fig 8C, left bar,Δg) did not
cor-relate across monkeys with the effects on the noise coefficient of the accumulating noise (Fig 8A, left bar,Δk
A). This lack of correlation indicates that effects of cFN inactivation on the
feed-back gain and on the accumulating noise depend on different mechanisms which were differ-ently affected in different monkeys. It shows that cFN inactivation changes the variance/ covariance structure in a complex way varying in at least two degrees of freedom. The factors underlying these idiosyncratic differences of cFN inactivations are not known, but they further support the notion of differential effects of the cFN on circuits inside and outside (possibly upstream) of an internal feedback loop. Further support of this hypothesis is provided by a similar dissociation between the inactivation effects of saccade gain and saccade dynamics (Fig 7A). This finding reproduces in the monkey an observation which was previously reported in the cat[43].
Taken together, these results suggest that cFN inactivation effects on the saccade are medi-ated by (at least) two mechanisms. First, a contribution of cFN activity in online feedback which is relative consistent across individuals and second, an effect of cFN inactivation on feedforward control which is more variable across individuals. The inter-individual consistence of the effect on the feedback mechanisms (i.e. the reduced feedback gain) indicates that this effect is due to a direct contribution of the (missing) cFN activity in an online feedback mechanisms. The inter-individual inconsistence of effects on feedforward control (i.e. components of saccade dysmetria due to altered planning and the increase of accumulating noise) indicates that these effects com-prise (besides primary lesion effects) also adaptive modifications of saccade planning. In an acute cerebellar lesion it is not surprising that such secondary effects on compensatory strategies dissociate across individuals. This interpretation is compatible with the idea that saccade adap-tation is achieved by modifications of both feedback and/or feedforward mechanisms[44]. It is also compatible with the more general concept of cerebellar function being involved in both feedback and feedforward mechanisms [19]. A particular new aspect demonstrated by the cur-rent study is that dissociations between feedback and feedforward mechanisms of saccade con-trol may not only be observed in changes of the mean trajectory of the saccade [44] but also in changes of the structure of its variance (as represented by the inter-subject inconsistency ofΔk A
compared to the consistency ofΔg,Fig 8A/8C). For two reasons this interpretation does not
imply that absolute changes in saccade gain should correlate with changes in planning noise across individuals. First, because gain changes may reflect combined modifications of feedfor-ward and of feedback mechanisms and, second, because mean and variance of planning may change independently of each other since both represent different aspects of a feedforward con-trol mechanism. Also our data do not support a dependency between effects on saccade gain and planning noise because the two monkeys with the smallest and the largest gain change (#1 and #5, respectively,Fig 7A) were not identical to those with the smallest and largest change in the coefficient of variation of planning noise (#3 and #2, respectively,Fig 8A).
Conclusion
Effects of inactivating the cFN on the saccade variability were most prominent for saccades ipsiversive to the inactivated cFN. These saccades exhibited an increase of end point variance and a stronger statistical coupling between eye position during the saccade and saccade end position. The proposed noise model explained these effects by a decrease of the gain of the internal feedback loop and by an increase of planning and ON noise. The decrease of the fitted feedback gain supports the role of the cerebellum in an internal feedback acting through its connections to the brainstem. The increase of planning and ON noise was partly induced indi-rectly by the hypermetria of ipsiversive saccades, because the signal dependency of both noise types amplified their effects on the variance/covariance of the saccade trajectory. In addition to this effect, cFN inactivation seems to cause an increase of planning- and ON noise components of ipsiversive saccades in some individuals.
Methods
Data acquisition
Eye movements were recorded in five adolescent rhesus monkeys trained to track a stepping laser target. Parts of these data and the methods have been published previously [17,45]. Briefly, monkeys were trained to make accurate saccades to a small laser target (diameter 0.3 deg) controlled by a mirror galvanometer (G120D, General Scanning, Watertown, MA, USA). Eye position was monitored with the search coil technique [46]. Eye position and target posi-tion were recorded on magnetic tape and digitized off-line at 1 kHz and filtered offline with a symmetric (zero-phase) Gaussian lowpass (3dB attenuation at 100Hz). The laser target stepped between target positions in the range of ±20 deg eccentricity on the horizontal meridian. The target step amplitudes ranged from 5 to 20 degrees of visual angle. The monkey tracked the tar-get with saccades while its head was immobilized. Eye movements were recorded before and after injection of about 1 to 1.5μl muscimol (solution: 1mg/ml in normal saline) into the cFN
on one side of the cerebellum. The injection of this GABAAagonist causes a functional,
revers-ible inactivation of the cFN [17]. All data analyzed for each monkey (pre- and post-injection) originate from the same recording session. The Institutional Animal Care and Use Committee of the University of Washington evaluated and approved all procedures for this research.
Data analysis
All numerical computations, simulations and optimizations were executed using MATLAB1 (The MathWorks, Inc., Natick, Massachusetts, USA).
For each monkey, offset and gain of a linear calibration function was established to trans-form the horizontal coil raw signal to horizontal eye position. Offset and gain were fitted to minimize the mean squared error between target and eye position during stable fixation peri-ods (after execution of potential corrective saccades) during the pre-injection measurements. This linear calibration was then applied to eye movement data both pre- and post-injection. The calibrated eye position during the saccade was expressed relative to the eye position at sac-cade onset and mirrored for monkeys with muscimol injections in the left cFN so that positive saccade trajectories correspond to movements directed ipsilaterally to the lesion side. The beginning and the end of saccades were defined by the times when eye velocity rose above or fell below 10% of peak velocity. For each saccade the initial motor error was defined by the reti-nal target eccentricity at the time of saccade onset.
Mean saccade trajectory. The mean saccade trajectory, averaged across trials, was parame-terized with respect to two particular aspects: 1) the shape of the velocity profile of saccades with 10 deg amplitude, quantified by total saccade duration, peak velocity and the duration of the deceleration phase (i.e. the time between peak velocity and saccade end), and 2) the amplitude
of saccades with 10 deg initial motor error. Based on these parameters, inactivation effects on the velocity profile of 10 deg saccades were quantified by the signed differencesΔVP = [Δpeak
velocity,Δtotal dur.,Δdeceleration dur.] between saccades during cFN inactivation and control
saccades. The effect of pharmacological inactivation of the cFN on the saccade gain was quanti-fied by the corresponding differences (Δamplitude) of the amplitude of saccades with 10 deg
motor error. All effect sizes were computed separately for ipsiversive and contraversive saccades. This evaluation differs from previous studies in that effects of cFN inactivation on peak velocity, total duration, and deceleration duration were mostly reported for averages across saccades responding to the same target step size or across saccades with the same motor error. In con-trast, the current study evaluates these parameters for fixed saccade amplitude. The advantage of this method is that effects on the main sequence can be quantified independently of effects on the saccade amplitude. To avoid problems related to differences of the distributions of motor error and saccade amplitude between different monkeys and different saccade conditions (con-trol, ipsiversive inactivated, and contraversive inactivated) the relations between amplitude, peak velocity, and skewness [6] were fitted separately for each monkey and each saccade condi-tion. Total saccade duration, peak velocity and the duration of the deceleration phase of sac-cades with 10 deg amplitude were then determined by interpolation in these fits.
If the neural activity of the cFN and its effect on the mean saccade trajectory under control conditions were identical in all monkeys, then we would expect differences of cFN inactivation effects between monkeys being determined by a single degree of freedom, i.e., the strength of attenuation of cFN activity achieved by the muscimol injection. In that case, and if inactivation effects on the mean saccade trajectory can be approximated as being proportional to the strength of cFN attenuation, the different aspects of inactivation effects on the mean saccade trajectory would be proportional to each other. To test this, we investigated whether the com-ponents ofΔVP andΔamplitude were proportional to each other, 1) for the three components
ofΔVP only and 2) for a total effect vector [ΔVP;Δamplitude] combining all effect aspects.
The proportionality was quantified by the fraction of total variance covered by the projection of the normalized data on the constrained major axis (i.e., on the connecting line between the mean and the coordinate origin). A value of this fraction (Fprop) of 1 indicates that the different
effect components were perfectly proportional to each other. Fornspherically distributed effect components (i.e., no support of proportionality between the components)Fproptakes the value
of 1/n. Therefore, we defined the proportionality indexIpropby
IProp¼
Fprop 1=n
1 1=n ; Iprop1 ð1Þ
To analyze the proportionality of the components ofΔVP or of the total effect vector [ΔVP; Δamplitude],nwas set to 3 or 4 respectively.

![Fig 4. Variance- and covariance trajectories. Data (solid) and model fits (dashed) of the simplified model without ON noise (fitted parameters: [k A , k PBN , g]; fixed: k ON = 0)](https://thumb-eu.123doks.com/thumbv2/123dok_br/18345145.352438/8.918.265.861.114.598/variance-covariance-trajectories-dashed-simplified-model-fitted-parameters.webp)