GMDD
8, 7189–7247, 2015CESM/CAM5 improvement and
application
J. He et al.
Title Page
Abstract Introduction
Conclusions References
Tables Figures
◭ ◮
◭ ◮
Back Close
Full Screen / Esc
Printer-friendly Version Interactive Discussion
Discussion
P
a
per
|
Discussion
P
a
per
|
Discussion
P
a
per
|
Discussion
P
a
per
|
Geosci. Model Dev. Discuss., 8, 7189–7247, 2015 www.geosci-model-dev-discuss.net/8/7189/2015/ doi:10.5194/gmdd-8-7189-2015
© Author(s) 2015. CC Attribution 3.0 License.
This discussion paper is/has been under review for the journal Geoscientific Model Development (GMD). Please refer to the corresponding final paper in GMD if available.
CESM/CAM5 improvement and
application: comparison and evaluation of
updated CB05_GE and MOZART-4
gas-phase mechanisms and associated
impacts on global air quality and climate
J. He1, Y. Zhang1, S. Tilmes2, L. Emmons2, J.-F. Lamarque2, T. Glotfelty1,
A. Hodzic2, and F. Vitt2
1
Department of Marine, Earth, and Atmospheric Science, North Carolina State University, Raleigh, NC, USA
2
National Center for Atmospheric Research, Boulder, CO, USA
Received: 13 July 2015 – Accepted: 20 July 2015 – Published: 27 August 2015
Correspondence to: Y. Zhang ([email protected])
GMDD
8, 7189–7247, 2015CESM/CAM5 improvement and
application
J. He et al.
Title Page
Abstract Introduction
Conclusions References
Tables Figures
◭ ◮
◭ ◮
Back Close
Full Screen / Esc
Printer-friendly Version Interactive Discussion
Discussion
P
a
per
|
Discussion
P
a
per
|
Discussion
P
a
per
|
Discussion
P
a
per
|
Abstract
Atmospheric chemistry plays a key role in determining the amounts and distributions of oxidants and gaseous precursors that control the formation of secondary gaseous and aerosol pollutants; all of those species can interact with the climate system. To
under-stand the impacts of different gas-phase mechanisms on global air quality and climate
5
predictions, in this work, a comprehensive comparative evaluation is performed using the Community Atmosphere Model (CAM) Version 5 with comprehensive tropospheric and stratospheric chemistry (CAM5-chem) within the Community Earth System Model (CESM) with two most commonly-used gas-phase chemical mechanisms: the 2005 Carbon Bond mechanism with Global Extension (CB05_GE) and the Model of OZone 10
and Related chemical Tracers version 4 (MOZART-4) mechanism with additional
up-dates (MOZART-4x). MOZART-4x and CB05_GE use different approaches to
repre-sent volatile organic compounds (VOCs) and different surrogates for secondary organic
aerosol (SOA) precursors. MOZART-4x includes a more detailed representation of iso-prene chemistry compared to CB05_GE. CB05_GE includes additional oxidation of 15
SO2by O3over the surface of dust particles, which is not included in MOZART-4x. The
results show that the two CAM5-chem simulations with CB05_GE and MOZART-4x
pre-dict similar chemical profiles for major gases (e.g., O3, CO, and NOx) compared to the
aircraft measurements, with generally better agreement for NOy profile by CB05_GE
than MOZART-4x. The concentrations of SOA at four sites in CONUS and organic car-20
bon (OC) over the IMPROVE sites are well predicted by MOZART-4x (with NMBs of
−1.9 and 2.1 %, respectively) but moderately underpredicted by CB05_GE (with NMBs
of−23.1 and −20.7 %, respectively). This is mainly due to the higher biogenic
emis-sions and hydroxyl radical levels simulated with MOZART-4x than with CB05_GE. The concentrations of OC over Europe are largely underpredicted by both MOZART-4x and 25
CB05_GE, with NMBs of−73.0 and−75.1 %, respectively, indicating the uncertainties
con-GMDD
8, 7189–7247, 2015CESM/CAM5 improvement and
application
J. He et al.
Title Page
Abstract Introduction
Conclusions References
Tables Figures
◭ ◮
◭ ◮
Back Close
Full Screen / Esc
Printer-friendly Version Interactive Discussion
Discussion
P
a
per
|
Discussion
P
a
per
|
Discussion
P
a
per
|
Discussion
P
a
per
|
vection scheme can contribute to the large bias in the model predictions (e.g., SO2,
CO, black carbon, and aerosol optical depth). The two simulations also have similar cloud/radiative predictions, with slightly better performance of domain average cloud condensation nuclei (CCN) at supersaturation of 0.5 % by CB05_GE, but slightly bet-ter agreement with observed CCN (at supersaturation of 0.2 %) profile over Beijing by 5
MOZART-4x. The two gas-phase mechanisms result in a global average difference of
0.5 W m−2 in simulated shortwave cloud radiative forcing, with significant differences
(e.g., up to 13.6 W m−2) over subtropical regions.
1 Introduction
Atmospheric chemistry plays an important role in the perturbation of climate system 10
by determining the amounts and distributions of important oxidants and gaseous
pre-cursors for secondary air pollutants such as ozone (O3) and aerosols. Aerosols can
influence the Earth’s radiative balance by directly scattering and absorbing radiation
and indirectly affecting cloud properties through acting as cloud condensation nuclei
(CCN) and ice nuclei. The aerosol effects on radiation depend critically on their
chemi-15
cal composition and physical properties. Therefore, atmospheric chemistry is an
impor-tant component for atmospheric and Earth system models. Different chemical
mecha-nisms (e.g., different chemical reactions and kinetic parameters) can lead to differences
in the predictions of gases, secondary aerosols, as well as climatic variables such as CCN, cloud droplet number concentration (CDNC), and radiative forcings (Luecken 20
et al., 2008; Sarwar et al., 2008; Zhang et al., 2012a; Lamarque et al., 2013).
There are generally two types of species in the gas-phase mechanisms: inorganic and organic. Although most mechanisms include the same important inorganic species
(e.g., O3, CO, HOx, and NOx), the predicted amounts can vary greatly among diff
er-ent mechanisms (Knote et al., 2014a). Some mechanisms ignore reactions with very 25
low reaction rates since they do not affect results significantly. Also, some reactions
temper-GMDD
8, 7189–7247, 2015CESM/CAM5 improvement and
application
J. He et al.
Title Page
Abstract Introduction
Conclusions References
Tables Figures
◭ ◮
◭ ◮
Back Close
Full Screen / Esc
Printer-friendly Version Interactive Discussion
Discussion
P
a
per
|
Discussion
P
a
per
|
Discussion
P
a
per
|
Discussion
P
a
per
|
ature and pressure due to the uncertainties in the laboratory measurements or the use of mechanisms that have not been updated in time. Unlike inorganic species,
there are more significant differences in the representation of organic species. Light
organic species with low molecular weight are often explicitly treated (e.g., methane, formaldehyde (HCHO)), whereas lumped or surrogate species are used to represent 5
more complex mixtures of heavy organic compounds with high molecular weight (e.g., aromatics, organic nitrates). There are three most common representations of organic chemistry, including the lumped structure technique, the surrogate species approach, and the lumped species method (Zhang et al., 2004). For example, the Carbon Bond mechanism version IV (CB-IV, Gery et al., 1989), which uses the lumped structure 10
approach for volatile organic compounds (VOCs), has been widely used in air quality modeling systems through urban to regional scales for many years. This mechanism has later been extensively updated in 2005 (CB05, Yarwood et al., 2005), and has been implemented into the Community Multiscale Air Quality model (CMAQ, Sarwar et al., 2008) and the Weather Research and Forecasting model with Chemistry (WRF-15
Chem, Wang et al., 2014). CB05 has been further expanded to include more than 120 reactions that are important on global scale (CB05 with global extension (CB05_GE), Karamchandani et al., 2012) and implemented into global models, such as the Global-through-Urban WRF/Chem (GU-WRF/Chem, Zhang et al., 2012a) and the Community Atmosphere Model version 5 (CAM5), the atmospheric component of the Community 20
Earth System Model (CESM/CAM5, He and Zhang, 2014). The Model of OZone and Related chemical Tracers version 4 (MOZART-4, Emmons et al., 2010) mechanism, which uses the lumped species approach for VOCs, has also been used in WRF-Chem (Knote et al., 2014b), and CAM with extensive tropospheric and stratospheric chem-istry (CAM-chem) Versions 4 and 5 (Lamarque et al., 2012; Tilmes et al., 2015). Dif-25
ferent gas-phase mechanisms have also been compared in several studies, however, most of which are conducted in box models or using regional models (Kim et al., 2009,
2011a, b). For example, using WRF-Chem, Zhang et al. (2012b) found that three diff
GMDD
8, 7189–7247, 2015CESM/CAM5 improvement and
application
J. He et al.
Title Page
Abstract Introduction
Conclusions References
Tables Figures
◭ ◮
◭ ◮
Back Close
Full Screen / Esc
Printer-friendly Version Interactive Discussion
Discussion
P
a
per
|
Discussion
P
a
per
|
Discussion
P
a
per
|
Discussion
P
a
per
|
Pollution Research Center Mechanism (SAPRC99), and the CB05) can predict different
O3 concentrations up to 5 ppb at surface in July 2001. Knote et al. (2014a) also
com-pared seven chemical mechanisms using a box model and found that the differences
in daytime hydroxyl radical (OH) concentrations can be up to 40 %.
Climate change can also strongly influence atmospheric chemistry and aerosols and 5
therefore air quality. For example, photolysis and temperature-dependent reactions can be directly impacted by climate change (Jacob and Winner, 2009). Due to the nonlin-ear relationships between chemistry, aerosols, and climate, it is important to accurately represent their interactions in a three-dimensional global model. Several studies have demonstrated the capability of CAM-chem to represent tropospheric (Aghedo et al., 10
2011; Lamarque et al., 2010, 2011a, b; Tilmes et al., 2015) and stratospheric (Lamar-que et al., 2008; Lamar(Lamar-que and Solomon, 2010) conditions. The chemical mechanism used in CAM-chem is based on MOZART-4, with detailed stratospheric chemistry of Kinnison et al. (2007). In this work, two most commonly used gas-phase mechanisms: the extended MOZART-4 (with updates as described by Knote et al. (2014b) and ad-15
ditional updates in this work) (referred to as MOZART-4x) and the CB05_GE chemical mechanisms are compared using the latest CESM/CAM5. The objectives are to
exam-ine the differences in the secondary organic aerosols (SOA) predictions resulted from
the two gas-phase chemical mechanisms and study the sensitivity of air quality and
climate predictions to different gas-phase chemical mechanisms.
20
2 Model descriptions
The CESM/CAM5 used in this work is based on CAM version 5.3 of CESM version 1.2.2, coupled to comprehensive tropospheric and stratospheric chemistry (CAM5-chem, Tilmes et al., 2015) using the 7-mode Modal Aerosol Model (MAM7) (Liu et al., 2012). This version of CAM5-chem was further developed and improved at North Car-25
GMDD
8, 7189–7247, 2015CESM/CAM5 improvement and
application
J. He et al.
Title Page
Abstract Introduction
Conclusions References
Tables Figures
◭ ◮
◭ ◮
Back Close
Full Screen / Esc
Printer-friendly Version Interactive Discussion
Discussion
P
a
per
|
Discussion
P
a
per
|
Discussion
P
a
per
|
Discussion
P
a
per
|
detailed description of this version of CESM CAM5-chem (referred to as CAM5-NCSU hereafter) used in this study can be found in He and Zhang (2014) and He et al. (2015).
2.1 Chemical mechanisms
In this study, CB05_GE has been updated to include additional kinetic reactions de-scribing interactions between functionalization and fragmentation processes during 5
gas-phase oxidation of anthropogenic and biogenic VOCs by OH (Glotfelty et al., 2015). The products of those reactions are linked with the organic gas/particle partitioning for SOA formation. Heterogeneous reactions on tropospheric aerosols and stratospheric clouds are also added as same as those in MOZART-4x (Tilmes et al., 2015) with one additional pathway in CB05_GE to simulate sulfate formation through oxidation of sulfur 10
dioxide (SO2) by O3on the surface of dust particles.
MOZART-4x used in this work extends the MOZART chemical mechanism used in Lamarque et al. (2012) and Tilmes et al. (2015) to include several updates as described in Knote et al. (2014b). These updates include (1) detailed treatments of
monoter-penes (α-pinene, β-pinene, and limonene) and 2-methyl-3-buten-2-ol (MBO), (2)
de-15
tailed treatments of aromatics (e.g., benzene, toluene, and xylenes), (3) additional
gly-oxal (C2H2O2) production from oxidized VOCs products, and (4) an updated isoprene
(ISOP) oxidation scheme. In this work, the oxidation of anthropogenic and biogenic VOCs and subsequent aging processes are also included in MOZART-4x, and the products of those reactions are linked with the organic gas/particle partitioning for SOA 20
formation.
Table 1 shows the gas-phase organic precursors for SOA formation treated in MOZART-4x and CB05_GE. For aromatic precursors of SOA, MOZART-4x includes benzene, toluene (TOL), xylenes, and cresol. Although CB05_GE does not include benzene, it includes polycyclic aromatic hydrocarbons (PAH) as a SOA precursor. For 25
alkane precursors of SOA, MOZART-4x includes BIGALK (lumped alkanes with carbon
(C) number>3), whereas CB05_GE includes ALKH (long-chain alkanes, with C>6).
GMDD
8, 7189–7247, 2015CESM/CAM5 improvement and
application
J. He et al.
Title Page
Abstract Introduction
Conclusions References
Tables Figures
◭ ◮
◭ ◮
Back Close
Full Screen / Esc
Printer-friendly Version Interactive Discussion
Discussion
P
a
per
|
Discussion
P
a
per
|
Discussion
P
a
per
|
Discussion
P
a
per
|
and BIGENE (lumped alkenes with C>3), whereas CB05_GE includes terminal olefin
(OLE) and internal olefin (IOLE). The emissions for biogenic alkene precursors are from the Model of Emissions of Gases and Aerosols from Nature version 2.1 (MEGAN2.1, Guenther et al., 2012). Both MOZART-4x and CB05_GE include alpha-pinene (APIN), beta-pinene (BPIN), limonene, and ISOP as precursors for biogenic SOA. CB05_GE 5
also includes additional biogenic precursors such as speciated ocimene (OCI), hu-mulene (HUM) and terpinene (TER). However, in MOZART-4x, the species mapping
for MEGAN emission calculation is slightly different. For example,α-pinene and other
compounds (e.g., α-thujene, p-cymene, and o-cymene) are mapped into APIN, β
-pinene and other compounds (e.g., sabinene and camphene) are mapped into BPIN, 10
limonene and other compounds (e.g., phellandrene and terpinene) are mapped into LIMON, myrcene and other compounds (e.g., ocimene) are mapped into MYRC, and
beta-caryophyllene and other sesquiterpenes (e.g., humulene andα-bergamotene) are
mapped into BCARY. Due to the different mapping for MEGAN species, biogenic
emis-sions between MOZART-4x and CB05_GE are different, which can result in different
15
biogenic SOA predictions. On the other hand, the rate coefficients for the oxidations of
biogenic VOCs (e.g., APIN, BPIN, and limonene) are constant in CB05_GE, whereas
they are temperature dependent in MOZART-4x, such a difference can result in different
SOA predictions as well. In addition, there are uncertainties in the HOx recycling
as-sociated with isoprene chemistry in CB05_GE (Karamchandani et al., 2012), whereas 20
MOZART-4x used in this work includes OH recycling from improved isoprene chemistry. For example, in CB05_GE, ISOP is oxidized by OH to generate 91.2 % molar yield of
the hydroperoxyl radical (HO2). In MOZART-4x, the isoprene peroxy radical from the
oxidation ISOP by OH (i.e., ISOPO2) has different yields of HO2through reactions with
NO, NO3, methylperoxy radical (CH3O2), and acetylperoxy radical (CH3CO3), and it
25
can also consume HO2itself. These reactions have different reaction rate coefficients.
These differences can affect O3, OH, and NOx predictions, and thus the oxidation of
GMDD
8, 7189–7247, 2015CESM/CAM5 improvement and
application
J. He et al.
Title Page
Abstract Introduction
Conclusions References
Tables Figures
◭ ◮
◭ ◮
Back Close
Full Screen / Esc
Printer-friendly Version Interactive Discussion
Discussion
P
a
per
|
Discussion
P
a
per
|
Discussion
P
a
per
|
Discussion
P
a
per
|
2.2 Aerosol/cloud treatments
In CAM5-NCSU, the aerosol module is based on MAM7 of Liu et al. (2012), with improvements in terms of condensation, nucleation, aerosol thermodynamics, and aerosol activation (He and Zhang, 2014; Gantt et al., 2014). The major updates include: (1) the new particle formation treatments with a combination of the default nucleation 5
parameterizations of Vehkamaki et al. (2002), Merikanto et al. (2007), and a newly added ion-mediated aerosol nucleation (Yu, 2010) above the planetary boundary layer (PBL), and a combination of the three and an additional parameterization of Wang and Penner (2009) in the PBL, (2) the inorganic aerosol thermodynamics based on ISOR-ROPIA II of Fountoukis and Nenes (2007), which explicitly simulates the thermody-10
namics of sulfate (SO24−), ammonium (NH+4), nitrate (NO−3), sodium (Na+), and chloride
(Cl−) in the Aitken, accumulation, and fine sea-salt modes, as well as the impact of
crustal species associated with the fine dust mode, (3) an advanced aerosol activation scheme based on Fountoukis and Nenes (2005) with additional updates based on Ku-mar et al. (2009) and Barahona et al. (2010), which accounts for adsorption activation 15
from insoluble CCN and giant CCN equilibrium timescale on aerosol activation. CAM5-NCSU also includes an advanced treatment for SOA formation based on a volatility-basis-set (VBS) approach that has been coupled with CB05_GE by Glot-felty et al. (2015) and is also coupled with MOZART-4x in this work. This approach consists of two primary components: (1) volatile SOA (VSOA) formation from anthro-20
pogenic VOCs (AVOCs) and biogenic VOCs (BVOCs) and (2) the volatility and aging of primary organic aerosol (POA) and the repartitioning of the semi/intermediate volatil-ity compounds (S/IVOC) into SOA. The VSOA treatment is based on the treatment of Tsimpidi et al. (2010). The products of VOC oxidation are mapped onto the volatil-ity distribution using the aerosol mass yields listed in Tsimpidi et al. (2010) using the 25
GMDD
8, 7189–7247, 2015CESM/CAM5 improvement and
application
J. He et al.
Title Page
Abstract Introduction
Conclusions References
Tables Figures
◭ ◮
◭ ◮
Back Close
Full Screen / Esc
Printer-friendly Version Interactive Discussion
Discussion
P
a
per
|
Discussion
P
a
per
|
Discussion
P
a
per
|
Discussion
P
a
per
|
the approach of Stainer et al. (2008), where the SOA mass yields for naphthalene, 1-methylnaphthalene, and 2-methylnaphthalene are averaged as surrogates for PAHs. The volatility of POA and the subsequent formation of SOA from POA vapors are based on the work of Robinson et al. (2007) and Shrivastava et al. (2008). POA emissions
are distributed into nine logarithmically-spaced volatility bins with effective saturation
5
(C∗) values ranging from 10−2 to 106µg m−3. An updated emission spectrum is used
to distribute the POA emissions into the volatility bins as the emission spectrum used in Robinson et al. (2007) has been shown to be too volatile (Cappa and Jimenez, 2010; Hodzic et al., 2010; Jathar et al., 2011). This new emission spectrum maps the anthropogenic POA emissions onto the volatility distribution based on thermodenuder 10
measurements of gasoline exhaust and also contains separate emissions fractions for biomass burning aerosol which is less volatile than anthropogenic POA (May et al., 2013a, b). The emission spectrum of Robinson et al. (2007), also assumes that the emissions of SVOCs are fully captured by the original POA emissions and missing IVOCs are assumed to be equivalent to 1.5 times the POA emissions inventory with 15
these additional emissions placed in the three highest volatility bins. However, because the estimations of the missing IVOC emissions are poorly constrained, the 1.5 times the POA mass for IVOCs is not included in this study.
In additional to the classic 1-D VBS treatment as described above, functionaliza-tion and fragmentafunctionaliza-tion treatment described in Shrivastava et al. (2013) are included 20
in this version of VBS for both VSOA and S/IVOCs (referred to as 1.5 D VBS). In this treatment, the VSOA and S/IVOCs in each volatility bin are split into three dif-ferent species representing three generations of oxidation. During the first two gen-erations of oxidation the mass of the VSOA and S/IVOCs grows by 15 %, reflecting the addition of oxygen atoms. In this aging scheme not only do the masses of VSOA 25
and S/IVOCs increase in generation when oxidized by OH (at a rate of 1.0×10⁻¹¹
GMDD
8, 7189–7247, 2015CESM/CAM5 improvement and
application
J. He et al.
Title Page
Abstract Introduction
Conclusions References
Tables Figures
◭ ◮
◭ ◮
Back Close
Full Screen / Esc
Printer-friendly Version Interactive Discussion
Discussion
P
a
per
|
Discussion
P
a
per
|
Discussion
P
a
per
|
Discussion
P
a
per
|
bonds, which can increase volatility of the organic species thus reducing SOA forma-tion. This is parameterized by allowing 17.25 % of the organic mass to pass to the next lowest volatility bin but passing 75 % of the VSOA and S/IVOC to the highest volatil-ity bin in the VBS structure. The remaining mass is assumed to be lost to species of higher volatility than the VBS structure. A more detailed description of SOA formation 5
from the VBS approach is summarized in Glotfelty et al. (2015).
3 Model configurations and evaluation protocols
3.1 Model setup and inputs
The simulations are performed with specified dynamics configuration, of which winds and temperature are driven by the Goddard Earth Observing System Model, Version 5 10
(GEOS-5) meteorology. The internally-derived meteorological fields are nudged every time step (30 min) by 10 % towards analysis fields from GEOS-5. The simulations are
conducted for a 3 year period of 2008–2010 at a horizontal resolution of 0.9◦×1.25◦
and a vertical resolution of 56 layers for CAM5. The initial chemical conditions are generated with same configurations with 1 year spinup.
15
The offline emissions used in this work are based on those used in Tilmes
et al. (2015), of which the anthropogenic and biofuel emissions are from the Mon-itoring Atmospheric Composition and Climate/CityZen (MACCity) emission data set (Granier et al., 2011), and biomass burning emissions are taken from the Atmospheric Chemistry and Climate Model Intercomparison Project (ACCMIP) historical emissions 20
GMDD
8, 7189–7247, 2015CESM/CAM5 improvement and
application
J. He et al.
Title Page
Abstract Introduction
Conclusions References
Tables Figures
◭ ◮
◭ ◮
Back Close
Full Screen / Esc
Printer-friendly Version Interactive Discussion
Discussion
P
a
per
|
Discussion
P
a
per
|
Discussion
P
a
per
|
Discussion
P
a
per
|
ning NOx (Price and Rind, 1992; Price et al., 1997), mineral dust (Zender et al., 2003),
and sea-salt (Martensson et al., 2003).
3.2 Available measurements for model evaluation
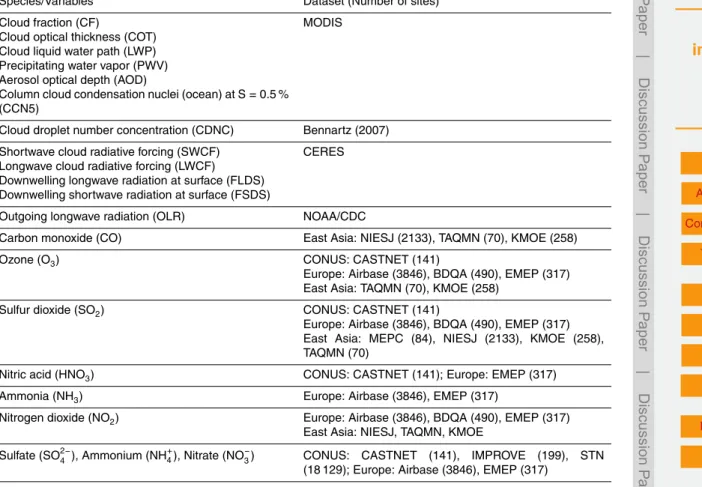
A number of observational datasets from surface networks and satellites are used for model evaluation. They are summarized along with the variables to be evaluated in Ta-5
ble 2. The global surface network includes data sets from the National Oceanic and Atmospheric Administration Climate Diagnostics Center (NOAA/CDC). The satellite datasets include the Moderate Resolution Imaging Spectroradiometer (MODIS) for the retrievals of cloud properties, the Clouds and Earth’s Radiant Energy System (CERES), for the retrievals of radiation fluxes at surface and top of atmosphere, the Aura Ozone 10
Monitoring Instrument in combination with Aura Microwave Limb Sounder (OMI/MLS) for the tropospheric ozone retrieval, the Measurements Of Pollution In The Troposphere (MOPITT) for tropospheric carbon monoxide (CO) retrieval, and the SCanning Imag-ing Absorption spectroMeter for Atmospheric CHartographY (SCIAMACHY) for the
re-trievals of tropospheric nitrogen dioxide (NO2), HCHO, and C2H2O2. Other
satellite-15
based data include the MODIS-derived CDNC and cloud liquid water path (LWP) by Bennartz (2007).
Regional observational networks include the Clean Air Status and Trends Net-work (CASTNET), the Interagency Monitoring of Protected Visual Environments (IM-PROVE), the Speciation Trends Network (STN), and the Air Quality System (AQS) over 20
CONUS; the European Monitoring and Evaluation Program (EMEP), the Base de Don-nées sur la Qualité de l’Air (BDQA, France), and the European air quality database (AirBase) over Europe; the Ministry of Environmental Protection of China (MEPC), the National Institute for Environmental Studies of Japan (NIESJ), the Korean Ministry Of Environment (KMOE), and Taiwan Air Quality Monitoring Network (TAQMN) over East 25
GMDD
8, 7189–7247, 2015CESM/CAM5 improvement and
application
J. He et al.
Title Page
Abstract Introduction
Conclusions References
Tables Figures
◭ ◮
◭ ◮
Back Close
Full Screen / Esc
Printer-friendly Version Interactive Discussion
Discussion
P
a
per
|
Discussion
P
a
per
|
Discussion
P
a
per
|
Discussion
P
a
per
|
(July–August 2009), and Bakersfield and Pasadena, CA (May–June 2010) are used to evaluate SOA predictions.
Aircraft measurements include aircraft campaigns from Aerosol, Radiation, and
Cloud Processes affecting Arctic Climate (ARCPAC), Stratosphere–Troposphere
Anal-yses of Regional Transport in 2008 (START08), California Nexus 2010 (CalNex), Arctic 5
Research of the Composition of the Troposphere from Aircraft and Satellites (ARC-TAS), and CCN measurements in China (CCN_China). ARCPAC (Brock et al., 2011) was conducted during March–April 2008 in the troposphere of the Alaskan Arctic, in-cluding particle size distributions, composition, and optical properties. START08 (Pan et al., 2010) was conducted during April–June 2008 to study the chemical and trans-10
port characteristics of the extratropical upper tropospheric and lower stratospheric re-gion over central North America. CalNex (Ryerson et al., 2013) was conducted during May–July 2010 to provide improved scientific knowledge for emission control strategies to simultaneously address the interrelated issues of air quality and climate change. ARCTAS (Jacob et al., 2010) was conducted during April–June 2008 to investigate the 15
chemistry of the Arctic’s lower atmosphere. CCN_China (Zhang et al., 2011) was con-ducted over Beijing during July–September 2008, to investigate the impacts of aerosols on cloud formation.
3.3 Evaluation protocol
The protocols for performance evaluation include spatial distributions and statistics, fol-20
lowing the approach of Zhang et al. (2012b). The aircraft profile evaluation is based on the Atmospheric Model Working Group (AMWG) diagnostics package (Tilmes et al., 2015). Monthly-mean model results are compared for corresponding regions and sea-sons of the field campaign. The analysis of the performance statistics will focus on mean bias (MB), normalized mean bias (NMB), normalized mean error (NME), and 25
forc-GMDD
8, 7189–7247, 2015CESM/CAM5 improvement and
application
J. He et al.
Title Page
Abstract Introduction
Conclusions References
Tables Figures
◭ ◮
◭ ◮
Back Close
Full Screen / Esc
Printer-friendly Version Interactive Discussion
Discussion
P
a
per
|
Discussion
P
a
per
|
Discussion
P
a
per
|
Discussion
P
a
per
|
ing (SWCF), and longwave cloud forcing (LWCF) from CERES; cloud fraction (CF), aerosol optical depth (AOD), cloud optical thickness (COT), precipitating water vapor (PWV), and CCN from MODIS, as well as CDNC and LWP from Bennartz (2007). CDNC is calculated as an average value of layers between 850 and 960 hPa for com-parison with the satellite-derived values. Chemical concentrations evaluated include 5
CO, O3, SO2, ammonia (NH3), NO2, nitric acid (HNO3), VOCs (i.e., formaldehyde,
iso-prene, and toluene), particulate matter (PM) with diameter less than and equal to 10 µm
(PM10) and 2.5 µm (PM2.5), and PM2.5major components (e.g., SO
2−
4 , NH
+
4, NO
−
3, black
carbon (BC), organic carbon (OC), and total carbon (TC)) for CONUS and Europe. The chemical observations over East Asia are very limited, which only include surface ob-10
servations of CO, SO2, NO2, and O3 from Hong Kong, South Korea, and Japan, and
PM10over mainland China (derived from air pollution index), Hong Kong, South Korea,
and Japan. Since PM2.5 and PM10 are not explicit species simulated in MAM7, they
are simply assumed to be the particles in the first 5 modes (i.e., Aitken, accumula-tion, primary carbon, fine sea-salt, and fine dust modes) and the total 7 modes (i.e., 15
Aitken, accumulation, primary carbon, fine sea-salt, fine dust, coarse sea-salt, and
coarse dust modes), respectively. Column concentrations of tropospheric CO, NO2,
HCHO, C2H2O2, and tropospheric O3 residual (TOR) are evaluated for globe. The
CO column evaluation follows the AMWG diagnostics approach, which applies 1◦×1◦
monthly mean Level 3 MOPITT a priori and averaging kernels to monthly mean model 20
results to account for the a priori dependence and vertical resolution of the MOPITT
data. The measured NO2and HCHO columns are derived from the satellite retrievals
from SCIAMCHY, which are monthly mean gridded data on a 0.25◦×0.25◦ horizontal
grid resolution for the period of 2008–2010. The measured glyoxal column is derived from the satellite retrievals from SCIAMCHY, which are monthly mean gridded data 25
on a 0.125◦×0.125◦ horizontal grid resolution for the period of 2008. The measured
O3 is derived from the combing retrievals from the Aura Ozone Monitoring Instrument
and Microwave Limb Sounder observations, which are monthly mean gridded data on
GMDD
8, 7189–7247, 2015CESM/CAM5 improvement and
application
J. He et al.
Title Page
Abstract Introduction
Conclusions References
Tables Figures
◭ ◮
◭ ◮
Back Close
Full Screen / Esc
Printer-friendly Version Interactive Discussion
Discussion
P
a
per
|
Discussion
P
a
per
|
Discussion
P
a
per
|
Discussion
P
a
per
|
All surface observational data used for evaluating 2008–2010 simulations are avail-able throughout 2008–2010 except for several variavail-ables with data during a limited time period of 2001–2010 including OC from EMEP, SOA from Lewandowski et al. (2013), and OA from Zhang et al. (2007) and Jimenez et al. (2009).
4 Results
5
4.1 Chemical evaluations
4.1.1 Surface evaluation
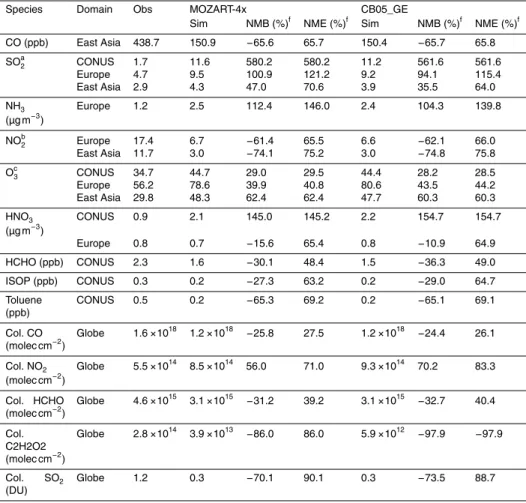
Table 3 summarizes the performance statistics for major chemical species for CAM5-NCSU simulations with MOZART-4x and CB05_GE. Figure 1 shows the scatter plots between observations and model results. The statistical performance of MOZART-4x 10
and CB05_GE are similar for most chemical species. As shown in Table 3, CO is
under-predicted over East Asia by both MOZART-4x and CB05_GE, with NMBs of−65.6 and
−65.7 %, respectively. The underprediction of CO is mainly due to the underestimation
of CO emissions from biomass burning (Tilmes et al., 2015). The underestimations in CO emissions lead to underpredictions of column CO concentrations, with NMBs of 15
−25.8 and−24.4 % for MOZART-4x and CB05_GE, respectively. Both MOZART-4x and
CB05_GE largely overpredict the concentrations of SO2 over CONUS (with NMBs of
580.2 and 561.6 %, respectively), East Asia (with NMBs of 47.0 and 35.5 % %, respec-tively), and Europe (with NMBs of 100.9 and 94.1 %, respecrespec-tively), likely due to the
overestimation of SO2 emissions, the uncertainties in the emission injection heights
20
as well as the vertical mixing scheme used. The overpredictions of surface SO2
con-centrations result in the overpredictions of the concon-centrations of SO24− at the surface.
Surface NH3 concentrations from MOZART-4x and CB05_GE are overpredicted over
Europe (with NMBs of 112.4 and 104.3 %, respectively), likely due to the
overestima-tion of NH3 emissions. The overpredictions of the NH3 concentrations result in the
GMDD
8, 7189–7247, 2015CESM/CAM5 improvement and
application
J. He et al.
Title Page
Abstract Introduction
Conclusions References
Tables Figures
◭ ◮
◭ ◮
Back Close
Full Screen / Esc
Printer-friendly Version Interactive Discussion
Discussion
P
a
per
|
Discussion
P
a
per
|
Discussion
P
a
per
|
Discussion
P
a
per
|
overpredictions of the NH+4 concentrations at the surface. The concentrations of NO2
from MOZART-4x and CB05_GE are largely underpredicted over Europe (with NMBs
of−61.4 and−62.1 %, respectively) and East Asia (with NMBs of−74.1 and−74.8 %,
respectively), which is likely due to the uncertainties in estimating total NOx
emis-sions and emission injection heights as well. As shown in Fig. 1, the concentrations 5
of O3from MOZART-4x and CB05_GE are overpredicted over CONUS (with NMBs of
29.0 and 28.2 % over the CASTNET sites, respectively), Europe (with NMBs of 19.3 and 22.2 % over the EMEP sites, respectively) and East Asia (with NMBs of 68.8 and
65.7 % over the KMOE sites, respectively). This is likely due to the less O3 titration
resulted from the underpredictions of NOx, coarse resolution, as well as dilution of
10
NOx emissions. The overpredictions of SO
2−
4 result in the underpredictions of NO
−
3
and Cl−, through thermodynamic equilibrium, and therefore overpredictions of HNO3
over CONUS. However, HNO3is underpredicted over Europe, which is likely due to the
underpredictions of NOx. Cl
−
is overpredicted over Europe, which is likely due to the uncertainties for the gas/particle partitioning over coarse modes (He and Zhang, 2014). 15
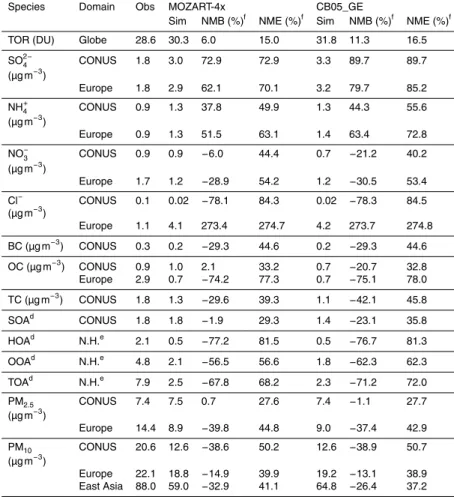
Both MOZART-4x and CB05_GE predict PM2.5 relatively well over CONUS, however,
they underpredict PM10 over the AQS sites, with NMBs of −38.6 and −38.9 %,
re-spectively. The underpredictions of PM10 are likely due to the inaccurate predictions of
coarse particles. Both MOZART-4x and CB05_GE underpredict PM2.5 and PM10 over
Airbase and BDQA sites, however, they overpredict PM10by 3.14 µg m
−3
(or by 22.2 %) 20
and 3.43 µg m−3 (or by 24.2 %) over the EMEP sites, respectively, which is likely due
to the overpredictions of coarse particles (e.g., Cl−) over these sites. Both MOZART-4x
and CB05_GE underpredict PM10 by 33.61 µg m
−3
(or by 33.4 %) and 26.71 µg m−3(or
by 26.6 %) over the MEPC sites in mainland China, respectively, which is mainly due to
the uncertainties in the emissions in primary gases (e.g., SO2, NOx, NH3, and VOCs)
25
and particulate species (e.g., SO24−, BC, and POA). Granier et al. (2011) compared
the regional emissions among different inventories and indicated large uncertainties in
emis-GMDD
8, 7189–7247, 2015CESM/CAM5 improvement and
application
J. He et al.
Title Page
Abstract Introduction
Conclusions References
Tables Figures
◭ ◮
◭ ◮
Back Close
Full Screen / Esc
Printer-friendly Version Interactive Discussion
Discussion
P
a
per
|
Discussion
P
a
per
|
Discussion
P
a
per
|
Discussion
P
a
per
|
sions over China among different inventories can be as large as a factor of 2.1, and the
differences of SO2anthropogenic emissions can be as large as a factor of 1.8.
VOCs species such as HCHO, ISOP, and TOL are underpredicted over CONUS, likely due to the uncertainties in the biogenic emissions from MEGAN2.1, anthro-pogenic emissions (e.g., HCHO and TOL) and the chemical reactions as well as 5
a coarse horizontal resolution used in this work. Both MOZART-4x and CB05_GE
un-derpredict BC with NMBs of−29.3 and−29.3 %, respectively. The underpredictions of
BC are likely due to the underestimations of BC emissions, as well as uncertainties in the transport and wet removal by convection (Ma et al., 2013; Wang et al., 2013; Tilmes et al., 2015).
10
OC is slightly overpredicted with an NMB of 2.1 % by MOZART-4x over CONUS,
whereas it is moderately underpredicted with an NMB of−20.7 % by CB05_GE. OC
is evaluated against observations at the IMPROVE sites, and SOA dominates OC at these sites for both simulations with MOZART4-x and CB05_GE, with SOA/OC ratios of 83.0 and 59.6 %, respectively. Although no SOA measurements are available from 15
IMPROVE for evaluation, the differences in OC predictions can be attributed to the
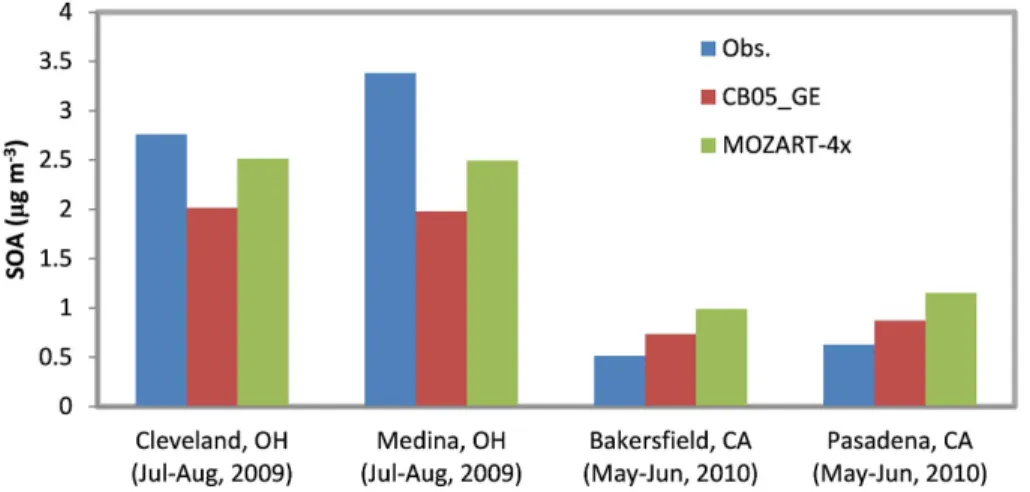
dif-ferences in SOA predictions because of dominances of SOA in total OC. Compared to the SOA observations at the four sites in the US from Lewandowski et al. (2013),
MOZART-4x underpredicts SOA by 0.03 µg m−3 (or by 1.9 %), whereas CB05_GE
un-derpredicts SOA by 0.4 µg m−3 (or by 23.1 %). Note that the SOA statistics are
cal-20
culated using only four pairs of seasonal mean values at four sites in the US where the observed SOA data are available during 2008–2010; they therefore may not be representative because of limited data used for calculation. Figure 2 compares simu-lated and observed SOA concentrations at the four sites. MOZART-4x predicts higher SOA than CB05_GE at all four sites, which reduces underpredictions at Cleveland and 25
Medina, OH but increases overpredictions at Bakersfield and Pasadena, CA. This in-dicates a better capability of MOZART-4x to simulate SOA at sites with relatively high
SOA concentrations (≥1 µg m−3) compared to CB05_GE despite its tendency of
GMDD
8, 7189–7247, 2015CESM/CAM5 improvement and
application
J. He et al.
Title Page
Abstract Introduction
Conclusions References
Tables Figures
◭ ◮
◭ ◮
Back Close
Full Screen / Esc
Printer-friendly Version Interactive Discussion
Discussion
P
a
per
|
Discussion
P
a
per
|
Discussion
P
a
per
|
Discussion
P
a
per
|
by MOZART-4x can be attributed to the higher OH levels and higher biogenic emis-sions in MOZART-4x. However, the concentration of OC is largely underpredicted by
both MOZART-4x and CB05_GE over Europe, with NMBs of −74.2 and−75.1 %,
re-spectively, indicating the uncertainties in the emissions of SOA precursors and SOA formation treatment. For example, the aqueous-phase oxidation of VOCs in clouds is 5
not taken into account in this work, which, however, can contribute several percent-ages of SOA in some areas and seasons over Europe (Couvidat et al., 2013). The hydrocarbon-like organic aerosol (HOA) predicted by MOZART-4x and CB05_GE cor-related well with the observations at 33 sites in the Northern Hemisphere (e.g., with
correlation coefficients of 0.93 for both simulations) but the amount is largely
underpre-10
dicted by both MOZART-4x and CB05_GE, with NMBs of−77.2 and−76.7 %,
respec-tively, indicating that the POA may be too volatile with the implementation currently in the model. Oxygenated organic aerosol (OOA), which is roughly equivalent to the sum of SOA and SVOA, is also largely underpredicted at the 33 sites by both MOZART-4x
and CB05_GE, with NMBs of−56.5 and−62.3 %, respectively. This is mainly due to
15
the uncertainties in the oxidation rate and fragmentation rates as well as SOA forma-tion treatment. The underpredicforma-tions of HOA and OOA result in an underpredicforma-tion of
total organic aerosol (TOA) by both MOZART-4x and CB05_GE, with NMBs of−67.8
and−71.2 %, respectively.
4.1.2 Satellite evaluation
20
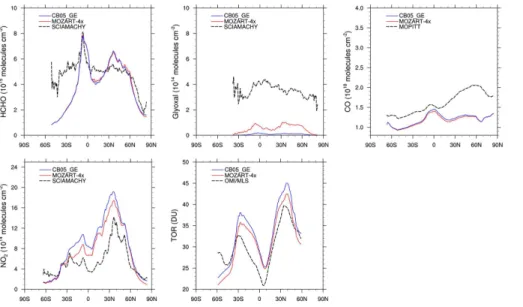
Figure 3 shows the zonal mean of column concentrations of CO, HCHO, glyoxal, NO2,
and TOR for June, July, and August during 2008–2010. In general, MOZART-4x and CB05_GE predict similar zonal mean profiles of these species. Both MOZART-4x and CB05_GE underpredict column CO, due to a significant underestimation of CO emis-sions (Tilmes et al., 2015) and uncertainties in OH predictions. During summer, column 25
HCHO is overpredicted over middle latitudes (30–60◦N) in the Northern Hemisphere
and tropical regions (0–10◦S) in the Southern Hemisphere, while it is largely
GMDD
8, 7189–7247, 2015CESM/CAM5 improvement and
application
J. He et al.
Title Page
Abstract Introduction
Conclusions References
Tables Figures
◭ ◮
◭ ◮
Back Close
Full Screen / Esc
Printer-friendly Version Interactive Discussion
Discussion
P
a
per
|
Discussion
P
a
per
|
Discussion
P
a
per
|
Discussion
P
a
per
|
to the uncertainties in the emissions of HCHO and its precursors as well as pathways for secondary HCHO formation. Both MOZART-4x and CB05_GE underpredict column glyoxal, with more underpredictions in CB05_GE. The underpredictions of glyoxal are mainly due to the uncertainties in the glyoxal chemical production and removal (Knote et al., 2014b). Several studies indicate that aromatics, isoprene, and ethyne are the ma-5
jor contributors to glyoxal formation (Washenfelder et al., 2011; Knote et al., 2014b). In MOZART-4x, glyoxal can be produced from photolysis of the oxidation products of toluene, and oxidation products of aromatics (e.g., benzene, toluene, and xylenes), iso-prene, and ethyne. CB05_GE does not include pathways for glyoxal production through photolysis, but includes glyoxal production from oxidation of alkenes (e.g., OLE, IOLE, 10
ethene, and ISOP) and aromatics (e.g., toluene and xylenes). Uncertainties in the emissions of these precursors and the production pathways can propagate into the predicted glyoxal concentrations. MOZART-4x includes additional pathways for glyoxal production through photolysis and improved treatments for glyoxal production from ad-ditional oxidized VOCs (e.g., benzene) products (Knote et al., 2014b), which can result 15
in higher glyoxal than in CB05_GE. The major chemical loss of glyoxal includes pho-tochemical loss and oxidation by OH. The uncertainties in OH levels can propagate into glyoxal predictions as well. In addition, CB05_GE includes an additional pathway for glyoxal loss through its uptake by aerosols, which is not included in MOZART-4x. This can explain in part the lower glyoxal concentrations predicted by CB05_GE than 20
by MOZART-4x. An advanced treatment for glyoxal formation should be therefore
de-veloped in the future. Both MOZART-4x and CB05_GE overpredict column NO2, likely
due to the uncertainties in the NO2 aircraft emissions and overpredictions of lightning
NOx. The lightning NOx emissions are calculated online (i.e., 6.2 and 6.4 TgN yr
−1
in
CB05_GE and MOZART-4x, respectively), which is about 1.2–2.2 TgN yr−1higher than
25
that in Lamarque et al. (2012) and Tilmes et al. (2015). Tilmes et al. (2015) have shown
that increased lightning NOx emissions in CAM-chem can lead to an increase in OH
levels and therefore a decrease in the lifetime of methane and an underestimation of
GMDD
8, 7189–7247, 2015CESM/CAM5 improvement and
application
J. He et al.
Title Page
Abstract Introduction
Conclusions References
Tables Figures
◭ ◮
◭ ◮
Back Close
Full Screen / Esc
Printer-friendly Version Interactive Discussion
Discussion
P
a
per
|
Discussion
P
a
per
|
Discussion
P
a
per
|
Discussion
P
a
per
|
those in MOZART-4x are likely due to additional NO2 production from the reactions
of VOCs with NO3 radical in CB05_GE (e.g., reactions of NO3 with OLE, IOLE, and
ethene). The zonal-mean distribution of summer TOR from CB05_GE is similar to that
from MOZART-4x. TOR is overpredicted over 40◦S–50◦N, and underpredicted over
40–60◦S. The higher TOR from CB05_GE is mainly due to higher O3production from
5
higher NO2and lower O3loss from lower OH in CB05_GE than in MOZART-4x.
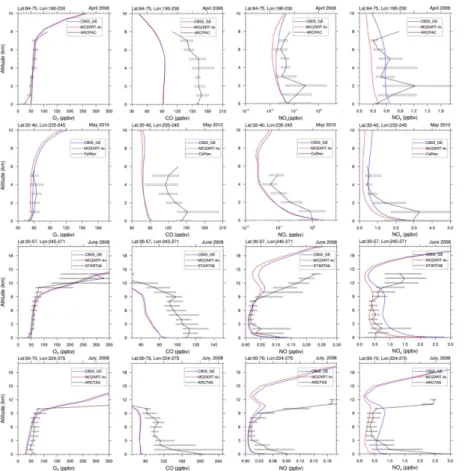
4.1.3 Vertical profile evaluation
Figure 4 compares the vertical profiles of major gases against the aircraft observations (i.e., ARCPAC, ARCTAS, START08, and CalNex). Compared with aircraft
measure-ments, MOZART-4x and CB05_GE predict similar O3and CO profiles, whereas there
10
are large differences in NOx (above 9 km) and NOy profiles (below 12 km). O3
pro-files from MOZART-4x and CB05_GE overall agree well with aircraft measurements,
although O3is slightly overpredicted near the surface. As discussed previously, the
sig-nificant underpredictions of CO profiles in both MOZART-4x and CB05_GE are mainly due to the underestimations of CO biomass burning emissions and uncertainties in OH 15
predictions. Both MOZART-4x and CB05_GE underpredict the vertical concentrations
of NOxat higher altitudes (e.g., above 9 km in ARCTAS and STRAT08), with a slightly
better agreement in CB05_GE than in MOZART-4x. The concentrations of NOx near
the surface are slightly overpredicted by both simulations. The underpredictions of the
concentrations of NOx at higher altitudes are likely due in part to the uncertainties
20
in the NOx emissions, the chemical reactions of nitrogen cycles (e.g., heterogeneous
reactions of NO2, NO3, and N2O5 over the surface of aerosol particles), the
convec-tion scheme, as well as the aircraft campaign data. Some field campaigns (e.g., ARC-PAC) focus on the polluted regions with a significant contribution from biomass burning and local sources (Tilmes et al., 2015). The underestimations of emissions from these 25
sources and uncertainties in the vertical mixing scheme can result in the
underpre-dictions of their profiles. NOy includes all the reactive nitrogen species. The simulated
ARC-GMDD
8, 7189–7247, 2015CESM/CAM5 improvement and
application
J. He et al.
Title Page
Abstract Introduction
Conclusions References
Tables Figures
◭ ◮
◭ ◮
Back Close
Full Screen / Esc
Printer-friendly Version Interactive Discussion
Discussion
P
a
per
|
Discussion
P
a
per
|
Discussion
P
a
per
|
Discussion
P
a
per
|
TAS, and CalNex than those from MOZART-4x, whereas MOZART-4x predicts slightly
better NOy profile against START08 in the lower troposphere than CB05_GE. Figure 5
compares the vertical profile of simulated CCN against the aircraft observations from CCN_China. Both MOZART-4x and CB05_GE slightly overpredict CCN (at supersatu-ration of 0.2 %) profile over Beijing area, with less overpredictions in MOZART-4x. 5
4.2 Column comparisons
Figure 6a and b compares the column mass abundance of major gaseous and aerosol species simulated by MOZART-4x and CB05_GE. As shown in Fig. 6a, column CO
pre-dicted by MOZART-4x is about 2.4×10²⁰m−2(or by 2.3 %) lower than that by CB05_GE
in the global mean. The different column CO concentrations are due to different
path-10
ways for chemical production and loss of CO and different OH levels between
MOZART-4x and CB05_GE. The chemical production of CO is mainly from photolysis and oxida-tion of VOCs species, and the chemical loss of CO is mainly from the oxidaoxida-tion by OH.
Different concentrations of VOCs species can result in different chemical production
of CO. Meanwhile, the only chemical loss of CO in CB05_GE is the oxidation of CO 15
by OH, which produces HO2 and CO2. Higher OH levels in MOZART-4x can result in
more CO loss. MOZART-4x includes an additional loss pathway of CO oxidized by OH
to produce CO2 and H. As a result, the combined rate constant for both pathways of
CO oxidation by OH in MOZART-4x is about 4 % higher than in CB05_GE. All these
differences result in 2301 and 2265 Tg yr−1 chemical loss of CO in MOZART-4x and
20
CB05_GE, respectively.
The global mean differences in the simulated column concentrations of SO2 and
NH3 between MOZART-4x and CB05_GE are 2.0×10
18
m−2 (or by 12.5 %) and
1.9×10¹⁷m−2 (or by 3.1 %), respectively. The lower column abundance of SO2 in
CB05_GE is mainly due the additional pathway for SO2 loss through oxidation by O3
25
over the surface of dust particles, which is not include in MOZART-4x. This pathway can
GMDD
8, 7189–7247, 2015CESM/CAM5 improvement and
application
J. He et al.
Title Page
Abstract Introduction
Conclusions References
Tables Figures
◭ ◮
◭ ◮
Back Close
Full Screen / Esc
Printer-friendly Version Interactive Discussion
Discussion
P
a
per
|
Discussion
P
a
per
|
Discussion
P
a
per
|
Discussion
P
a
per
|
form NH+4 which can neutralize additional SO24−, resulting in lower column abundance of
NH3in CB05_GE. Both column concentrations of NOx and NOy from MOZART-4x are
about 9.4×10¹⁷m−2(or by 9.5 %) and 3.6×10¹⁹m−2(or by 46.3 %) lower than that from
CB05_GE. The higher NOxin CB05_GE is mainly due to the lower OH available for the
chemical loss through the reaction of NO2with OH. NOy in MOZART-4x includes NOx,
5
nitrate radical (NO3), nitrogen pentoxide (N2O5), HNO3, peroxynitric acid (HO2NO2),
chlorine nitrate (ClONO2), bromine nitrate (BrONO2), peroxyacetyl nitrate (PAN),
or-ganic nitrate (ONIT), methacryloyl peroxynitrate (MPAN), peroxy radical from the
re-action of NO3 with ISOP (ISOPNO3), and lumped isoprene nitrate (ONITR), whereas
NOy in CB05_GE includes NOx, NO3, N2O5, HNO3, HO2NO2, ClONO2, BrONO2,
ni-10
trous acid (HONO), PAN, higher peroxyacyl nitrates (PANX), and organic nitrate (NTR).
The reactions for reactive nitrogen species are different in MOZART-4x and CB05_GE,
resulting in different NOy predictions.
The tropospheric column O3 from MOZART-4x is about 1.5 DU (or by 4.7 %) lower
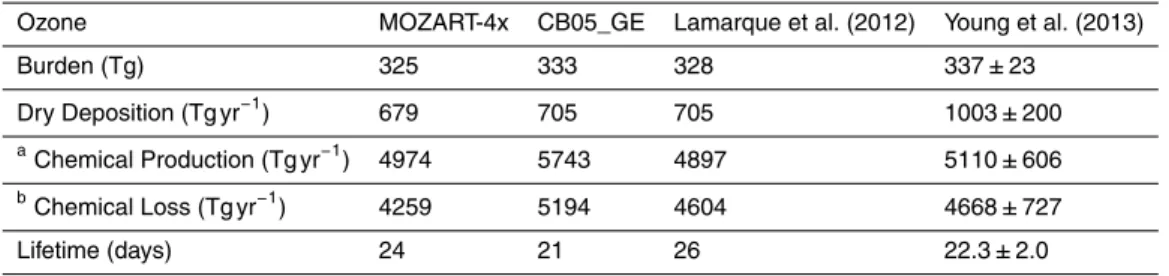
than that from CB05_GE. Table 4 shows the tropospheric O3 budget from
MOZART-15
4x and CB05_GE. The burdens of tropospheric O3 from MOZART-4x and CB05_GE
are 325 and 333 Tg, respectively, which is comparable to the previous studies using
CAM (Lamarque et al., 2012; Young et al., 2013). The O3 burden from MOZART-4x
in this work is about 12 Tg (or 3.8 %) higher than that in Tilmes et al. (2015), which is mainly due to the additional kinetic reactions included in this version of MOZART-4x. 20
The dry deposition flux of O3 from MOZART-4x is 679 Tg yr−1, which is about 3.7 %
lower than that from CB05_GE (i.e., 705 Tg yr−1). The lower O3 dry deposition flux is
mainly due to the lower O3concentration simulated by MOZART-4x. The O3 chemical
production and loss from CB05_GE and MOZART-4x are roughly within the range of
Young et al. (2013). The O3 chemical production from MOZART-4x is comparable to
25
that of Lamarque et al. (2012), but the O3chemical production from CB05_GE is about
12.8 % higher than Lamarque et al. (2012). In this table, chemical production is calcu-lated mainly from reactions of NO with peroxy radicals and chemical loss is calcucalcu-lated
GMDD
8, 7189–7247, 2015CESM/CAM5 improvement and
application
J. He et al.
Title Page
Abstract Introduction
Conclusions References
Tables Figures
◭ ◮
◭ ◮
Back Close
Full Screen / Esc
Printer-friendly Version Interactive Discussion
Discussion
P
a
per
|
Discussion
P
a
per
|
Discussion
P
a
per
|
Discussion
P
a
per
|
vapor (H2O) and from the reactions of O3 with the HO2, OH, and alkenes. Different
peroxy radicals and alkenes treated and different reaction rates used in the two
mech-anisms can contribute to the different chemical production and chemical loss of O3.
The O3lifetime is calculated based on the ratio of O3 burden to the total O3loss (dry
deposition+chemical loss). The O3lifetime from CB05_GE is comparable to those
re-5
ported by Young et al. (2013), and the O3 lifetime from MOZART-4x is comparable to
those reported by Lamarque et al. (2012) and Tilmes et al. (2015).
Column concentrations of OH, HCHO, and ISOP from MOZART-4x are higher than
CB05_GE, with global mean values of 9.7×10¹³m−2(or by 0.8 %), 3.5×10¹⁷m−2(or by
1.3 %), and 1.1×10¹⁸m−2(or by 25.6 %), respectively. The higher column
concentra-10
tions of OH and HCHO are likely due to the photolysis of more peroxide species, better
HOx recycling, and higher precursors for secondary HCHO (e.g., ISOP) in
MOZART-4x. MOZART-4x includes detailed organic peroxide species, whereas in CB05_GE, all the organic peroxide species are lumped into one species (i.e., ROOH). The
uncertain-ties in HOx recycling in CB05_GE can also result in uncertainties in OH predictions.
15
The higher ISOP is mainly due to higher biogenic emissions and less chemical loss in MOZART-4x than that in CB05_GE. In MOZART-4x, the chemical loss of ISOP is
mainly from the oxidation of ISOP by OH, O3, and NO3. However, in CB05_GE, the
chemical loss of ISOP includes not only the oxidation of ISOP by OH, O3, and NO3,
but also the consumption of ISOP by atomic oxygen (i.e., O), NO2, and chlorine (Cl).
20
As shown in Fig. 6b, the differences in the domain average column mass
abun-dances of most aerosol species (e.g., NH+4, BC, Cl−, and POA) between MOZART-4x
and CB05_GE are within±0.02 mg m−2. The differences in the column SO24−vary from
−25.2 to 0.4 mg m−2, with the global mean of−0.2 mg m−2. The simulated column
con-centrations of SO24− from MOZART-4x are much lower than those from CB05_GE over
25
East Asia, western Europe, and Middle Africa. SO2 can be oxidized by O3 to form
SO24−on the surface of dust particles in CB05_GE, which explains additional formation
GMDD
8, 7189–7247, 2015CESM/CAM5 improvement and
application
J. He et al.
Title Page
Abstract Introduction
Conclusions References
Tables Figures
◭ ◮
◭ ◮
Back Close
Full Screen / Esc
Printer-friendly Version Interactive Discussion
Discussion
P
a
per
|
Discussion
P
a
per
|
Discussion
P
a
per
|
Discussion
P
a
per
|
and magnitudes in the column concentrations of NH+4 are similar to those of SO24−over
land areas, which is associated with thermodynamic equilibrium. The column
concen-trations of NO−3 simulated by MOZART-4x are higher over East Asia, India, and Europe
than those by CB05_GE, which is mainly due to its competition with SO24− in forming
ammonium salts in the particulate phase in those regions where the column NH3
con-5
centrations are high (Fig. 6a). Dust emissions are very sensitive to the wind speed. Slightly changes in wind speed can result in significant change in dust emissions, thus, dust concentrations.
The column concentrations of SOA predicted by MOZART-4x are about 0.18 mg m−2
(or by 8.4 %) higher than those predicted by CB05_GE. The higher SOA column con-10
centrations are mainly over most continental areas in the middle and low latitudes. The SOA mainly includes biogenic SOA, anthropogenic SOA, and semi-volatile SOA. The
differences of SOA are mainly due to the higher BVOCs emissions and higher OH levels
in MOZART-4x than in CB05_GE. Different branching ratios used in MOZART-4x and
CB05_GE can also contribute to the different SOA predictions. MOZART-4x includes
15
explicit species and more types of precursors for alkylperoxy radicals (RO2), and
dif-ferent reaction rate constants for different reactions, whereas in CB05_GE, all oxidized
VOCs are lumped as one species (i.e., RO2) and branching ratios are estimated based
on the only three reactions (i.e., reactions of RO2 with NO, HO2, and RO2). These
differences can contribute to the differences in the estimation of branching ratios, and
20
therefore, affect the partitioning between organic gas and aerosols through the 1.5 D
VBS treatment implemented in CAM5-NCSU.
4.3 SOA comparisons
Figure 7 shows the contributions to total SOA (TSOA) concentrations from anthro-pogenic sources (ASOA), biogenic sources (BSOA), glyoxal (GLSOA), and semi-25
GMDD
8, 7189–7247, 2015CESM/CAM5 improvement and
application
J. He et al.
Title Page
Abstract Introduction
Conclusions References
Tables Figures
◭ ◮
◭ ◮
Back Close
Full Screen / Esc
Printer-friendly Version Interactive Discussion
Discussion
P
a
per
|
Discussion
P
a
per
|
Discussion
P
a
per
|
Discussion
P
a
per
|
predicted by MOZART-4x and CB05_GE are about 17–44, and 10–47 %, respectively, with South America the least and East Asia the most. The contributions of BSOA to TSOA predicted by MOZART-4x and CB05_GE are about 31–75, and 26–76 %, re-spectively, with East Asia the least and South America the most. The contribution of GLSOA to TSOA predicted by CB05_GE is about 2–6 %. CB05_GE used in this 5
work includes a simple conversion of glyoxal to condensable VOCs, which can be up-taken by preexisting particles to form SOA. However, this conversion is not included in MOZART-4x. Therefore, there is no GLSOA predicted by MOZART-4x despite it dicts higher glyoxal as shown in Fig. 3. The contributions of SVSOA to TSOA pre-dicted by MOZART-4x and CB05_GE are about 8–37, and 8–41 %, respectively, with 10
South America the least and South Africa the most. Among four types of SOA, both MOZART-4x and CB05_GE predict BSOA as the main contributor over most regions (e.g., Australia, North America, South Africa, and South America) and ASOA as the main contributor over East Asia, which is mainly due to the much higher anthropogenic
emissions over East Asia. Europe is a different example. MOZART-4x predicts BSOA
15
as the top contributor (44 %) and ASOA as the second largest contributor (40 %), whereas CB05_GE predicts ASOA as the top contributor (45 %) and BSOA as the second largest contributor (36 %). Both MOZART-4x and CB05_GE predict ASOA as the top contributor (46–59 %) for spring, fall, and winter, and BSOA as the top contrib-utor (57 and 47 %, respectively) for summer over Europe. Since MOZART-4x predicts 20
higher BSOA than CB05_GE, BSOA is dominant in MOZART-4x on the annual aver-age. The higher BSOA from MOZART-4x than CB05_GE is mainly due to the higher BVOCs emissions and higher OH levels in MOZART-4x. The total BVOCs emission in MOZART-4x is about 2.5×10⁻³kg m−2yr−1, which is about 7.2×10⁻⁵kg m−2yr−1 (or 2.9 %) higher than CB05_GE. The higher BVOCs emissions in MOZART-4x are 25
mainly due to the different species mapping for MEGAN emission calculations. The
differences of SOA from biogenic alkenes between MOZART-4x and CB05_GE are
GMDD
8, 7189–7247, 2015CESM/CAM5 improvement and
application
J. He et al.
Title Page
Abstract Introduction
Conclusions References
Tables Figures
◭ ◮
◭ ◮
Back Close
Full Screen / Esc
Printer-friendly Version Interactive Discussion
Discussion
P
a
per
|
Discussion
P
a
per
|
Discussion
P
a
per
|
Discussion
P
a
per
|
species and CAM-chem sums them up to map with the MOZART mechanism species. For example, MYRC emissions consist of myrcene and ocimene, BCARY emissions consist of beta-caryophyllene, alpha-bergamotene, beta-bisabolene, beta-farnescene, and alpha-humulene, and LIMON emissions consist of limonene, phellandrene, and terpinene. Therefore, the biogenic emissions for more types of VOCs in MOZART-4x 5
are higher than those in CB05_GE, resulting in higher BSOA in MOZART-4x. The dif-ferences in SOA from aromatics between MOZART-4x and CB05_GE are BENZENE in MOZART-4x and PAH in CB05_GE (as shown in Table 1). The emissions of PAH are higher over Europe, East Asia, eastern US, and South Africa. The benzene emis-sions are about 1 order of magnitude higher than the emisemis-sions of PAH, and the rate 10
constant of the oxidation of benzene by OH is temperature dependent whereas it is constant for oxidation of PAH by OH. In addition, OH levels are higher in MOZART-4x
than those in CB05_GE. These differences could result in different ASOA between two
simulations. Both MOZART-4x and CB05_GE predict higher SVSOA contributions over South Africa than other regions, which is mainly due to the higher POA emissions (e.g., 15
biomass burning) over this region.
Although the percentage contributions of different types of SOA predicted by
MOZART-4x and CB05_GE are similar over most regions, the absolute mass
con-centrations of different types of SOA are different. For example, TSOA predicted by
MOZART-4x is about 0.02–2.0 mg m−2 higher than by CB05_GE over these regions.
20
ASOA predicted by MOZART-4x is about 0.068–1.017 mg m−2 higher than predicted
by CB05_GE over most regions except Europe (0.054 mg m−2 lower) and East Asia
(0.062 mg m−2 lower). BSOA predicted by MOZART-4x is about 0.162–1.365 mg m−2
higher than predicted by CB05_GE over most regions except Australia (0.003 mg m−2
lower). MOZART-4x includes SOA formation from benzene, which can predict higher 25
ASOA formation. In addition, OH predicted by MOZART-4x is higher than CB05_GE (see Fig. 6a), which can produce more condensable SOA gaseous precursors through
map-GMDD
8, 7189–7247, 2015CESM/CAM5 improvement and
application
J. He et al.
Title Page
Abstract Introduction
Conclusions References
Tables Figures
◭ ◮
◭ ◮
Back Close
Full Screen / Esc
Printer-friendly Version Interactive Discussion
Discussion
P
a
per
|
Discussion
P
a
per
|
Discussion
P
a
per
|
Discussion
P
a
per
|
ping for MEGAN species can also contribute to the higher BSOA formation in MOZART-4x.
4.4 Evaluations of cloud/radiative predictions
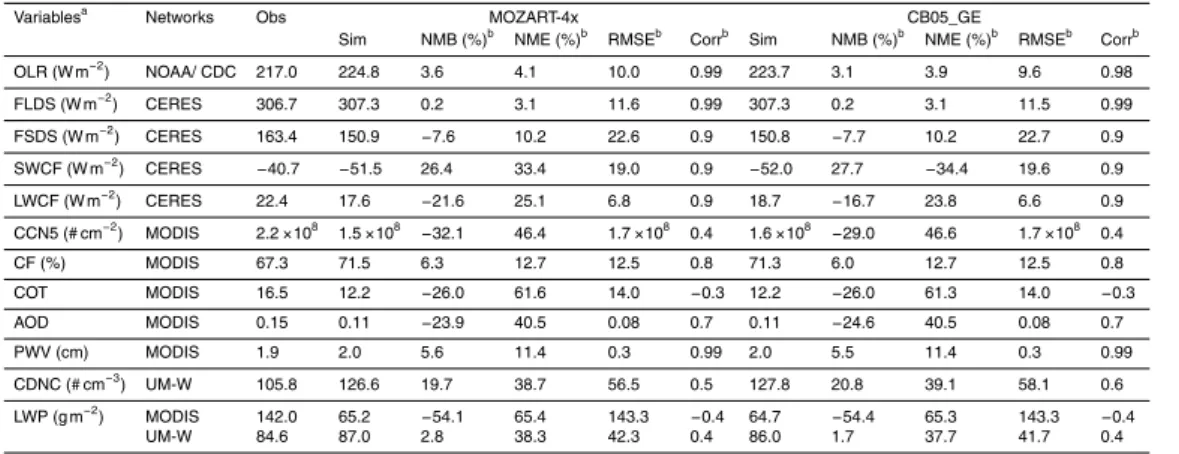
Table 5 shows the statistical performance for major cloud/radiative variables for MOZART-4x and CB05_GE simulations. Radiative variables such as OLR, FSDS, and 5
FLDS show excellent agreement with observations, with NMBs within±8 % for both
simulations. However, SWCF is overpredicted by both MOZART-4x and CB05_GE, with NMBs of 26.4 and 27.7 %, respectively, and LWCF is underpredicted by both
MOZART-4x and CB05_GE, with NMBs of−21.6 and−16.7 %, respectively. All predicted
radia-tive variables show high correlation with observations, with correlation coefficients of
10
0.9 to 0.99. CF is well predicted by MOZART-4x, with an NMB of 6.3 %, whereas CCN5, CDNC, COT, and LWP are moderately overpredicted or underpredicted, with NMBs of
−32.1, 19.7, −26.0, and 2.8 %, respectively. The performance of cloud variables is
similar in CB05_GE, with NMBs of 6.0,−29.0, 20.8, −26.0, and 1.7 % for CF, CCN5,
CDNC, COT, and LWP, respectively. AOD is also underpredicted by both MOZART-4x 15
and CB05_GE, with NMBs of−23.9 and−24.6 %, respectively.
Figure 8 shows the Taylor diagram (Taylor, 2001) comparing the model performance of MOZART-4x with that of the CB05_GE for cloud and radiative predictions. The sim-ilarity between the two patterns is quantified in terms of their correlations (i.e., angle),
their standard deviations (i.e.,y axis), and the ratio of their variances (i.e., x axis). In
20
general, the performance of major cloud/radiative variables between MOZART-4x and
CB05_GE are similar. The major differences in the performance of cloud/radiative
vari-ables between MOZART-4x and CB05_GE are the variances of CCN5, CDNC, and SWCF, which is mainly due to the predicted aerosol distributions (see Fig. 6b). The larger deviation of COT and LWP from observations (i.e., the two points located out-25