ACPD
14, 11343–11392, 2014BC and PM2.5in
Central Asia
S. Kulkarni et al.
Title Page
Abstract Introduction
Conclusions References
Tables Figures
◭ ◮
◭ ◮
Back Close
Full Screen / Esc
Printer-friendly Version
Interactive Discussion
Discussion
P
a
per
|
D
iscussion
P
a
per
|
Discussion
P
a
per
|
Discuss
ion
P
a
per
Atmos. Chem. Phys. Discuss., 14, 11343–11392, 2014 www.atmos-chem-phys-discuss.net/14/11343/2014/ doi:10.5194/acpd-14-11343-2014
© Author(s) 2014. CC Attribution 3.0 License.
Atmospheric Chemistry and Physics
Open Access
Discussions
This discussion paper is/has been under review for the journal Atmospheric Chemistry and Physics (ACP). Please refer to the corresponding final paper in ACP if available.
Source sector and region contributions to
BC and PM
2.5
in Central Asia
S. Kulkarni1,*, N. Sobhani1,2, J. P. Miller-Schulze3,4, M. M. Shafer3,4,
J. J. Schauer3,4, P. A. Solomon5, P. E. Saide1, S. N. Spak6,1, Y. F. Cheng1,**, H. A. C. Denier van der Gon7, Z. Lu6, D. G. Streets8, G. Janssens-Maenhout9, C. Wiedinmyer10, J. Lantz11, M. Artamonova12, B. Chen13, S. Imashev13, L. Sverdlik13, J. T. Deminter3, B. Adhikary1,***, A. D’Allura14, C. Wei1,****, and G. R. Carmichael1,2
1
Center for Global and Regional Environmental Research, University of Iowa, Iowa City, IA
2
Department of Chemical & Biochemical Engineering, The University of Iowa, Iowa City, IA 52242, USA
3
Wisconsin State Laboratory of Hygiene, 2601 Agriculture Drive, Madison, WI 53718, USA
4
Environmental Chemistry and Technology Program, 660 North Park St, University of Wisconsin, Madison, WI 53706, USA
5
US EPA, Office of Research & Development, Las Vegas, NV 89193, USA
6
Public Policy Center, University of Iowa, 223 South Quadrangle, Iowa City, IA 52242
7
TNO, Princetonlaan 6, 3584 CB Utrecht, the Netherlands
8
Decision and Information Sciences Division, Argonne National Laboratory, Argonne, IL, USA
9
ACPD
14, 11343–11392, 2014BC and PM2.5in
Central Asia
S. Kulkarni et al.
Title Page
Abstract Introduction
Conclusions References
Tables Figures
◭ ◮
◭ ◮
Back Close
Full Screen / Esc
Printer-friendly Version
Interactive Discussion
Discussion
P
a
per
|
D
iscussion
P
a
per
|
Discussion
P
a
per
|
Discuss
ion
P
a
per
|
10
National Center for Atmospheric Research, Boulder, Colorado, USA
11
US EPA, Office of Radiation and Indoor Air, Las Vegas, NV 89193, USA
12
Institute of Atmospheric Physics, 109017 Moscow, Russia
13
Kyrgyz-Russian Slavic University, 44 Kievskaya Str., Bishkek 720000, Kyrgyzstan
14
ARIANET, via Gilino 9, 20128 Milan, Italy
*
now at: California Air Resource Board, Sacramento, CA USA
**
now at: Multiphase chemistry department, Max Planck Institute for Chemistry, Mainz 55128, Germany
***
now at: International Centre for Integrated Mountain Development (ICIMOD), GPO Box 3226, Kathmandu, Nepal
****
now at: US EPA, Atmospheric Modeling and Analysis Division, Research Triangle Park, NC USA
Received: 24 January 2014 – Accepted: 13 April 2014 – Published: 7 May 2014
Correspondence to: N. Sobhani (negin-sobhani@uiowa.edu) and G. R. Carmichael (gcarmich@engineering.uiowa.edu)
ACPD
14, 11343–11392, 2014BC and PM2.5in
Central Asia
S. Kulkarni et al.
Title Page
Abstract Introduction
Conclusions References
Tables Figures
◭ ◮
◭ ◮
Back Close
Full Screen / Esc
Printer-friendly Version
Interactive Discussion
Discussion
P
a
per
|
D
iscussion
P
a
per
|
Discussion
P
a
per
|
Discuss
ion
P
a
per
Abstract
Particulate matter (PM) mass concentrations, seasonal cycles, source sector and source region contributions in Central Asia (CA) are analyzed for the period April 2008– July 2009 using the Sulfur Transport and dEposition Model (STEM) chemical transport model and modeled meteorology from the Weather Research and Forecasting (WRF) 5
model. Predicted Aerosol Optical Depth (AOD) values (annual mean value∼0.2) in CA
vary seasonally with lowest values in the winter. Surface PM2.5concentrations (annual mean value ∼10 µg m−3) also exhibit a seasonal cycle, with peak values and largest
variability in the spring/summer, and lowest values and variability in the winter (hourly values from 2–90 µg m−3). Surface concentrations of black carbon (BC) (mean value 10
∼0.1 µg m−3) show peak values in the winter. The simulated values are compared to
surface measurements of AOD, and PM2.5, PM10, BC, organic carbon (OC) mass
con-centrations at two regional sites in the Kyrgyz Republic (Lidar Station Teplokluchenka (LST) and Bishkek). The predicted values of AOD and PM mass concentrations and their seasonal cycles are fairly well captured. The carbonaceous aerosols are under-15
predicted in winter, and analysis suggests that the winter heating emissions are under-estimated in the current inventory.
Dust, from sources within and outside CA, is a significant component of the PM mass and drives the seasonal cycles of PM and AOD. On an annual basis, the power and industrial sectors are found to be the most important contributors to the anthropogenic 20
portion of PM2.5. Residential combustion and transportation are shown to be the most
important sectors for BC. Biomass burning within and outside the region also con-tributes to elevated PM and BC concentrations. The analysis of the transport pathways and the variations in particulate matter mass and composition in CA demonstrate that this region is strategically located to characterize regional and intercontinental trans-25
ACPD
14, 11343–11392, 2014BC and PM2.5in
Central Asia
S. Kulkarni et al.
Title Page
Abstract Introduction
Conclusions References
Tables Figures
◭ ◮
◭ ◮
Back Close
Full Screen / Esc
Printer-friendly Version
Interactive Discussion
Discussion
P
a
per
|
D
iscussion
P
a
per
|
Discussion
P
a
per
|
Discuss
ion
P
a
per
|
Simulations for a reference 2030 emission scenario based on pollution abatement measures already committed to in current legislation show that PM2.5and BC
concen-trations in the region increase, with BC growing more than PM2.5 on a relative basis.
This suggests that both the health impacts and the climate warming associated with these particles may increase over the next decades unless additional control measures 5
are taken. The importance of observations in CA to help characterize the changes that are rapidly taking place in the region are discussed.
1 Introduction
Central Asia (CA), a region of republics located between Europe and Asia, faces severe environmental problems, with origins dating back to the 1960s and best symbolized by 10
the Aral Sea catastrophe (Whish-Wilson, 2002). The Aral Sea has shrunk to only about 30 % of its 1960 volume and roughly half its geographical size due to diversion of water for crop cultivation and other purposes. The resulting desertification of the lake-bed has resulted in extensive dust storms from the region, which have impacted the surrounding agriculture, ecosystem, and the population’s health.
15
The 2012Environmental Performance Index (EPI), which tracks performance of 132 countries across a variety of environmental and ecosystem vitality indicators, ranked CA countries among the weakest performers (Kazakhstan 129, Uzbekistan 130, Turk-menistan 131, Tajikistan 121, and Kyrgyzstan 101) (Emerson et al., 2012). CA and the surrounding areas are developing quickly and air pollution emissions are projected to 20
increase significantly for the next several decades (Shindell et al., 2012). In recognition of the need to improve the environmental conditions in the region five CA countries have formulated the Framework Convention on Preservation of Environment for Sus-tainable Development of CA (UNEP, 2006).
Despite the awareness of the environmental conditions, it remains an understudied 25
ACPD
14, 11343–11392, 2014BC and PM2.5in
Central Asia
S. Kulkarni et al.
Title Page
Abstract Introduction
Conclusions References
Tables Figures
◭ ◮
◭ ◮
Back Close
Full Screen / Esc
Printer-friendly Version
Interactive Discussion
Discussion
P
a
per
|
D
iscussion
P
a
per
|
Discussion
P
a
per
|
Discuss
ion
P
a
per
indicated that the major transport pathway of pollution from Europe to Asia is via low al-titude flows passing through CA. The magnitude of the pollution transport from Europe to Asia is highly uncertain in large part due to the lack of observations of pollutants along this pathway. To help better characterize the air pollution levels and the transport pathways in the region a study was undertaken between Russia, Kyrgyz Republic, and 5
USA scientists to observe and model aerosols in the region. Measurements of par-ticulate matter (PM) mass and composition were taken at two locations in the Kyrgyz Republic (Lidar Station Teplokluchenka (LST) and Bishkek) and modeling analysis was performed to assess the contributions of local, regional and distant sources to the PM concentrations in the region (Miller-Schulze et al., 2012; Chen et al., 2012, 2013). 10
In this paper we present a modeling analysis of PM2.5, PM10, (PM2.5refers to parti-cles in the size range of less than 2.5 µm aerodynamic diameter (AD) and PM10 refers
to particles in the size range of less than 10 µm AD), black carbon (BC) and organic carbon (OC) mass concentrations and aerosol optical depth (AOD) over the time pe-riod of April 2008 to July 2009. The Sulfur Transport and dEpostion Model (STEM), 15
a hemispheric chemical transport model (D’Allura et al., 2011), is used to estimate spatial and temporal variations in PM in CA, and to assess the contributions to PM from wind-blown dust, open biomass burning, and anthropogenic sources, and dif-ferent geographical source regions and source sectors (transportation, power, industry and residential). The simulated values are compared to surface measurements of AOD, 20
PM2.5, PM10, BC, OC mass concentrations at the two regional sites in CA. The
trans-port of aerosols into CA is also explored through three dimensional backward trajectory analysis. Transport from CA and their impacts on downwind areas are also analyzed via forward trajectory analysis. Finally we present results of how the PM concentra-tions may change in the future using emission scenarios for 2030 that reflect possible 25
ACPD
14, 11343–11392, 2014BC and PM2.5in
Central Asia
S. Kulkarni et al.
Title Page
Abstract Introduction
Conclusions References
Tables Figures
◭ ◮
◭ ◮
Back Close
Full Screen / Esc
Printer-friendly Version
Interactive Discussion
Discussion
P
a
per
|
D
iscussion
P
a
per
|
Discussion
P
a
per
|
Discuss
ion
P
a
per
|
2 Data and methods
2.1 Observations
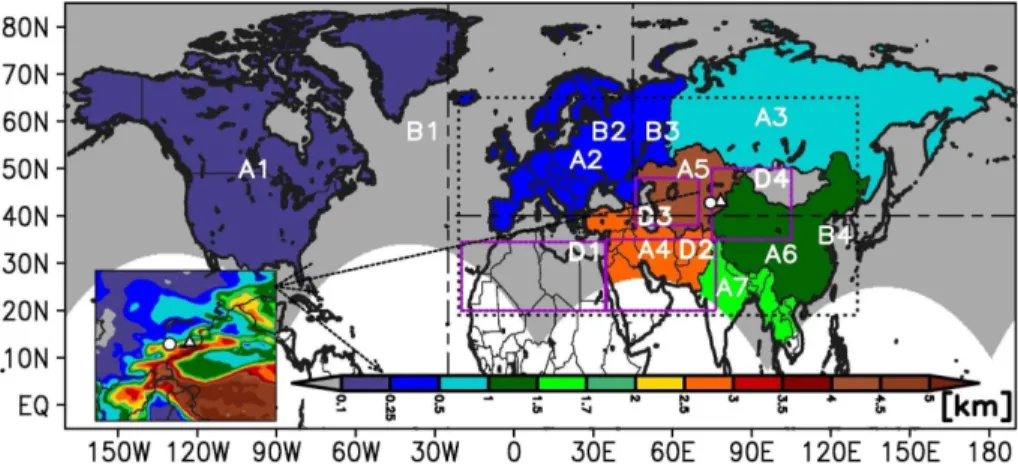
Surface observations from two sites established in the Kyrgyz Republic to measure PM concentrations and AOD in CA are used in the analysis. The locations of the Bishkek (42◦40′46.65′′N, 74◦41′38.13′′E, elevation 1743 above sea level (a.s.l.)) and 5
LST (42◦27′49.38′′N, 78◦31′44.17′′E, elevation 1921 m a.s.l.) sites are denoted by cir-cle and triangle markers, respectively, in Fig. 1. Both sampling sites are in mountain ranges with valleys to the north, with mountains that reach elevations greater than 3500 m a.s.l. south of the Bishkek site and 4600 m a.s.l. south of the LST site, and essentially no population to the south. At each site, PM2.5mass was measured
contin-10
uously with tapered element oscillating microbalance (TEOM) instruments and PM2.5,
PM10, BC, and OC were obtained using filter-based sampling with samples collected for 24 h every other day. AOD was measured every day at 10.30 a.m. local time (LT) using Microtops-II sun-photometers (SP). A stationary three wavelength aerosol Lidar measured vertical profiles of extinction and depolarization on an event basis at the 15
LST site. The Lidar vertical profiles provide information on vertical distribution of the particles, and were also used to calculate AOD from the Lidar Extinction (LE) profiles and to estimate the height of the planetary boundary layer (PBL) as described in Chen et al. (2013). These observations sites are now part of the UNEP project ABC measure-ment network (http://www.rrcap.ait.asia/abc/index.cfm). Further details of the study can 20
be found in (Miller-Schulze et al., 2011). Observations from these sites were obtained for the period April 2008 to July 2009 (the TEOM measurements were available from April 2008 and filter measurements began from 1 July 2008).
The Moderate Resolution Imaging Spectroradiometer (MODIS) collection 5.1 Level 2 AOD products (∼10 km horizontal resolution) at 550 nm wavelength from Terra and
25
ACPD
14, 11343–11392, 2014BC and PM2.5in
Central Asia
S. Kulkarni et al.
Title Page
Abstract Introduction
Conclusions References
Tables Figures
◭ ◮
◭ ◮
Back Close
Full Screen / Esc
Printer-friendly Version
Interactive Discussion
Discussion
P
a
per
|
D
iscussion
P
a
per
|
Discussion
P
a
per
|
Discuss
ion
P
a
per
(Hsu et al., 2004, 2006), which can retrieve AOD over bright and desert surfaces. This is particularly relevant for the CA region, which contains major dust sources in western China, South Asia, the Middle East, and Africa (Ginoux et al., 2001). The MODIS Level 2 to Level 3 averaging procedure outlined in Hubanks et al. (2008) was employed to interpolate the 10 km Level 2 AOD products to the 60 km horizontal model resolution 5
on a daily basis. Level 2 QA flag weightings were used to reduce the uncertainty asso-ciated with the MODIS retrievals. In grid cells where both the MODIS dark target and Deep Blue AOD were retrieved, the mean value of the two was used.
2.2 Modeling system
2.2.1 Meteorological model
10
The Weather Research and Forecasting (WRF) model (Skamarock et al., 2008) version 3.2 was used to generate the meteorological fields needed for simulating the transport patterns in the STEM model (D’Allura et al., 2011). The WRF simulations for each day were initialized using the meteorological boundary conditions obtained from National Centers for Environmental Prediction (NCEP) Final Analysis (FNL, http://rda.ucar.edu/ 15
datasets/ds083.2/). A daily 24 h spin up time for WRF was used (i.e. WRF was run for 48 h each day and the first 24 h were treated as spin up and were discarded). The STEM model simulation time period was from April 2008 to July 2009.
2.2.2 Chemical transport model
The STEM model (Carmichael et al., 2009) was used to simulate the mass of sul-20
fate, BC, OC, other primary emitted PM2.5, and other primary emitted PM10 (i.e.,
non-carbonaceous PM such as fly ash, road dust, and cement), which were simulated as a single mass component with aerodynamic diameters less than or equal 2.5 µm, and between 2.5 and 10 µm (denoted as coarse fraction), respectively and referred to in this paper as OPM2.5 and OPM10, dust (fine and coarse) and sea salt (fine and coarse).
ACPD
14, 11343–11392, 2014BC and PM2.5in
Central Asia
S. Kulkarni et al.
Title Page
Abstract Introduction
Conclusions References
Tables Figures
◭ ◮
◭ ◮
Back Close
Full Screen / Esc
Printer-friendly Version
Interactive Discussion
Discussion
P
a
per
|
D
iscussion
P
a
per
|
Discussion
P
a
per
|
Discuss
ion
P
a
per
|
Nitrate and secondary organic aerosols (SOA) were not included in the model for this application. The nitrate aerosol is estimated to be a minor component of the PM mass in CA (Baurer et al., 2007). The importance of SOA will be discussed later in the paper. The dry deposition of aerosols was modeled using the “Resistance in Series Parame-terization” (Wesely and Hicks, 2000) and wet deposition was calculated as a loss rate 5
based on the hourly precipitation calculated from the WRF model. Further details of the wet scavenging can be found in Adhikary et al. (2007). The modeled AOD at 550 nm wavelength was calculated using the simulated three dimensional aerosol distributions and species specific extinction coefficients as described in Chung et al. (2010).
2.2.3 Modeling domain
10
The STEM and WRF computation domains were identical, with a 60 km×60 km
horizon-tal resolution (249×249 horizontal grid cells) and 22 vertical layers up to 10 hPa. The
domain (Fig. 1) covered much of the Northern Hemisphere in a polar stereographic projection, centered over the Arctic region and extended to 35◦N to include the ma-jor emission regions of North America, Europe, and Asia. This modeling system has 15
been applied to simulate aerosol distributions in several field campaigns as described in D’Allura et al. (2011) and further details describing the model can be found there. STEM was initialized with a one month spin up using March 2008. Much of the analy-sis for this paper is focused on the domain denoted by the rectangle centered over CA shown in Fig. 1. This domain has large gradients in topography (insert Fig. 1), which 20
significantly impact the transport patterns in the region.
2.2.4 Air mass trajectories
The CA observation sites are impacted by dust, anthropogenic pollution, and biomass burning emissions from various source regions. To further understand the transport pathways and source region influences on the PM distributions at these sites, three di-25
ACPD
14, 11343–11392, 2014BC and PM2.5in
Central Asia
S. Kulkarni et al.
Title Page
Abstract Introduction
Conclusions References
Tables Figures
◭ ◮
◭ ◮
Back Close
Full Screen / Esc
Printer-friendly Version
Interactive Discussion
Discussion
P
a
per
|
D
iscussion
P
a
per
|
Discussion
P
a
per
|
Discuss
ion
P
a
per
site were calculated for the entire time period (April 2008–July 2009). In this trajectory analysis, we utilized the three dimensional wind fields (including u, v and w compo-nents) along with the above ground level (a.g.l.) altitude simulated by the WRF mete-orological model consistent with Dallura et al., 2011 study. These trajectories describe the general flow patterns based on wind fields alone and provide useful information 5
about the history of air mass particularly the influence of source regions over which the air mass had resided before arriving at the site of interest. Note that these trajecto-ries do not account for any other atmospheric processes such as diffusion or chemical evolution along its path (Kurata et al., 2004 and Guttikunda et al., 2005).
To understand the differences in transport patterns at the surface and aloft, and 10
to study the impact of topographic gradients in the vicinity of the sites, trajectories were initialized at different altitudes (0.1 (100 m), 0.3 (300 m) 0.5 (500 m), 1, 2, 3, and 5 km a.g.l.) at the site locations (i.e. latitude and longitude) daily every 3 h for a ten day period both backward and forward in time. The trajectories were terminated when they touched the ground, or went out of the model domain or exceeded the ten day 15
calculation period. The trajectories (at or below 1 km) were used to characterize trans-port pathways impacting the surface concentrations at these sites, which are discussed later in Sect. 3.5.
2.3 Emissions
2.3.1 Base emissions
20
Anthropogenic emissions of BC, OC, PM2.5, PM10, and SO2 were based on the
ARC-TAS emissions described in D’Allura et al. (2011), but updated with newly available information. For India and China BC, OC, and SO2 emissions from Lu et al. (2011) were utilized, and INTEX-B emissions were used for the rest of Asia (Zhang et al., 2009). For Europe, the EMEP 2008 (http://www.ceip.at/webdab-emission-database/ 25
ACPD
14, 11343–11392, 2014BC and PM2.5in
Central Asia
S. Kulkarni et al.
Title Page
Abstract Introduction
Conclusions References
Tables Figures
◭ ◮
◭ ◮
Back Close
Full Screen / Esc
Printer-friendly Version
Interactive Discussion
Discussion
P
a
per
|
D
iscussion
P
a
per
|
Discussion
P
a
per
|
Discuss
ion
P
a
per
|
(Visschedijk et al., 2009; Denier van der Gon et al., 2009). The shipping emissions came from the IIASA base year 2005 inventory (UNEP and WMO, 2011). Mass con-servative regrinding tools including MTXCALC and MTXCPLE from the IOAPI m3tools suite (http://www.baronams.com/products/ioapi/AA.html#tools) were used to interpo-late the input raw emissions described above on to the model grid.
5
Anthropogenic emissions for SO2, BC and OC were available by major economic
sectors; i.e., transportation, residential, industry, and power. The industry and power sectors were treated as small and large point sources, respectively, and emitted into the first 6 model levels (lowest 2 km). The residential and transportation emissions were treated as area sources and partitioned into the first two model levels with a 90–10 % 10
split. Monthly emission allocation factors were applied over India and China for the economic sectors from Lu et al. (2011). The rest of the domain (i.e. excluding India and China) used same emission rates for all months due to unavailability of monthly emission allocation factors.
The Fire Inventory from NCAR (FINN v1) was used for BC, OC, CO, SO2, PM2.5
15
and PM10 biomass burning emissions from forest, grassland and crop residual fires.
The FINN database, which is based on MODIS fire detection as thermal anomalies, provides global coverage of fire emissions at a spatial resolution of∼1 km on a daily
timescale (Wiedinmyer et al., 2011). The WRF-Chem fire utility (http://bai.acd.ucar. edu/Data/fire/) was employed to interpolate the speciated FINN emissions to the WRF 20
model grid. The gridded two-dimensional FINN emissions were used as input to the WRF-Chem (Grell et al., 2005) plume rise model (Grell et al., 2011), which implements the Freitas et al. (2007) and Freitas et al. (2010) algorithm to compute injection heights and to calculate the vertical distribution of fire emissions at an hourly time step, which were further utilized as input to STEM model simulations.
25
ACPD
14, 11343–11392, 2014BC and PM2.5in
Central Asia
S. Kulkarni et al.
Title Page
Abstract Introduction
Conclusions References
Tables Figures
◭ ◮
◭ ◮
Back Close
Full Screen / Esc
Printer-friendly Version
Interactive Discussion
Discussion
P
a
per
|
D
iscussion
P
a
per
|
Discussion
P
a
per
|
Discuss
ion
P
a
per
WRF output) and only grid cells with snow cover<1 % were used for dust emission calculations.
Figure 2 shows the annual gridded anthropogenic SO2 and BC, dust, and biomass
burning PM2.5emissions in Gg per grid in and around CA. Large BC emission hotspots can be seen over the Indo-Gangetic plain and eastern China. Significant BC emissions 5
are also seen over Europe, but are relatively lower in intensity than the Asian sources. The SO2 emissions show Eastern China as the largest source region followed by re-gions of South Asia, Europe, and Russia. The major natural dust emission sources (Fig. 2c) include Africa, the Middle East, CA, Western India boundaries, and Western China. The major sources of biomass burning are Eastern Europe, portions of Siberian 10
(between 40–60◦N), Southeast Asia, Southern China and India (Fig. 2d).
Dust emissions have a strong seasonal cycle. The major dust sources in the region (Fig. 1) are located to the east, west and south of the observation sites and include the cool winter deserts around the Aral and Caspian seas and those in western China and northern Pakistan as well as the sub-tropical deserts in western India, around the 15
Persian Gulf and northern Africa. The emissions from the cool winter deserts occur when the surfaces are free of snow cover (from March through October). Emissions from the sub-tropical deserts can occur throughout the year.
The open biomass burning emissions that impact CA also have a strong seasonality with minimum impact in winter (Supplement Fig. S1). Fires typically begin in the spring 20
in Siberia along 50◦N latitude and in northern India and South East Asia and in summer the high latitude burning shifts to the west. In October the fire activity decreases and remains low until spring, with the most active fire regions associated with agricultural burning in northern India and southeast China.
2.3.2 Future emissions scenarios
25
ACPD
14, 11343–11392, 2014BC and PM2.5in
Central Asia
S. Kulkarni et al.
Title Page
Abstract Introduction
Conclusions References
Tables Figures
◭ ◮
◭ ◮
Back Close
Full Screen / Esc
Printer-friendly Version
Interactive Discussion
Discussion
P
a
per
|
D
iscussion
P
a
per
|
Discussion
P
a
per
|
Discuss
ion
P
a
per
|
Anenberg et al. (2012). The reference scenario for 2030 was based on the implemen-tation of control measures currently approved in the various regions and assumed their perfect implementation. The 2030 reference scenarios were developed from a refer-ence global emissions inventory with a 2005 referrefer-ence year, and assumed significant growth in fossil fuel use relative to 2005, leading to increases in estimated CO2
emis-5
sions (45 %). Abatement measures prescribed in current legislation were projected to lead to reductions in air pollutant emissions, which varied by pollutant and region. In the 2030 reference scenario, total primary PM2.5 emissions remain approximately
constant, while BC and OC decline by a few percent. However, in the study domain emission changes varied widely. BC emissions increased by 10–100 % in CA, South 10
and Southeast Asia and in western China, and decreased in East Asia and Europe. The PM2.5 emissions showed similar regional changes but grew at smaller rates (10–
40 %). SO2 emissions generally increased throughout the region by 10–20 %. Spatial
maps of emission changes for the 2030 reference scenario are presented in Figs. S2b, S3b, and S4b.
15
A series of emission control scenarios for 2030 were developed to evaluate the im-pact of additional abatement measures designed to reduce the levels of short lived climate pollutants (e.g., BC). The BC measures in the scenarios included two different sets of assumptions (low and lowest). The first focused on reductions from incom-plete combustion sources. These included implementation of Euro 6 equivalent vehi-20
cle emission standards (requiring installation of diesel particulate filters) and improv-ing traditional biomass cook stoves in developimprov-ing countries (assumimprov-ing 25 % decrease in BC and 80–90 % decreases in OC, CO, non-methane volatile organic compounds (NMVOC), methane, and direct PM2.5, relative to emissions from traditional stoves).
Under this scenario BC and PM2.5 emissions in the study region are projected to
de-25
crease throughout most of the domain, with SO2emissions showing almost no change (see Figs. S2c, S3c, and S4c).
ACPD
14, 11343–11392, 2014BC and PM2.5in
Central Asia
S. Kulkarni et al.
Title Page
Abstract Introduction
Conclusions References
Tables Figures
◭ ◮
◭ ◮
Back Close
Full Screen / Esc
Printer-friendly Version
Interactive Discussion
Discussion
P
a
per
|
D
iscussion
P
a
per
|
Discussion
P
a
per
|
Discuss
ion
P
a
per
BC measures in the lowest scenario reduced global anthropogenic BC emissions by 75 %. Measures targeting BC also substantially reduced total primary PM2.5 (−50 %),
OC (−79 %), NOx(−27 %), and CO (−44 %). These BC measures have little impact on
SO2emissions. Projected emissions of BC and OC under these scenarios are reduced most in Asia, followed by Africa. North America, and Europe.
5
These measures were also combined with a scenario designed to stabilize green-house gases at 450 ppm of CO2 equivalent (lowest+450 ppm scenario), consistent with a global average temperature increase of∼2◦C. These CO2 measures reduced
SO2 (−30 %) (Fig. S4d) and NOx (−20 %), but had little further impact on BC (∼5 %
decline, Fig. S2d) since the major sources of CO2differ from those of BC. PM2.5 emis-10
sions were substantially further reduced under this scenario (Fig. S3d).
2.4 Simulations analyzed
Several simulations were analyzed for this paper. The base simulation included all sources and used the meteorology from the WRF model for the period April 2008– July 2009. To investigate the contributions from specific source sectors, additional sim-15
ulations were performed where emissions from one sector were set to zero everywhere. The contribution from each sector was calculated as the difference between the base simulation and the simulation with emissions from that particular sector set to zero. This was repeated for each sector and for biomass burning. Additional simulations were performed to assess the source contribution from specific regions to the particle 20
levels in CA. The specific regions used are shown in Fig. 1. In these simulations all an-thropogenic emissions were set to zero in that region. In a similar manner regional dust and fire sources were also studied and the source regions are also shown in Fig. 1. Finally, simulations were performed using thereference2005 and 2030 emissions and thelow and lowest+450 CO22030 scenarios (described above). For these runs, the
25
ACPD
14, 11343–11392, 2014BC and PM2.5in
Central Asia
S. Kulkarni et al.
Title Page
Abstract Introduction
Conclusions References
Tables Figures
◭ ◮
◭ ◮
Back Close
Full Screen / Esc
Printer-friendly Version
Interactive Discussion
Discussion
P
a
per
|
D
iscussion
P
a
per
|
Discussion
P
a
per
|
Discuss
ion
P
a
per
|
3 Results and discussion
3.1 Regional perspective
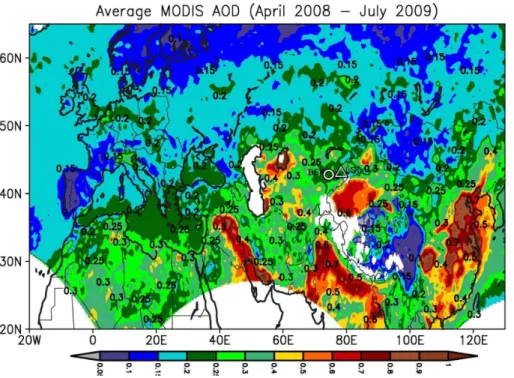
CA is a region with high aerosol loadings as shown in the mean MODIS retrieved AOD at 550 nm for the time period of study (April 2008–July 2009) (Fig. 3). AOD (period mean) throughout CA (∼45–90◦E, 35–50◦N) are greater than 0.25, with the highest
5
regional values around the desert areas near the Caspian and the Aral seas. There are also high values (>0.6) along CA’s eastern border, which reflect the deserts and rapidly developing cities in western China, and to the south over Pakistan and northern India.
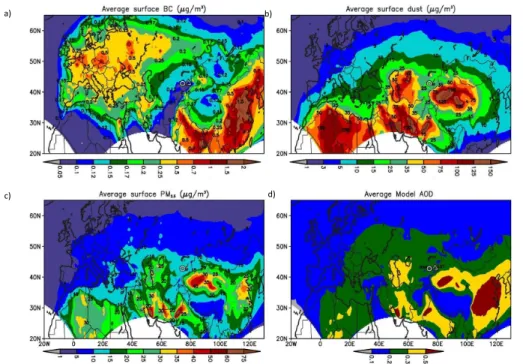
The predicted period mean AOD spatial distribution shown in Fig. 4d captures the 10
main observed features. The period-mean predicted surface concentrations of PM2.5,
BC, and total dust (fine and coarse) are also plotted. The period mean PM2.5 con-centrations in CA (10 to 35 µg m−3) have a similar geographical distribution as AOD. Dust is the major component of predicted PM10 in CA and concentrations are high
(25–100 µg m−3). The BC levels in CA are typically less than 0.3 µg m−3and its spatial 15
pattern reflects contributions from both anthropogenic and biomass burning sources.
3.2 Comparison with surface observations in CA
The surface observations at the two CA sites provide the opportunity for the first time to evaluate the performance of chemical transport models in estimating the distribution of aerosols in CA and to assess the emission estimates in the region. A comparison of 20
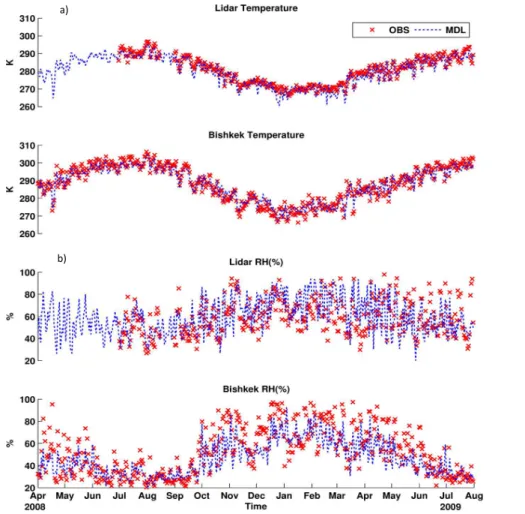
the predicted and observed meteorology is presented in Fig. 5, where the distributions of key meteorological parameters for the entire measurement period are shown as box-plots. The model accurately predicted the magnitude and variability in temperature and relative humidity. For example the model mean value of temperature and relative humidity are 279.3 K and 61.6 % in comparison to the observed values of 280.3 K and 25
ACPD
14, 11343–11392, 2014BC and PM2.5in
Central Asia
S. Kulkarni et al.
Title Page
Abstract Introduction
Conclusions References
Tables Figures
◭ ◮
◭ ◮
Back Close
Full Screen / Esc
Printer-friendly Version
Interactive Discussion
Discussion
P
a
per
|
D
iscussion
P
a
per
|
Discussion
P
a
per
|
Discuss
ion
P
a
per
in winter, see Sect. 3.4) and the direction had a southwest bias. These biases are due in part to the 60 km model grid size, which is too coarse to capture the steep gradients in topography in and around the observation sites, and to the site placement in small N– S oriented valleys. More details regarding the evaluation of the modeled meteorology can be found in the Supplement, Table S1.
5
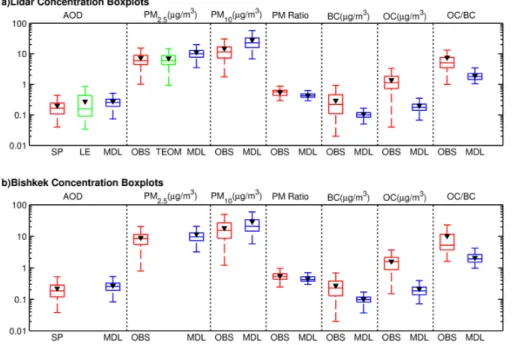
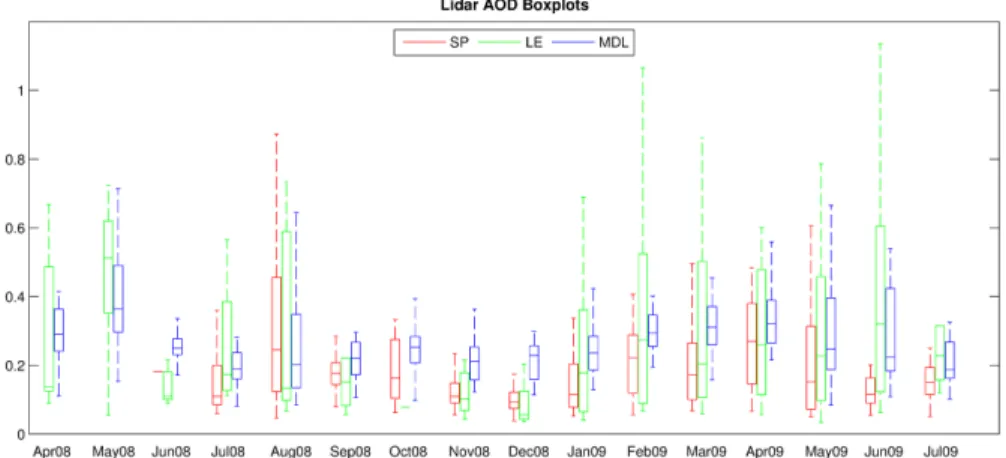
The observed and modeled distributions of AOD and PM are compared in Fig. 6. The AOD observations based on the LE on average are∼50 % larger than those from
the SP. Modeled AOD on average are∼20–30 % higher when compared to SP at the
Bishkek and LST sites and∼1 % lower when compared to the LE values. The variability
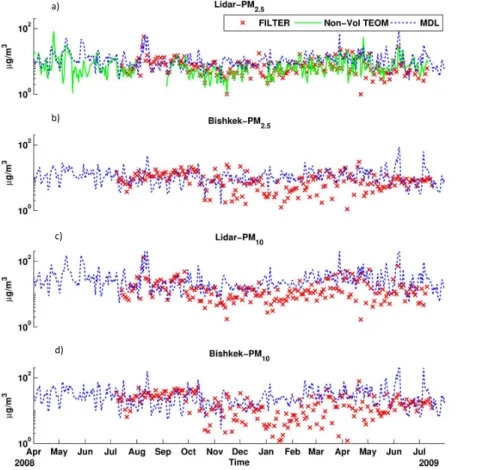
in the predictions is slightly under-estimated. PM2.5is over predicted (∼50 %) and the
10
spread is accurately captured, while PM10 is over predicted by ∼70 %. This leads to an underestimation of the PM2.5/PM10 (0.4 predicted vs. 0.5 observed) and also helps
account for the overestimation in modeled AOD (by∼20–30 %).
Chemical analysis of the filter and soil samples in the CA dust regions have been used to estimate the dust contribution to measured PM at the two sites and to help 15
identify source regions of importance (Park et al., 2014). The emission regions within CA, including around the Aral Sea, and western China were identified as the most im-portant dust sources, which is consistent with the regions identified in the simulations. Dust was estimated to comprise between 5–40 % of PM2.5mass at the LST site and to
vary by season (minimum values in winter). The observation-based estimates of dust 20
% contribution suggest that modeled dust is over predicted by∼2 times. Thus it
ap-pears that dust is a main reason for the over prediction of PM2.5 and PM10, and that
dust emission models need to be refined for CA applications.
The overestimation in PM mass at the surface could also be impacted by errors in the modeled PBL heights. The PBL height as determined by the Lidar aerosol profiles 25
ACPD
14, 11343–11392, 2014BC and PM2.5in
Central Asia
S. Kulkarni et al.
Title Page
Abstract Introduction
Conclusions References
Tables Figures
◭ ◮
◭ ◮
Back Close
Full Screen / Esc
Printer-friendly Version
Interactive Discussion
Discussion
P
a
per
|
D
iscussion
P
a
per
|
Discussion
P
a
per
|
Discuss
ion
P
a
per
|
values (Fig. 5), and this occurs in all seasons (Fig. S5). The lower PBL height in the model contributes a systematic high bias in surface concentrations driven by near sur-face emissions.
Further statistical details of the model-observation comparison can be found in the Supplement (Tables S2 and S3). The seasonal variability in the observations is dis-5
cussed in further detail later (Sect. 3.4).
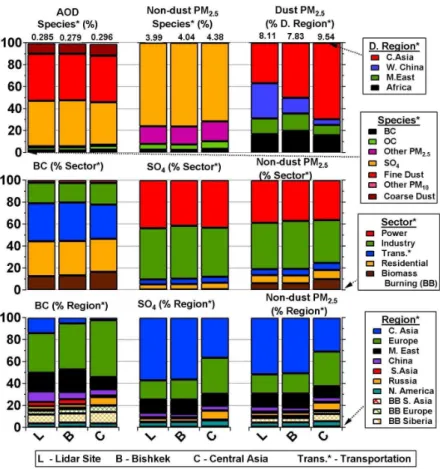
3.3 Source contributions to PM2.5
Model simulations were performed to identify the component, source region and emis-sion sector contributions to PM2.5mass. Period means for the spatial average over the
entire CA region (see Fig. 1) and for the grid cells for the Bishkek and LST observation 10
locations are presented in Fig. 7, and their comparison provides insights into the spa-tial variability of PM and its sources within CA, and how representative the observation sites are at characterizing CA PM. The component contribution to AOD at the sites and for the CA average are similar, with the major contributions coming from fine dust, sul-fate, and OC. Spatial maps of mean percent contributions of the various components 15
(i.e., BC, OC, sulfate, OPM, dust and sea salt) to AOD and PM2.5mass are presented
in Figs. S6 and S7, respectively. Coarse particles contribute ∼10 % to mean AOD.
Dust accounts for>60 % of the calculated PM2.5mass at the observation sites and for the CA region. The dust source regions (see Fig. 1) contributing to PM2.5 vary within
CA. Dust from the CA source regions has the largest influence on the region mean 20
dust-PM2.5mass. At the LST site, which is located in the far east of CA, western China dust sources have their largest influence (∼40 %). African and Middle East source
re-gions have their largest influence on the Bishkek site (20 and 15 %, respectively), and collectively contribute∼25 % to regional CA dust PM2.5.
The source region contributions to the non-dust PM2.5are very similar for the Bishkek
25
and LST sites, with CA sources making the largest contribution (∼50 %) followed by
ACPD
14, 11343–11392, 2014BC and PM2.5in
Central Asia
S. Kulkarni et al.
Title Page
Abstract Introduction
Conclusions References
Tables Figures
◭ ◮
◭ ◮
Back Close
Full Screen / Esc
Printer-friendly Version
Interactive Discussion
Discussion
P
a
per
|
D
iscussion
P
a
per
|
Discussion
P
a
per
|
Discuss
ion
P
a
per
the CA sources (∼30 % each), with larger contributions from biomass burning and
Russia sources and smaller contributions from Middle East emissions than at the ob-servation sites. The significant contribution from Europe sources reflects their large anthropogenic emissions and the general westerly transport patterns. On average the impact from South Asia sources are small. North America sources contribute between 5
3 to 7 % to PM2.5 in CA. Of the biomass burning contribution to PM2.5, the Siberian
and European fires (see Fig. 1 for fire regions) contribute 63 and 25 %, respectively, with contributions from South/Southeast Asia and North America fires each contribut-ing ∼5 %. The power and industrial sectors are identified by the simulations as the
largest contributors (∼40 % each) to non-dust PM2.5mass in CA.
10
3.4 Seasonal variations in AOD and PM at the observation sites
AOD has a seasonal cycle with the lowest values in winter and highest values in spring and summer as shown in Fig. 8 by the AOD observations at the LST site from both the SP and the LE profiles. A similar seasonal cycle was observed at the Bishkek site (not shown) and in the MODIS AOD retrievals (Fig. S8). The modeled AOD captures this 15
seasonal variation, with a tendency to over predict the values during the periods with the lowest observed AOD.
The seasonal cycles in PM2.5 (Fig. 9) and PM10 are similar to those for AOD, with minimum values in October–February. At the LST site PM2.5from both the filter based
and the non-volatile TEOM measurements are plotted. Both the observations and the 20
model find a strong similarity in the time series at the two sites.
There is also a clear seasonality in the surface meteorology in the region as shown by the time series in surface temperature and relative humidity at the two sites (Fig. 10). There are distinct temperature minima in the winter and relative humidity minima in the summer. However there is not a clear seasonality in wind speed and direction, and the 25
ACPD
14, 11343–11392, 2014BC and PM2.5in
Central Asia
S. Kulkarni et al.
Title Page
Abstract Introduction
Conclusions References
Tables Figures
◭ ◮
◭ ◮
Back Close
Full Screen / Esc
Printer-friendly Version
Interactive Discussion
Discussion
P
a
per
|
D
iscussion
P
a
per
|
Discussion
P
a
per
|
Discuss
ion
P
a
per
|
The source region and component contributions exhibit seasonal variability as shown by the modeled contributions to PM2.5 mass in Fig. 11. Dust is found to be the main driver of the seasonal cycle of PM2.5. The dust contribution to PM2.5is peak in spring
and minimum in winter (<20 %). During this time period the transport of air masses to the sites are from the west and the southwest. When the transport is from the east 5
then dust sources from western China can impact the stations. This transport pattern occurs episodically throughout the year, with contributions from western China sources as large as 20 to 50 %. The dust seasonal cycle is in turn is influenced by the seasonal variations in meteorology that drives the dust emissions and transport. The seasonal changes in the dust source regions can be seen in the seasonal spatial maps of AOD 10
(Fig. S8). Throughout the domain, AOD in the dust regions are highest in March– October and lowest in winter (Fig. S8) as the nearby dessert regions are snow covered. Biomass burning also adds to the seasonal cycle, and its contribution is minimum in the winter. South Asia sources can impact the sites in the winter time. The peri-ods when North America sources impact the site are associated with strong transport 15
events across the Atlantic and subsequent subsidence towards the surface associated with high pressure systems as they move towards CA. The transport pathways are discussed in more detail in Sect. 3.7.
3.5 Source contributions to BC
Because of its dual role as an air pollutant and as a climate warming agent there is spe-20
cial interest in understanding the regional and sector contributions to BC (Ramanathan and Carmichael et al., 2008). BC comprises on average only about 1–2 % of PM2.5 mass in CA. The period mean predicted BC surface concentrations are∼0.1 µg m−3
at the two observation sites and 0.15 µg m−3for the CA regional average. As shown in Fig. 7, European emissions contribute∼50 % to the mean BC concentrations in CA, 25
while Middle-eastern and biomass burning sources each contribute∼15–20 %.
Res-idential and transport are the most important sectors each contributing∼30 % to BC
ACPD
14, 11343–11392, 2014BC and PM2.5in
Central Asia
S. Kulkarni et al.
Title Page
Abstract Introduction
Conclusions References
Tables Figures
◭ ◮
◭ ◮
Back Close
Full Screen / Esc
Printer-friendly Version
Interactive Discussion
Discussion
P
a
per
|
D
iscussion
P
a
per
|
Discussion
P
a
per
|
Discuss
ion
P
a
per
contrast to the sector contributions to non-dust PM2.5mass, where power and industry
are the most important sectors. On average biomass burning contributes∼10 % to BC
mass, with Siberian and European fires accounting for 61 % and 33 %, respectively. The source contributions to OC are shown in Fig. S9.
There is also large seasonal variability in BC concentrations and source sec-5
tor/region contributions (Fig. 12). BC surface concentrations show the highest values in fall/winter (as do the observations), when there is maximum contribution from the residential sector, reflecting the wide-spread use of biofuels and coal for heating in the region. The source region contributions vary by season, with maximum contributions from Europe and China. South Asia sources contribute in the winter. Biomass burning 10
also is an important source of BC and plays an important role in influencing daily and seasonal variability in BC concentrations.
Predicted BC captures the seasonality and the magnitude of the spring and summer values as observed, but concentrations are biased low in the fall/winter. Median BC concentrations (and variability) are underestimated by a factor of 2 at both observation 15
sites (Fig. 6 and Tables S2 and S3). The high wind speed bias in winter (∼factor of 2),
should result in too rapid dispersion and could contribute to the negative bias, but the negative bias in the PBL heights should lead to higher predicted concentrations. Thus this negative bias is likely related to emissions (an indication of an underestimation of the heating fuel use).
20
The OC concentrations follow a similar seasonal cycle as BC and are also under predicted (Fig. 6 and Tables S2 and S3). Furthermore the OC/BC ratio is under pre-dicted by a factor of∼3 (Fig. 6). The observed OC/BC ratio follows a seasonal cycle
with values >15 in summer and ∼5 in September through April. Part of this under prediction in OC and the OC/BC ratio is due to the fact that SOA is not estimated 25
in the model. However a source contribution of OC using the filter data and chemical mass balance (CMB) approach found that SOA sources were very low in winter and only∼20 % in summer (Miller-Schulze et al., 2011). Thus SOA cannot account for the
ACPD
14, 11343–11392, 2014BC and PM2.5in
Central Asia
S. Kulkarni et al.
Title Page
Abstract Introduction
Conclusions References
Tables Figures
◭ ◮
◭ ◮
Back Close
Full Screen / Esc
Printer-friendly Version
Interactive Discussion
Discussion
P
a
per
|
D
iscussion
P
a
per
|
Discussion
P
a
per
|
Discuss
ion
P
a
per
|
regional OC primary emissions. SOA can however help account for the large values of OC/BC observed in the summer and not predicted.
Biomass burning emissions cannot account for the underestimation in winter BC and OC. The largest impact of fires at the observation sites is in the late summer, when the fires are concentrated in western Russia and the wind direction is such that the smoke 5
is transported into CA. Fires from South Asia can impact the sites associated with the fires and high pollution levels in northern India and with winds from the south, which can occur in late fall, but not frequently.
The fact that BC and OC are systematically under predicted in the winter suggests that local/regional emissions during the heating season may be underestimated. This 10
is supported by the results of the CMB analysis of OC discussed above that found the contribution from biofuel combustion increased 2–3 times in the fall and winter periods. The uncertainty in emissions can also be partly caused by the lack of seasonal emissions over this region as described earlier in Sect. 2.
3.6 Vertical distributions
15
Figure 13 shows the predicted weekly averaged vertical distributions of PM2.5, dust,
and BC for the entire simulation period at the LST site. These plots show more clearly that much of the variability in the PM loadings is associated with dust and biomass burning episodes (as represented by the enhancements in BC). Typically the high PM episodes show elevated PM mass that extend from the surface to 2 to 4 km. The vertical 20
extents show a seasonality associated with seasonal variations in the PBL heights. These vertical distributions indicate that much of the transport of aerosols in CA occurs via low altitude pathways. In some cases there are large amounts of dust and biomass burning aerosol in the 3–6 km altitude range that are decoupled from the surface (e.g., dust in early May 2009), reflecting that some aerosols are lifted out of the boundary 25
ACPD
14, 11343–11392, 2014BC and PM2.5in
Central Asia
S. Kulkarni et al.
Title Page
Abstract Introduction
Conclusions References
Tables Figures
◭ ◮
◭ ◮
Back Close
Full Screen / Esc
Printer-friendly Version
Interactive Discussion
Discussion
P
a
per
|
D
iscussion
P
a
per
|
Discussion
P
a
per
|
Discuss
ion
P
a
per
in Chen et al. (2012b). The variation in weekly averaged AOD can be significant (Fig. 13 bottom panel) and is driven by variations in dust and biomass burning emissions.
3.7 Transport pathways
The three dimensional ten day air mass trajectories (described in Sect. 2.2) were uti-lized to further understand the transport pathways of air masses entering into and ex-5
iting out of the CA region and its subsequent impact of source regions on the aerosol distributions at the CA sites.
3.7.1 Transport into CA
The air mass transport into CA is discussed through back trajectories associated with the five events labeled on Fig. 13. These five events represent transport episodes 10
with elevated surface PM2.5(averaged over the three hour time window consistent with
trajectory time step) with varying contributions from biomass burning, anthropogenic pollution, and dust sources. In each trajectory figure (Figs. 14 and 15), the regions with active dust (blue diamond hatches) and biomass burning emissions (green square hatches) for the event time period and prior ten days are identified and MODIS AOD 15
(values printed in black) overlaid. The trajectories are color coded by region to distin-guish the source impacts. The regions include: Africa (blue), Middle East (green), CA (yellow), North Asia biomass (>50◦N, black), Europe (brown), China (red) and South Asia (orange).
Figure 14 shows the first two events for August 2008. The first event in early August 20
(Fig. 13, event labeled 1) is a high dust event associated with trajectories from the west passing over the dust regions of the Aral Sea (∼45◦N, 55◦E) and eastern trajectories
passing over the Taklimakan region of western China (90–100◦E, 40◦N). These were both regions with active dust emissions as indicated by the elevated MODIS AOD val-ues. Thus the PM increases during this event were due largely to dust emitted from CA 25
character-ACPD
14, 11343–11392, 2014BC and PM2.5in
Central Asia
S. Kulkarni et al.
Title Page
Abstract Introduction
Conclusions References
Tables Figures
◭ ◮
◭ ◮
Back Close
Full Screen / Esc
Printer-friendly Version
Interactive Discussion
Discussion
P
a
per
|
D
iscussion
P
a
per
|
Discussion
P
a
per
|
Discuss
ion
P
a
per
|
ized by high levels of BC without dust. During this episode the transport to the site was under the influence of a high pressure system located to the northwest and air masses were transported over the active fire region in western Russia.
Figure 15 shows winter and spring events. The November episode (event 3) is a pe-riod with elevated BC and PM2.5 from pollution sources from South Asia (including
5
some fires) and western China and low fire and dust emission activity. The January episode (event 4) is a period of elevated BC with air masses coming from Europe, indi-cating the influence of anthropogenic pollution coming from this industrialized region, and from CA sources. Dust emissions from CA and Africa were low during this period. The final illustrative episode is for April 2009 (event 5), a period with both elevated lev-10
els of dust from western China, CA and Africa and BC from both fire and anthropogenic pollution from Europe, CA and Russia sources.
These examples provide insights into the source region contributions to PM mass in CA as presented in Figs. 11 and 12). CA is an ideal location to observe a variety of source regions as it is at the crossroad of transport patterns with air masses impacted 15
from dust, anthropogenic activity and biomass burning from different geographical re-gions.
3.7.2 Long range transport of CA sources
The transport pathways out of CA were also evaluated by calculating forward trajec-tories from the observation sites. Selected forward trajectrajec-tories initialized at or below 20
1 km are used to represent the transport of boundary layer PM from CA and these are shown for summer, winter and spring periods in Fig. 16. In these plots the MODIS AOD, dust, and fire emissions plotted for each event represent values averaged over the subsequent ten days and trajectories were stopped if they impacted the surface. During the summer, outflow from CA is towards the north in association with the sum-25
ACPD
14, 11343–11392, 2014BC and PM2.5in
Central Asia
S. Kulkarni et al.
Title Page
Abstract Introduction
Conclusions References
Tables Figures
◭ ◮
◭ ◮
Back Close
Full Screen / Esc
Printer-friendly Version
Interactive Discussion
Discussion
P
a
per
|
D
iscussion
P
a
per
|
Discussion
P
a
per
|
Discuss
ion
P
a
per
tracks and reach the higher latitudes of the Northern Hemisphere. During the winter, air mass transport out of CA is associated with the winter monsoon system and the transport pathway is over Mongolia and then over eastern China as seen in Fig. 16b. In this figure, forward trajectories that pass over the region west of 130◦E during late De-cember 2008 are shown. Figure 16c illustrates transpacific transport of CA air masses. 5
Plotted are the forward trajectories that stay within the 30–50◦N region for at least 3 days during the month of April 2009. During the spring transport from CA is dominated by strong westerly flows and air masses are transported over China, Korea, and Japan and then across the Pacific, reaching North America in 7–10 days.
PM arising from dust and anthropogenic emissions from CA impact the entire North-10
ern Hemisphere as illustrated in the hemispheric maps of seasonal average surface dust concentrations due to CA emissions only (Fig. 17). The predominant westerly flows in all seasons in the Northern Hemisphere result in the bulk of the CA emissions being transported to the west. The contribution of CA sources to surface PM concen-trations of 0.35 µg m−3 or greater covers large portions of the Northern Hemisphere, 15
including the Arctic, all of Asia, much of Europe, and portions of the continental US. There are episodic and seasonal components to the intercontinental transport as shown in the time series of the vertical profiles of PM2.5 at Mt. Bachelor, Oregon
(43.97◦N, 121.69◦W, 2700 m a.g.l.) (Fig. 18). The bulk of the CA particle transport takes place in the free troposphere and impacts surface concentrations in the US as 20
the boundary layer grows and entrains “plumes” aloft. This occurs most frequently in spring, summer and fall. The episodic contributions of CA sources to surface concen-trations can exceed 1.5 µg m−3. In the fall, there is also strong transport of dust from CA across Europe and out into the Atlantic.
3.8 Future scenarios
25
ACPD
14, 11343–11392, 2014BC and PM2.5in
Central Asia
S. Kulkarni et al.
Title Page
Abstract Introduction
Conclusions References
Tables Figures
◭ ◮
◭ ◮
Back Close
Full Screen / Esc
Printer-friendly Version
Interactive Discussion
Discussion
P
a
per
|
D
iscussion
P
a
per
|
Discussion
P
a
per
|
Discuss
ion
P
a
per
|
as described in Sect. 2. Dust and biomass burning emissions and meteorology were the same as those used in the 2008/2009 simulations. The period mean changes in surface BC and PM2.5 concentrations in 2030 for the reference scenario are shown in
Fig. 19a and d, respectively. This scenario reflects all present agreed policies affecting emissions and assumes that they are fully implemented. Under this scenario PM2.5
5
increases significantly in South Asia and western China (>50 %) and in parts of CA, including the area where the sampling sites are located. PM2.5 decreases in Western Europe and Eastern China (<10 %). BC surface concentrations show a similar pattern to PM2.5, although covering larger portions of CA with relatively larger increases in
BC than in PM2.5. These results suggest that health impacts and climate warming due 10
to BC and PM2.5 may increase in coming decades unless additional emission control measures are implemented.
Results for two other scenarios are also presented in Fig. 19. One scenario specifi-cally targets BC emission reductions in recognition that BC is also a major contributor to atmospheric warming (Ramanathan and Carmichael, 2008). These additional mea-15
sures significantly reduce 2030 BC concentrations by greater than 35 % throughout most of the domain, with only a few regions (e.g., Myanmar and eastern Afghanistan) showing increases in BC relative to 2005 levels. This scenario assumes that all BC emission reduction measures are perfectly implemented and 100 % effective. BC mea-sures also impact emissions of co-emitted pollutants (e.g., OC and SO2). PM2.5 con-20
centrations under this scenario (Fig. 19e) are reduced, but by much smaller amounts, and concentrations still increase relative to 2005 over large regions of South Asia and western China, and parts of CA. These results suggest that health impacts in these re-gions may increase due to the PM2.5increases whereas positive radiative forcing and
health effects due to BC may decrease. When the BC measures are used along with 25
ACPD
14, 11343–11392, 2014BC and PM2.5in
Central Asia
S. Kulkarni et al.
Title Page
Abstract Introduction
Conclusions References
Tables Figures
◭ ◮
◭ ◮
Back Close
Full Screen / Esc
Printer-friendly Version
Interactive Discussion
Discussion
P
a
per
|
D
iscussion
P
a
per
|
Discussion
P
a
per
|
Discuss
ion
P
a
per
this scenario, resulting in significant reductions in particulate nitrate and sulfate (e.g., a∼30 % increase in particulate sulfate in CA).
4 Summary
AOD in CA during the period April 2008 through July 2009 averaged∼0.3 and
dis-played a seasonal cycle with the lowest values in the winter and highest values in 5
spring to mid-summer with observed values of AOD>0.6 and even >0.8. Surface PM2.5 measured at two sites in eastern CA averaged∼10 µg m−3but with large
vari-ability (hourly values from 2–90 µg m−3). Surface concentrations of PM also showed a seasonal cycle with peak values and largest variability in the spring/summer, and lowest values and variability in the winter. BC at these sites averaged∼0.1 µg m−3with
10
peak values (∼1 µg m−3) in the winter.
The seasonal cycles and source sector and source region contributions to PM in CA were analyzed using the STEM chemical transport model. Dust was the largest compo-nent of the PM2.5and PM10 mass in the region in all seasons except winter, whereas
sulfate was the largest anthropogenic component of the PM2.5 mass. Dust was also
15
found to be the major driver of the seasonal cycles of AOD and PM concentrations. On an annual basis the power and industrial sectors were the most important contributors to PM2.5, while residential and transportation were the most important sectors for BC.
Open biomass burning within and outside the region also contributed to elevated PM and BC concentrations and to the temporal variability.
20
The model simulations showed a systematic over prediction of PM mass. This is most likely due in large part to the over prediction in dust. Carbonaceous PM was underpre-dicted and it is speculated that the winter emissions associated with residential heating may be underestimated in the current emissions inventory. The predicted wind speeds were biased high (by∼30 %) and the direction had a southwest bias. The high bias
25
in wind speeds may also contribute to the over-prediction in PM10, as dust emissions
ACPD
14, 11343–11392, 2014BC and PM2.5in
Central Asia
S. Kulkarni et al.
Title Page
Abstract Introduction
Conclusions References
Tables Figures
◭ ◮
◭ ◮
Back Close
Full Screen / Esc
Printer-friendly Version
Interactive Discussion
Discussion
P
a
per
|
D
iscussion
P
a
per
|
Discussion
P
a
per
|
Discuss
ion
P
a
per
|
the wind speed and direction predictions using a finer model resolution are planned. Additional efforts are needed to improve the anthropogenic emissions estimates for CA.
Currently there are few measurements in CA that can be used to quantify the in-tercontinental transport of pollution from Europe to Asia. The analysis of the transport 5
pathways and variations in PM mass and composition observed at the two sites in CA demonstrate that this region is strategically located to characterize regional and inter-continental transport of pollutants. Aerosols at these sites were shown to reflect dust, biomass burning, and anthropogenic sources from South, East, and CA, Europe, and Russia depending on the time of year. For example, during the spring fine particles 10
from Europe and Africa were transported to CA, on to eastern Asia, and then across the Pacific to North America.
Observations of PM and its composition in this region are of growing importance as it is estimated that PM2.5 levels are likely to increase significantly in Central and South Asia and western China over the next few decades. Simulations for a reference 15
2030 emission scenario showed that BC concentrations had a larger relative increase than PM2.5 concentrations. This suggests that health impacts and climate warming associated with these pollutants may increase over the next decades unless additional control measures are implemented. Continued pollutant observations in CA will help to characterize the changes that are rapidly taking place in the region.
20
Supplementary material related to this article is available online at http://www.atmos-chem-phys-discuss.net/14/11343/2014/
acpd-14-11343-2014-supplement.pdf.
Acknowledgements. The US Environmental Protection Agency through its Office of Research and Development funded this study and collaborated in the research described here as a
com-25
ACPD
14, 11343–11392, 2014BC and PM2.5in
Central Asia
S. Kulkarni et al.
Title Page
Abstract Introduction
Conclusions References
Tables Figures
◭ ◮
◭ ◮
Back Close
Full Screen / Esc
Printer-friendly Version
Interactive Discussion
Discussion
P
a
per
|
D
iscussion
P
a
per
|
Discussion
P
a
per
|
Discuss
ion
P
a
per
also supported in part by the following grants: EPA (RD-83503701-0), NASA (NNX08AH56G), NSF (1049140), NCRR (UL1RR024979) and Fulbright-CONICYT (15093810). Its contents are
solely the responsibility of the authors and do not necessarily represent the official views of the
funding institutions. This manuscript has been subjected to US EPA review and approved for publication.
5
References
Adhikary, B., Carmichael, G. R., Tang, Y., Leung, L. R., Qian, Y., Schauer, J. J., Stone, E. a., Ramanathan, V., and Ramana, M. V.: Characterization of the seasonal cycle of south Asian aerosols: a regional-scale modeling analysis, J. Geophys. Res., 112, D22S22, doi:10.1029/2006JD008143, 2007.
10
Anenberg, S. C., Schwartz, J., Shindell, D., Amann, M., Faluvegi, G., Klimont, Z., Maenhout, G., Pozzoli, L., van Dingenen, R., Vignati, E., Emberson, L., Muller, N. Z., West, J. J., Williams, M., Demkine, V., Hicks, W. K., Kuylenstierna, J., Raes, F., and Ramanathan, V.: Global air quality and health co-benefits of mitigating near-term climate change through methane and black carbon emission controls, Environ. Health Persp., 120, 831–839, 2012.
15
Bauer, S. E., Koch, D., Unger, N., Metzger, S. M., Shindell, D. T., and Streets, D. G.: Nitrate aerosols today and in 2030: a global simulation including aerosols and tropospheric ozone, Atmos. Chem. Phys., 7, 5043–5059, doi:10.5194/acp-7-5043-2007, 2007.
Carmichael, G. R., Adhikary, B., Kulkarni, S., D’Allura, A., Tang, Y., Streets, D., Zhang, Q., Bond, T. C., Ramanathan, V., Jamroemsan, A., and Marrapu, P.: Asian aerosols?: current
20
and year 2030 distributions and implications to human health and regional climate change, Environ. Sci. Technol., 43, 5811–5817, 2009.
Chen, B., Sverdlik, L. G., Imashev, S. A., Solomon, P. A., Lantz, J., Schauer, J. J., Shafer, M. M., Artamonova, M. S., and Carmichael, G.: Empirical relationship between particulate matter and aerosol optical depth over Northern Tien-Shan, Central Asia, Air Quality, Atmosphere &
25
Health, 6.2, 358–396, doi:10.1007/s11869-012-0192-5, 2012.
Chen, B. B., Imashev, S. A., Sverdlik, L. G., Solomon, P. A., Lantz, J., Schauer, J. J., Shafer, M. M., Artamonova, M. S., and Carmichael, G. R.: Ozone variations over central Tien-Shan in Central Asia and implications for regional emissions reduction strategies, Aerosol Air Qual. Res., 13, 555–562, doi:10.4209/aaqr.2012.06.0156, 2013.