RESEARCH ARTICLE
G
β
Regulates Coupling between Actin
Oscillators for Cell Polarity and Directional
Migration
Oliver Hoeller1☯, Jared E. Toettcher1☯, Huaqing Cai2, Yaohui Sun3, Chuan-Hsiang Huang2,
Mariel Freyre4, Min Zhao3, Peter N. Devreotes2, Orion D. Weiner1*
1Cardiovascular Research Institute and Department of Biochemistry and Biophysics, University of California San Francisco, San Francisco, California, United States of America,2Department of Cell Biology, Johns Hopkins School of Medicine, Baltimore, Maryland, United States of America,3Institute for Regenerative Cures, Department of Dermatology, University of California Davis School of Medicine, Sacramento, California, United States of America,4Swarthmore College, Swarthmore, Pennsylvania, United States of America
☯These authors contributed equally to this work. *[email protected]
Abstract
For directional movement, eukaryotic cells depend on the proper organization of their actin cytoskeleton. This engine of motility is made up of highly dynamic nonequilibrium actin structures such as flashes, oscillations, and traveling waves. InDictyostelium, oscillatory actin foci interact with signals such as Ras and phosphatidylinositol 3,4,5-trisphosphate (PIP3) to form protrusions. However, how signaling cues tame actin dynamics to produce a pseudopod and guide cellular motility is a critical open question in eukaryotic chemotaxis. Here, we demonstrate that the strength of coupling between individual actin oscillators con-trols cell polarization and directional movement. We implement an inducible sequestration system to inactivate the heterotrimeric G protein subunit Gβand find that this acute pertur-bation triggers persistent, high-amplitude cortical oscillations of F-actin. Actin oscillators that are normally weakly coupled to one another in wild-type cells become strongly synchro-nized following acute inactivation of Gβ. This global coupling impairs sensing of internal cues during spontaneous polarization and sensing of external cues during directional motil-ity. A simple mathematical model of coupled actin oscillators reveals the importance of appropriate coupling strength for chemotaxis: moderate coupling can increase sensitivity to noisy inputs. Taken together, our data suggest that Gβregulates the strength of coupling between actin oscillators for efficient polarity and directional migration. As these observa-tions are only possible following acute inhibition of Gβand are masked by slow compensa-tion in genetic knockouts, our work also shows that acute loss-of-funccompensa-tion approaches can complement and extend the reach of classical genetics inDictyosteliumand likely other systems as well.
OPEN ACCESS
Citation:Hoeller O, Toettcher JE, Cai H, Sun Y, Huang C-H, Freyre M, et al. (2016) GβRegulates Coupling between Actin Oscillators for Cell Polarity and Directional Migration. PLoS Biol 14(2): e1002381. doi:10.1371/journal.pbio.1002381
Academic Editor:Sui Huang, Institute for Systems Biology, UNITED STATES
Received:August 10, 2015
Accepted:January 15, 2016
Published:February 18, 2016
Copyright:© 2016 Hoeller et al. This is an open access article distributed under the terms of the
Creative Commons Attribution License, which permits unrestricted use, distribution, and reproduction in any medium, provided the original author and source are credited.
Data Availability Statement:All relevant data are within the paper and its Supporting Information files.
Funding:This work was supported by an EMBO Postdoctoral Fellowship (to OH,http://www.embo.org/ funding-awards/fellowships/long-term-fellowships), a Cancer Research Institute Postdoctoral Fellowship (to JET, http://www.cancerresearch.org/grants-programs/grants-fellowships), a Helen Hay Whitney postdoctoral fellowship (to HC,http://www.hhwf.org/ HTMLSrc/ResearchFellowships.html), NSF Grants CB-1223 0951199 (to MZ,http://www.nsf.gov/funding/
Author Summary
The actin cytoskeleton of motile cells is comprised of highly dynamic structures. Recently,
small oscillating actin foci have been discovered around the periphery ofDictyostelium
cells. These oscillators are thought to enable pseudopod formation, but how their dynam-ics are regulated for this is unknown. Here, we demonstrate that the strength of coupling between individual actin oscillators controls cell polarization and directional movement. Actin oscillators are weakly coupled to one another in wild-type cells, but they become
strongly synchronized after acute inactivation of the signaling protein Gβ. This global
cou-pling impairs sensing of internal cues during spontaneous polarization and sensing of external cues during directional motility. Supported by a mathematical model, our data suggest that wild-type cells are tuned to an optimal coupling strength for patterning by
upstream cues. These observations are only possible following acute inhibition of Gβ,
which highlights the value of revisiting classical mutants with acute loss-of-function perturbations.
Introduction
For cells to move, their cytoskeletal structures become spatially organized by internal polarity
signals [1–3] as well as external chemoattractant [4–6]. How such signaling cues tame actin
dynamics to produce a pseudopod and guide cellular motility remains a key question in eukaryotic chemotaxis.
By now, several key regulators of the actin cytoskeleton have been identified: in most cells, nucleation promoting factors (NPFs) of the Wiskott-Aldrich Syndrome Protein (WASP) and SCAR/WAVE family stimulate actin nucleation through the Arp2/3 complex and are essential
for regulating polarity and motility for cells ranging fromDictyostelium[6,7] to metazoans [8–
10]. NPFs themselves are regulated by self-association on the plasma membrane [1,11] and
actin polymerization-based autoinhibition [1,12,13]; the actin polymer that they generate
facil-itates the removal of these NPFs from the plasma membrane. These positive and negative
feed-back interactions of the NPFs [1,14] and other actin regulators give rise to a range of highly
dynamic, free-roaming, nonequilibrium actin structures such as flashes and traveling waves
[1,2,5,6,15–21], but how the actin machinery is coaxed to form these very different activity
pat-terns is not well understood.
Particularly striking displays of NPF and actin dynamics are actin oscillations, which can be
observed in many cell types and contexts [1,2,5,22,23]. Biological oscillations are typically
gen-erated through a combination of (1) fast positive feedback, which amplifies small signals into an all-or-none output; and (2) delayed inhibition, which turns the output off and resets the sys-tem for the next pulse. By spatially coupling oscillators, spreading or synchronization over long
distances can be achieved [24–26].
Recently, small oscillating SCAR/WAVE foci have been discovered at the periphery of
Dic-tyosteliumcells [2]. These foci may constitute the basic cytoskeletal units from which pseudo-pods are formed. In the absence of signaling cues, these oscillators are present but lead to only small undulations of the cell boundary. In response to upstream signals, however, full-blown
protrusions emerge [2,27–31], likely from the coordination of these foci. Some intracellular
sig-nals (such as Ras and phosphatidylinositol 3,4,5-trisphosphate [PIP3]) have been identified
that affect this transition, but whether other signals link receptor activation with the SCAR/ WAVE foci, and, more generally, which properties of the foci are modulated to enable large-scale coordination, are not known.
(to ODW,http://www.nigms.nih.gov/Research/Pages/ default.aspx). The funders had no role in study design, data collection and analysis, decision to publish, or preparation of the manuscript.
Competing Interests:The authors have declared that no competing interests exist.
Abbreviations:cAMP, cyclic-AMP; ER, endoplasmic reticulum; GPCR, G-protein-coupled receptor; NPF, nucleation promoting factor; PIP3,
Here, we find that the heterotrimeric G-protein subunit Gβsets the coupling range of an
actin-based activator—inhibitor system. Specifically, acute sequestration of Gβleads to strong
global synchronization of normally weakly coupled cytoskeletal oscillators, and these effects are
independent of known upstream regulators of these oscillators, such as Ras and PIP3. We show
that this extended range of spatial coupling is detrimental for cell polarity, cell motility, and directional migration. To guide our intuition for how coupling between oscillators could affect
the cell’s ability to sense directional cues, we developed a simple mathematical model that
repre-sents its minimal features. Simulations show that the ability to sense a noisy input signal is facili-tated by an intermediate strength of oscillator coupling, allowing different membrane regions to
share information about the stimulus. We propose that in wild-type cells, Gβsets the coupling
strength of actin oscillators to an appropriate level to sense directional upstream cues.
Results
Engineering Rapamycin-Based Acute Inactivation of G
β
Strong loss-of-function phenotypes in cell motility are rare [6,32–38]. One reason may be that
genetic perturbations are slow to act and may give cells time to compensate for gene loss [39–
42]. Redundantly controlled processes like actin rearrangements during motility may be
partic-ularly susceptible to such compensation. To overcome this limitation, we developed a system
that enables fast loss-of-function perturbations to cell signaling events involved in
Dictyoste-liumcell motility. Here, we focus on its application to Gβ.
Heterotrimeric G-proteins consist of oneα,β, andγsubunit and link receptor-mediated
sig-nals to directed migration and polarization in eukaryotic cells ranging from yeast to
neutro-phils toDictyostelium[43–46]. Both intra- and extracellular signals can regulate the
cytoskeleton, yet while knockout of the sole Gβprotein inDictyosteliumcompletely blocks
che-motaxis, basal cytoskeletal dynamics and other directional responses such as
shear-flow-induced motility and electrotaxis are still present, although somewhat reduced [2,3,44,47,48].
Gβrequires plasma membrane localization in order to signal; thus, removal from the plasma
membrane should prevent it from activating downstream effectors. As Gβis continually
exchanged between membrane and cytoplasm with a half-life of 5 s [49], it should be possible to
trap it by association with an internal anchor. We built a Gβsequestration system using a
chem-ical dimerization approach whereby the association of two protein domains (FKBP and FRB) is
induced by the small molecule rapamycin [50–54]. Starting with Gβ-null cells [44], we expressed
an FRB—Gβfusion protein and an endoplasmic reticulum (ER)-localized FKBP
(FKBP-calnex-inA [55]). Thus, addition of rapamycin should drive Gβrelocalization to the ER and suppress
its signaling function, effectively rendering cells Gβ-null in an acute fashion (Fig 1A).
To test for rapamycin-induced sequestration, we measured the extent of ER-localized Gβin
single cells over time following rapamycin addition. We computed the correlation between
each cell’s fluorescence intensity in the ER anchor and Gβchannels to assess co-localization.
FRB-RFP-Gβwas rapidly sequestered from the plasma membrane and increasingly
co-local-ized in large clusters with FKBP-YFP-calnexinA (S1 Movie). Sequestration is fast: half-maximal
correlation occurred 5.6 min after addition of the highest dose (5μM) of rapamycin that was
tolerated by cells (Fig 1B and 1C,S1 Data). Sequestration kinetics were similar for both 5μM
rapamycin and 1μM rapamycin. Therefore, unless indicated otherwise, we used the lower
con-centration for subsequent experiments.
Gβ-null cells fail to transmit many signals triggered by G-protein-coupled receptors
(GPCRs) [44,56–59], and we should be able to recapitulate these defects with our sequestration
approach. We thus assayed whether relocalization of Gβto the ER inhibits transmission of
sig-nals from GPCRs to downstream effectors. Stimulating wild-type cells with chemoattractant
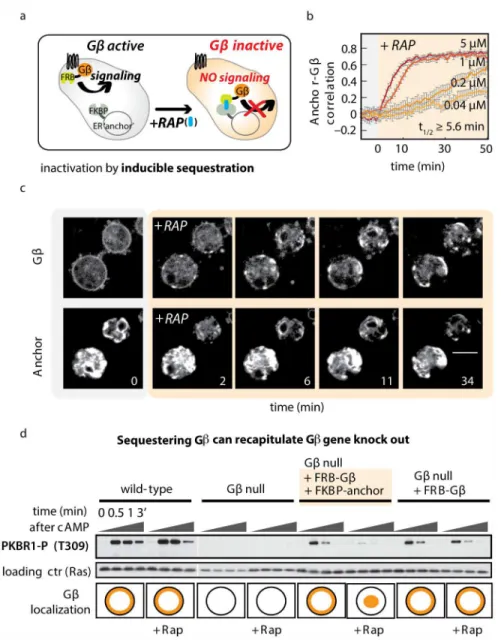
Fig 1. Inducible protein sequestration as a method to acutely inactivate Gβ.(A) Inducible sequestration can be exploited to inactivate a protein of interest. Using the small molecule rapamycin (RAP), FRB-tagged Gβcan be recruited to an FKBP-tagged“anchor”at the endoplasmic reticulum (ER). Addition of RAP sequesters Gβfrom its normal site of action at the plasma membrane and prevents it from activating downstream effectors. (B) Timecourse of Gβsequestration. In cells lacking endogenous Gβ, but expressing FRB-RFP-Gβand calnexinA-YFP-FKBP as an anchor at the ER, the speed and extent of sequestration were assayed by measuring the spatial correlation between YFP and RFP signals. For the highest dose of RAP, half-maximal heterodimerization is achieved within 5.6 min. To keep cells immobile, the experiment was performed in the presence of 10μM latrunculinA. The spatial correlations between fluorescence signals from Gβand anchor are plotted (n20 cells per condition; mean +/- standard error of the mean [SEM]). Raw data can be found inS1 Data. (C) Representative images from a Gβsequestration timecourse described in (B). Scale bar = 10μm. (D) Gβsequestration recapitulates Gβ-null phenotypes for receptor-stimulated signaling. Timecourses of chemoattractant stimulation (cyclic-AMP [cAMP]; 10μM) are shown in four strains: wild-type (wt), Gβ-null, and cells expressing one or both components of the Gβsequestration system. Each strain was stimulated in the presence and absence of rapamycin (5μM;>20 min incubation). Blot shows
phosphorylation of PKBR1 (T309); Ras is used as a loading control. Schematic indicates the localization of Gβ(in orange) for each condition in test strains and the published localization for wt and Gβ-null cells. Further examples of signaling events blocked after Gβsequestration can be found inS1 Fig.
(cAMP) triggers transient responses, including phosphorylation of PKBR1, and this response
is abolished in Gβ-null cells [33,56]. We found that introducing our FRB-Gβconstruct in Gβ
-null cells rescued the PKBR1 response. Acute sequestration of FRB-Gβto the ER anchor
blocked PKBR1 phosphorylation, but only when all three components of our system—the ER
anchor, FRB-Gβ, and rapamycin—are present (Fig 1D). Unfortunately experiments using the
inducible sequestration system in developed cells were often problematic: Tagged Gβand
anchor components were frequently degraded during starvation and, likely as a consequence, cells failed to complete their developmental cycle. However, this problem was not observed in
vegetative cells, in which the sequestration components remained intact. Gβ-dependent,
che-moattractant-stimulated responses in vegetative cells, such as Ras activity and PIP3production
[57,59,60], could also be blocked by Gβ-sequestration (S1 Fig). Taken together, these results
demonstrate that in the absence of rapamycin, our inducible sequestration system sustains key
Gβ-dependent signaling events. In the presence of rapamycin, Gβis sequestered from its site of
action, thereby blocking receptor-based signaling. In this respect, sequestration of Gβ
recapitu-lates Gβ-null cells.
G
β
Sequestration Impairs Directional Migration
To probe for phenotypes that may only be apparent after rapid loss of Gβ, we turned to
direc-tional motility assays. We measured the behavior of Gβ-sequestered cells presented with two
different directional cues—an attractive chemical (folate) or electric fields—and compared
their responses with wild-type and Gβ-null cells. While chemotaxis is strictly dependent on
Gβ, electrotaxis, the directed migration ofDictyosteliumcells in response to electric fields, is
not. While Gβ-null cells cannot move up a chemical gradient, they can move down electrical
potential [44,47].
We took advantage of the heterogeneity in expression of components in Gβ-sequestered
cells to internally control experiments. We can distinguish behavior of cells that, in the
pres-ence of rapamycin, are functionally wild-type (expressing RFP-FRB- Gβ, but no
CFP-FKBP-anchor), Gβ-null (with no detectable RFP-FRB- Gβexpressed), or Gβ-sequestered (expressing
both RFP-FRB- Gβand CFP-FKBP-anchor). For chemotaxis, we further compared these
popu-lations to true wild-type and true Gβ-null cells.
We find that just as unsequestered cells resemble wild-type cells, Gβ-sequestered cells
behave similarly to Gβ-null cells in chemical gradients. In the presence of Gβ, cells move
direc-tionally, while in the absence of functional Gβ(through sequestration or knockout),
direction-ality is lost (Fig 2A). Furthermore, Gβ-sequestered cells (0.4 +/- 0.1μm/min;n= 31; +/- SEM)
as well as true Gβ-null cells (0.4 +/- 0.05μm/min;n= 98; +/- SEM) move at a reduced speed
compared to unsequestered (1.1 +/- 0.2μm/min;n= 30; SEM) or true wild-type (2.5
+/-0.15μm/min;n= 97; +/- SEM) cells.
In contrast, in electrical fields, the behavior of Gβ-sequestered cells differs from the Gβ
knockout. Compared to wild-type and Gβ-null cells, Gβ-sequestered cells show a significant
decrease in their directionality during electrotaxis (Fig 2BandS2 Movie). Furthermore, the
speed of translocation in Gβ-sequestered cells (2.1 +/- 0.22μm/min, mean +/- SEM;n= 34)
was reduced compared to wild-type (3.8 +/- 0.23μm/min, mean +/- SEM;n= 34; Student’s
two tailedttest:p<10-6) and Gβ-null cells (2.9 +/- 0.23μm/min, mean +/- SEM;n= 33;
Stu-dent’s two tailedttest:p<0.006).
G
β
Sequestration Drives Large-Scale Oscillations of Cortical F-actin
Closer examination of Gβ-sequestered cells by confocal microscopy revealed a striking change
in the organization of the actin cytoskeleton. While wild-type cells have fairly stable levels of
cortical and cytoplasmic actin, sequestration of Gβinduces striking oscillations of LimE-GFP,
a reporter for dynamic F-actin (Fig 3A and 3B) [61]. Periodic loss of cytoplasmic LimE-GFP
intensity is accompanied by a corresponding accumulation of F-actin around the entire
periph-ery of the cell (S2andS3Figs). The cytoskeletal oscillations induced by Gβsequestration are
present in the majority of cells and have well-defined characteristics. By automatically tracking cells over time and measuring their cytoplasmic LimE-GFP intensity, we identified oscillating
cells from the characteristic peak induced in their Fourier spectrum (S4 Fig). After rapamycin
addition, the fraction of oscillating cells rises from 6% to 52%, but only when the ER anchor is
co-expressed (Fig 3CandS1 Data). The period of oscillation (measured as the peak frequency
of the Fourier-transformed signal) is tightly controlled across all oscillating Gβ-sequestered
cells (12.9 +/- 3.2 s,n= 83) (S4 Fig). We also observed a second F-actin phenotype upon acute
loss of Gβ. In ~10% of cells, waves of F-actin polymerization travel around the cell perimeter
with a similar period as the whole field oscillations, taking 10–20 s for a full cycle (S5 Figand
S3 Movie).
Two lines of evidence confirm that acute Gβloss of function through sequestration is
required to initiate this actin oscillation phenotype. First, oscillations are not observed when the ER is forced into proximity of the plasma membrane, arguing against an ER-specific
recruitment phenotype (S3 Fig). Most importantly, when Gβis overexpressed and sequestered
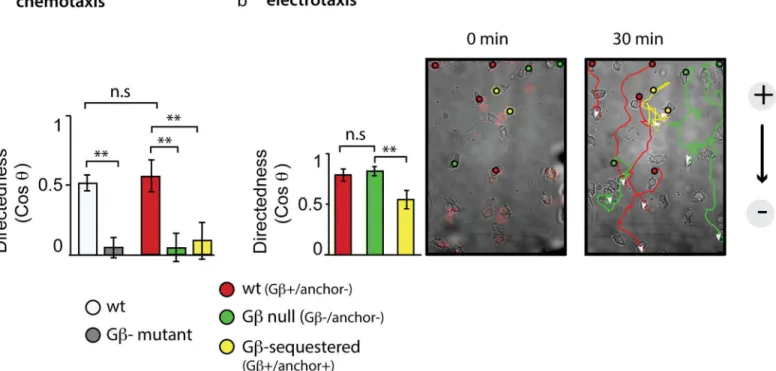
Fig 2. Gβsequestration impairs directional migration.(A) Cells of the Gβsequestration strain were incubated with rapamycin and exposed to a gradient of folate. Based on the expression of sequestration components, different subpopulations were identified, and directionality was measured after 30 min of migration. Plotted are the means (+/- S.E.M) of wild-type (wt): Gβ+/anchor- cells (n= 30, red); Gβ-null (Gβ-): Gβ-/anchor- cells (n= 48, green); and Gβ-sequestered: Gβ+/anchor+ cells (n= 31, yellow).**indicates a highly significantp-value of<0.02; n.s. indicates a not-significantp-value of>0.05 (Student’s two tailedttest). Data are derived from five videos in two independent experiments. For comparison, directedness of wt (DH1) and Gβ- cells (n= 97 and
n= 98, data from two videos in single experiments, respectively) is shown in light and dark grey bars. Raw data can be found inS1 Data. (B) Cells of the Gβ sequestration strain were incubated with rapamycin and exposed to an electrical field. Based on the expression of sequestration components, different subpopulations were identified, and directionality was measured after 30 min of migration. Plotted are the means (+/- stdev) of wt: Gβ+/anchor- cells (n= 33, red), Gβ-null: Gβ-/anchor- cells (n= 34, green); and Gβ-sequestered: Gβ+/anchor+ cells (n= 34, yellow).**indicates a highly significantp-value of<0.01; n. s. indicates a not-significantp-value of>0.05 (Student’s two tailedttest). Data are combined from several fields of view of movies recorded on two separate days. A movie corresponding to the stills in Fig 2B is included asS2 Movie. Raw data can be found inS1 Data.
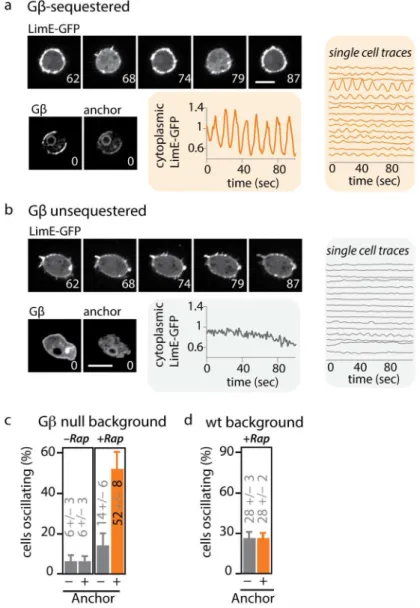
Fig 3. Acute Gβsequestration leads to oscillations in cortical F-actin.(A) Acute sequestration of Gβ induces cytoplasmic oscillations of the F-actin reporter LimE-GFP. Cells were treated with 1μM rapamycin, and LimE-GFP (upper panels) was imaged over time. Graphs show cytoplasmic LimE-GFP quantified from individual cells. Lower panels: FRB-RFP-Gβand calnexinA-YFP-FKBP images show colocalization (sequestration) of Gβat the anchor. Scale bar = 5μm. Numbers indicate time in seconds. Corresponding oscillations at the cortex can be seen inS2 Fig. (B) Behavior of the F-actin reporter in Gβunsequestered cells. LimE-GFP (upper panels) was imaged over time. Graphs show cytoplasmic LimE-GFP quantified from individual cells. Lower panels: FRB-RFP-Gβand calnexinA-CFP-FKBP images show distinct Gβand anchor localization. Scale bar = 5μm. Numbers indicate time in seconds. (C) The percentage of oscillating cells was quantified from cells expressing LimE-GFP and FRB-RFP-Gβ, either in the presence (+ anchor) or absence (–anchor) of calnexinA-YFP-FKBP. In both strains, cells were left untreated (–Rap) or incubated with 1μM rapamycin (+Rap) for at least 20 min (n150 cells per condition from three independent days; plotted are means +/- SEM). Raw data can be found inS1 Data. (D) The oscillatory phenotype is rescued by performing Gβsequestration in the presence of wild-type Gβ. This indicates that sequestration of Gβinduces a loss-of-function phenotype. Wild-type cells expressing FRB-RFP-Gβwere incubated with 1μM rapamycin (+Rap) for at least 20 min. LimE-GFP oscillations were compared between cells that co-expressed the anchor
(calnexinA-CFP-FKBP) or lacked the anchor. (- anchor:n= 91; mean +/- stdev; + anchor:n= 23; mean +/-stdev). Further experiments presented as supplement: Oscillations of LimE are due to loss, and not gain, of Gβfunction (S3 Fig). The computational pipeline used to analyze oscillations is presented inS4 Fig. In some cases, Gβsequestration also induces waves of actin polymerization that travel around the cell perimeter (S5 Fig). Oscillations of LimE start rapidly after Gβis sequestered (S6 Fig). Raw data can be found inS1 Data.
doi:10.1371/journal.pbio.1002381.g003
in wild-type cells (which harbor endogenous Gβthat cannot be recruited), no actin oscillations
are induced (Fig 3DandS1 Data).
Individual cells transition abruptly into the oscillatory mode. Oscillations become apparent
as soon as rapamycin-induced sequestration of Gβcan be observed (S6 FigandS3 Movie) and
can continue for days (see later;Fig 4CandS1 Data). By treating cells with both rapamycin
(the FKBP-FRB heterodimerizer) and a competitive inhibitor of heterodimerization (the small
molecule FK506, an FKBP-FKBP homodimerizer), we titrated Gβlevels over the full dynamic
range of the sequestration system (S7 Fig). As the amount of sequestered Gβis increased, the
properties of the oscillating state such as its period and amplitude did not change (S8 Fig). The
oscillations have characteristics of an all-or-none behavior: only the percentage of oscillating
cells increased (Fig 4A and 4B,S1 Data).
These phenotypes—whole-cell oscillations and traveling waves of actin polymerization—
are reminiscent of previously observed actin-based activator—inhibitor systems [1,2,5,6,16–
20]. However, the oscillations we observe here are triggered, persistent, and have an unusually
large spatial range and high amplitude. This suggests that acute loss of Gβpushes the
cytoskele-ton into an unusual state.
Acute Inactivation of G
β
Differs from G
β
-Null Cells
Our observation that cortical F-actin oscillations follow acute sequestration of Gβraises a key
question: why did previous Gβ-null analyses fail to uncover this striking cytoskeletal phenotype?
Consistent with published work [2,3], we find that very few Gβ-null cells display LimE-GFP
oscillations cells (Fig 4CandS1 Data). We reasoned that if cells compensate for the loss of Gβ
function over time, the phenotype induced by acute sequestration of Gβshould approach the
Gβ-null phenotype after sufficient time has passed. Consistent with this hypothesis, the fraction
of oscillating cells decreases over days of continuous Gβsequestration and eventually
approaches the small fraction seen in Gβnulls (Fig 4CandS1 Data). Similar compensatory
phe-nomena have been previously observed in otherDictyosteliumsignaling contexts. For example,
the effect of LY294002, a PI3K inhibitor, onDictyosteliumcell migration fades during prolonged
treatment [2], likely due to compensation by redundant signaling pathways [35]. In another
case, the actin nucleator WASP relocalizes to the leading edge and compensates for SCAR/
WAVE function when SCAR/WAVE is deleted [6]. Our findings suggest that a compensatory
mechanism is also at work here: the globally oscillating state is suppressed in Gβ-null cells.
Our results highlight the value of using acute inhibition to uncover protein function. We
have used rapamycin-induced Gβsequestration to interrogate loss-of-function phenotypes
along two“axes”(Fig 4D). By titrating the amount of sequestration while retaining its fast
time-scale (axis 1), it is possible to interrogate how a phenotype emerges, distinguishing between an all-or-none or gradual transition. Conversely, varying the timescale of perturbation (axis 2) reveals whether phenomena such as cellular compensation can mask an acutely induced
phe-notype. Applied to Gβsequestration, we find that a new phenotype—a globally oscillating
F-actin cytoskeleton—can be uncovered at points in this“phenotypic space”that are not
accessi-ble to standard genetic perturbations.
Whole-Field Oscillations Emerge by Synchronizing Preexisting
Oscillators
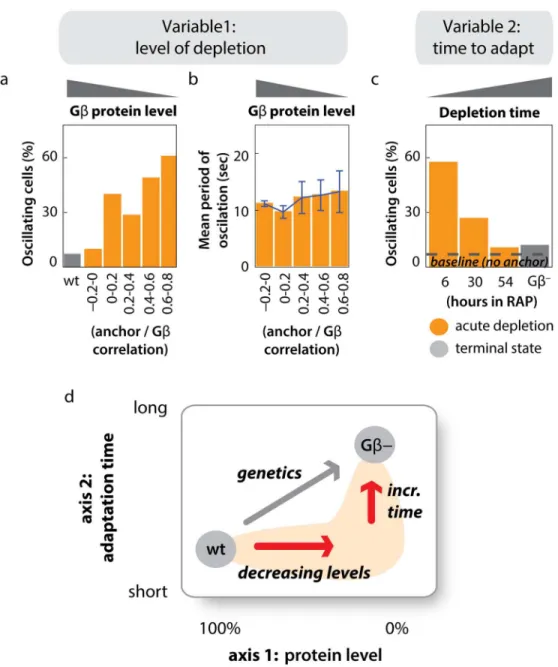
Fig 4. Actin oscillations depend on the extent and timing of Gβsequestration.(A) Higher levels of sequestration (lower concentration of active Gβ) result in a larger fraction of oscillating cells. To achieve stable, intermediate levels of Gβsequestration, cells were cotreated with 300 nM rapamycin and 0, 5, 10, 20 or 40μM FK506, a competitive inhibitor of rapamycin. The correlation between Gβand the anchor signal was extracted from single cells of all treatment conditions, and cells with similar levels of correlation were analyzed together (seeS7 Fig). Gβ-unsequestered cells (wt) were analyzed for comparison. Negative correlation values indicate anticorrelation of Gβand anchor in the unsequestered state. The mean of at least 20 cells in each bin is shown. Raw data can be found inS1 Data. (B) Higher levels of sequestration (a lower concentration of active Gβ) do not affect the period of oscillation. Cells and treatment conditions are the same as analyzed in (A). (n20 cells per sequestration bin; plotted are means +/- stdev). The amplitude of actin oscillations is also not affected by sequestration of Gβ(S8 Fig). Raw data can be found inS1 Data. (C) The percentage of oscillating cells decreases over time during Gβsequestration and approaches the terminal Gβ-null state. Cells were incubated with 1μM rapamycin, and the fraction of oscillating cells was determined at the timepoints indicated (n>25 Gβ-sequestered cells per condition). Raw data can be found inS1 Data. (D) Acute inhibition via rapamycin mediated protein sequestration can reveal phenotypes that are not accessible through classic genetic perturbations. First, it can reveal consequences of protein depletion to intermediate levels, such as the gradual or all-or-none emergence of phenotypes (axis 1). Second, rapid inactivation can reveal immediate phenotypes that are not accessible to slower methods of gene inactivation (axis 2).
doi:10.1371/journal.pbio.1002381.g004
oscillation dynamics are unchanged in Ras, PI3K, and Gβnulls) [2]. The large-scale cortical actin oscillations we observe here are similar in period to the previously described oscillating foci (13 +/- 3 s versus 9 +/- 2 s, respectively), suggesting that these two forms of cytoskeletal
dynamics may be closely related. Thus, we tested whether our acute sequestration of Gβwould
reveal signaling control over these oscillatory actin foci.
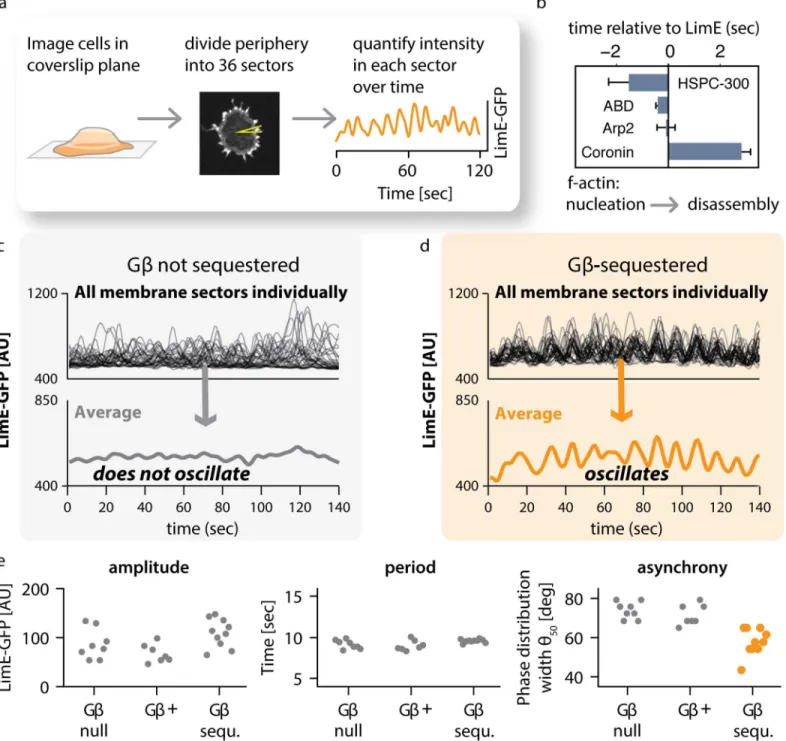
To analyze individual actin foci, we collected confocal movies imaged in the plane where cells contact the coverslip. We developed a computational approach to comprehensively track
and quantify the dynamics of actin foci by automatically identifying each cell’s periphery,
sub-dividing it into ten degree sectors (thereby generating 36 tracked regions per cell), and
measur-ing the mean intensity in each sector over time (Fig 5A). Consistent with previous results [2],
we found large-amplitude oscillations in LimE-GFP intensity in some sectors (Fig 5A, right
panel) but not others, with a mean period of approximately 10 s (S9 Fig). Regulators of F-actin
formation localize to the same structures and oscillate as well: the peak of actin-nucleating SCAR/WAVE complex member HSPC-300 precedes that of LimE by about 2 s; Arp2 and the F-actin binding domain (ABD) of ABP120 peak at about the same time as LimE; and the peak
of Coronin, a regulator of actin disassembly [2,62], lags behind LimE by more than 2 s (Fig 5B,
S10 Fig, andS1 Data). These data suggest that focal LimE oscillations report cycles of
polymeri-zation and disassembly of F-actin.
We next addressed how the dynamics of actin foci compare between wild-type (Gβ
-unse-questered) cells and Gβ-sequestered cells that exhibit whole-field oscillation. In both cases,
individual sectors oscillate. However, the mean LimE intensity across all sectors in Gβ
unse-questered cells does not show a marked oscillatory behavior (Fig 5C), whereas the mean
inten-sity of sectors in Gβ-sequestered cells clearly oscillates (Fig 5D). Thus, the whole-field
oscillations we observe upon Gβ-sequestration in the middle plane of cells (Fig 3A) are also
reflected in the behavior of membrane-plane actin foci.
What properties of these individual oscillators change as cells transition to whole-field oscil-lation? We reasoned that changes in the amplitude, period, or the synchronization in phase between individual oscillating sectors could be responsible. We developed an automated
approach using the Hilbert transform [63,64], which has been used extensively to analyze
neu-ronal activity [65,66], to quantify the amplitude, period, and phase of individual oscillators
over time (S11 Fig). Using this algorithm, we extracted the oscillation phase (i.e., whether
cur-rently at a peak or trough) as well as the instantaneous period (i.e., how fast the phase is
chang-ing) at each timepoint. Strikingly, only the phase synchrony differs in Gβ-sequestered cells (Fig
5E,S12 FigandS1 Data). Yet although synchrony increases, it is not perfect: individual sectors
can fall in and out of phase with the group over time (S13 Fig). Taken together, our data suggest
that global oscillations in Gβ-sequestered cells are caused by increasing synchronization
among preexisting membrane oscillators.
Spatial Coupling Bypasses Established Cytoskeletal Signaling
Pathways
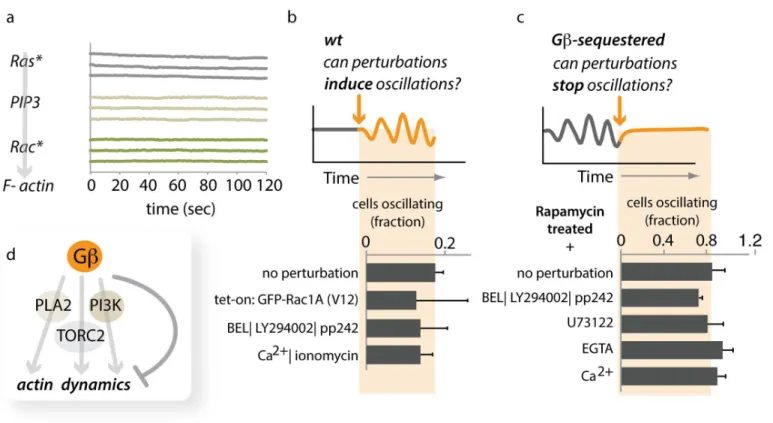
Downstream of Gβ, three signaling pathways, defined by PI3K, TORC2, and PLA2, are known
to instruct actin-based motility inDictyostelium(Fig 6D). Ras activity can feed into both PI3K
and TORC2, and downstream, Rac activation is thought to connect these signaling modules to
the actin cytoskeleton [31,33,38,56]. Enhanced activity of these pathways leads to wider, more
stable zones of actin polymerization compared to the isolated oscillating foci.
We investigated whether Gβuses any of these signaling pathways to regulate spatial
cou-pling of actin foci. First, we analyzed the dynamics of Ras activity, PIP3levels, and Rac activity
Fig 5. Gβregulates coupling between individual actin oscillators.(A) Method of analysis. Cells expressing LimE-GFP were imaged by confocal microscopy in the plane where cells make contact with the coverslip. At each timepoint, the cell periphery was divided computationally into 36 sectors. For each sector, the intensity of LimE-GFP was quantified over time. The graph shows the trace for a single sector. (B) The temporal order of actin regulators at peripheral actin foci. The indicated actin reporters showed pulsatile behavior at the cell’s periphery. We measured their appearance, relative to LimE, in the same sectors in double-labeled cells. Oscillators from several cells (HSPC-300n= 9; ABDn= 11; Arp2n= 4; Coroninn= 4) were analyzed (plotted are means +/- SEM). An example for a dual color sequence of LimE and Coronin oscillations is shown inS10 Fig. Raw data can be found inS1 Data. (C) Traces for all 36 sectors of one control cell in which Gβwas not sequestered. Individual sectors oscillate, but the overall average does not. (D) Traces for all 36 sectors of one cell in which Gβsequestration was induced by treatment with 1μM rapamycin. Individual sectors oscillate, and so does the overall average. (E) Analysis of oscillation parameters. Each point represents the average of all 36 sectors of one cell. Amplitude and period of oscillations are similar in unsequestered (Gβ+), Gβ-sequestered (Gβ-sequ.), and Gβ-null cells. In contrast, synchrony of oscillations is increased in acutely sequestered cells. Raw data can be found inS1 Data. Further data are presented as supplements: a histogram of oscillation periods of individual sectors for one cell for each condition is shown inS9 Fig. To extract and compare phase information, we used the Hilbert transform, as shown inS11 Fig. A histogram of phase
distributions for one cell each is shown inS12 Fig. Membership of individual oscillating sectors with the phase locked consensus is fluid as shown inS13 Fig.
doi:10.1371/journal.pbio.1002381.g005
changes to these signaling currencies on a timescale of minutes (Fig 6A). Second, we perturbed the activities of members of these pathways in wild-type cells to determine whether global LimE oscillations would emerge. Neither inducing Rac activity (Tet-On: GFP-Rac1A[V12]), blocking all three pathways (using a pharmacological cocktail: BEL|LY294002|pp242), nor
rais-ing the levels of intracellular Ca2+(a messenger commonly oscillating in other systems [22,67])
led to global oscillations of F-actin (Fig 6BandS1 Data). Third, we interfered with these
path-ways in Gβ-sequestered oscillatory cells to determine whether their activity was required for
synchrony. Acute inhibition of all three pathways caused only a very small decrease in the
number of oscillating cells, while unbalancing Ca2+levels did not inhibit global oscillations at
all (Fig 6CandS1 Data). We conclude that Gβ’s control over the coupling range of actin
oscil-lators likely involves a different, currently unidentified mediator.
Increased Spatial Coupling of Oscillators Impairs the Establishment of
Cell Polarity
How can hypercoupling between cytoskeletal oscillators lead to a defect in directed cell migra-tion? The coupling state among the oscillators might be an important parameter for upstream
cues to polarize the cytoskeleton—a prerequisite for cell motility. To investigate this question,
we tracked individual Gβ-sequestration cells over time, simultaneously monitoring cytosolic
actin dynamics and cell migration in both the presence and absence of rapamycin.
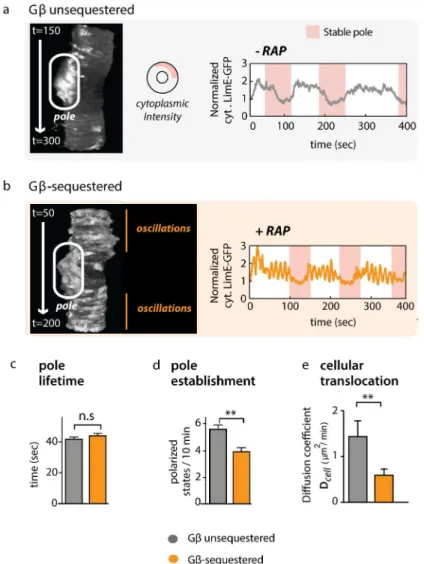
For this analysis, we returned to confocal imaging in the midplane of the cell. Here, polari-zation events are distinguished by a relatively stable actin patch that coincides with a
substan-tial drop in cytoplasmic LimE-GFP reporter levels (Fig7A and 7BandS14 Fig). In both control
and Gβ-sequestered cells, polarized patches are of similar intensity (S15 Fig), and phases of
polarity alternate with apolar phases, which can easily be visualized in t-stack kymographs (Fig
7A and 7B; left panels). In this representation, they-axis represents time, and the lateral surface
of the cell is shown for each timepoint along thex-axis.
We found that Gβ-sequestered as well as Gβunsequestered cells were capable of cycling
between polarized and apolar states (S4andS5Movies). Consistent with our prior results,
acute sequestration of Gβinduced large-amplitude oscillations of F-actin. However, long-term
imaging revealed that these oscillations are largely restricted to apolar phases—times when the
cell is not undergoing protrusion or migration (Fig 7BandS5 Movie). Thus, phases of
polariza-tion appear to be incompatible with whole cell oscillapolariza-tions. While increased coupling in Gβ
-sequestered cells did not affect the lifetime of poles once they successfully formed (Fig 7Cand
S1 Data), Gβsequestration significantly (p<10-4, Student’s two-tailedttest) impaired the
establishment of new poles (Fig 7DandS1 Data). Consistent with a reduced number of cell
polarization events, sequestered cells translocate at a significantly reduced speed (p<0.003,
Student’s two-tailedttest,Fig 7EandS1 Data).
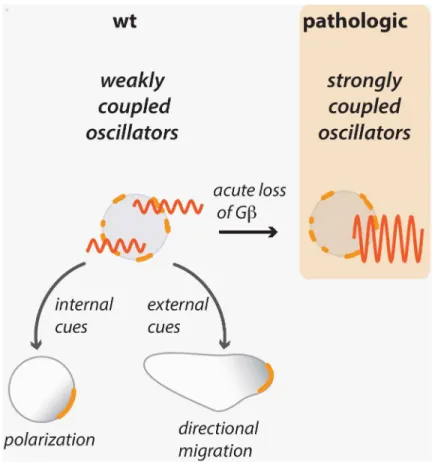
Taken together, our data show that appropriate control of coupling between localized cyto-skeletal oscillators is essential for efficient polarization and motility as well as directional
sens-ing. Increasing the strength of coupling—through acute loss of Gβ—synchronizes actin
dynamics, which hampers the entrainment of the actin cytoskeleton by both internal polarity
cues as well as entrainment by the external cues that are necessary to direct motility (Fig 8).
Oscillator Coupling Is Sufficient to Increase Sensitivity to Noisy Inputs
One of the most remarkable features of chemotaxis is the ability of migrating cells to accurately
sense extraordinarily shallow chemical gradients [68]. Previous work has suggested that the
we have uncovered a separate link between Gβand the cytoskeleton in tuning coupling between actin oscillators. Might oscillator coupling also play a role in input sensitivity?
We reasoned that oscillator-to-oscillator coupling might represent a means of sharing
infor-mation between nearby regions of the cell periphery. By comparing noisy receptor—ligand
interactions at multiple locations, cells might improve their ability to discriminate signal from noise when choosing a migration direction. To test this hypothesis in a simple context, we built
a mathematical model representing input sensing at the cell’s periphery (Fig 9). It should be
emphasized that this model is not meant to capture the full complexity of the cell’s gradient
sensing and chemotaxis pathways, but rather represents a minimal model to quantitatively interrogate the essential elements of oscillator-to-oscillator coupling and entrainment to an
input. Our model incorporates a circular lattice of actin oscillators representing the cell’s
cor-tex. Oscillators are coupled to one another by a term that increases sinusoidally with their
dif-ference in phase [71] and can also be coupled to an oscillating input signal using the same
mechanism. Although the chemoattractant signals presented to a real cell are unlikely to oscil-late in this fashion, the exact mechanism for input coupling is unknown, and our simplifying Fig 6. Gβ-mediated coupling bypasses established signaling pathways.(A) Signaling activities upstream of F-actin formation do not show global oscillations upon sequestration of Gβ. Representative traces (changes in intensity of reporter constructs in the cytoplasm) of several movies are shown for Ras activity (Ras*) visualized with YFP-RBD(PI3K1), PIP3visualized with PhdA-GFP, and Rac activity (Rac*) visualized with GBD(PAK)-YFP. (B)
Perturbations of core chemotactic regulatory pathways do not induce global oscillations of LimE. Neither induced expression of a constitutively active version of Rac1A (GFP-Rac1A-V12) nor a triple drug cocktail (BEL|LY294002|pp242) inhibiting PLA2-, PI3K-, and TORC2-mediated signaling induces global oscillations of LimE-RFP in wild-type (Ax2) cells. Similarly, increasing the intracellular concentration of Ca2+has no effect. Data represent the means of more
than 35 cells from at least 2 d for each condition (+/- stdev). Raw data can be found inS1 Data. (C) Inhibition of core chemotactic regulatory pathways does not abolish Gβmediated global oscillations of LimE-GFP. Gβ-sequestered, oscillating cells were treated with various drugs to determine their effect on oscillatory behavior. Neither a triple-drug cocktail (BEL|LY294002|pp242) that simultaneously blocks PLA2-, PI3K-, and TORC2-mediated signaling, nor unbalancing Ca2+levels (blocking PLC with U73122, supplying Ca2+or chelating any Ca2+present in the buffer with EGTA) had a significant effect on the
presence of global LimE-GFP oscillations. Data represent the means of more than 25 cells from at least 2 d for each condition (+/- stdev). Raw data can be found inS1 Data. (D) Gβappears to bypass established signaling pathways to regulate the spatial range of coupling.S19 Figshows data to validate the use of pp242 as an inhibitor for TORC2 mediated signaling inDictyosteliumcells.
doi:10.1371/journal.pbio.1002381.g006
Fig 7. A hypercoupled cytoskeleton competes with establishment of cell polarity.(A) In Gβ unsequestered (wt) cells, phases of polarization, characterized by low cytoplasmic LimE-GFP intensity, alternate with apolar phases. A confocal slice from the middle of an unsequestered cell is stacked into a kymograph (t-stack), where they-axis represents time and thex-axis represents intensity along the cell’s lateral surface. Continuous bright areas (white oval) indicate LimE-GFP accumulation in a pseudopod. The corresponding trace of cytoplasmic LimE-GFP intensity on the right shows that phases of polarity (pink shading; seeS14 Fig) coincide with low levels of cytoplasmic reporter (and, therefore, higher levels of polymerized actin at the periphery). A total of 28 unsequestered cells were analyzed with similar results. (B) Whole-field LimE-GFP oscillations are restricted to apolar phases in Gβ-sequestered cells. One
representative t-stack and corresponding trace is shown. A total of 46 Gβ-sequestered cells were analyzed with similar results.S15 Figshows that the strength of polarization is similar between Gβ-sequestered and Gβ-unsequestered cells. (C) The lifetime of poles in Gβ-unsequestered cells (grey;n= 28) and Gβ-sequestered cells (orange;n= 46) is similar (p= 0.51 for their difference, Student’s two-tailedttest; plotted are means +/- SEM). Raw data can be found inS1 Data. (D) The frequency at which poles are established in Gβ-sequestered cells is reduced compared to Gβ-unsequestered cells (the same set of cells as inFig 4Cis analyzed; plotted are means +/- SEM;p<10-4, Student
’s two-tailedttest). Raw data can be found inS1 Data. (E) Cellular translocation is slowed down for Gβ-sequestered cells (mean +/- SEM = 0.59 +/- 0.14μm2/ min,n= 46) compared to Gβ-unsequestered cells (mean +/- SEM = 1.43 +/- 0.35μm2/min,n= 28;p<0.003,
Student’s two-tailedttest). Mean squared displacement is a suitable metric for cell migration over short periods of time (S20 Fig). Raw data can be found inS1 Data.S18 Figshows that oscillating actin foci are suppressed during cell polarization in wild-type cells. Abbreviations used: SEM = standard error of the mean; n.s. = not significant,p-value>0.05;**indicates a highly significantp-value of<0.01.
assumption allowed us to model oscillator-to-input and oscillator-to-oscillator coupling in a single unified framework. Our model includes three parameters that define the coupling
between an external input and the nearby membrane (kIN) and the coupling between
mem-brane oscillators (parametersk1andk2for input-coupled and non-input-coupled membrane
oscillators). We also include a term (σ) to represent noise in input-to-oscillator coupling. Our model reproduced well-known features of coupled oscillator systems. Increasing oscil-lator-to-oscillator coupling showed an abrupt transition to global synchrony, consistent with prior work modeling the synchronization of weakly coupled oscillators as a phase transition
(S16 Fig) [68,69]. This is analogous to the effect observed after Gβsequestration, in which the
transition to global oscillation appears to be all-or-none in individual cells (Fig 4andS1 Data).
To test how coupled oscillators are affected by features of the input signal, we set out to determine how oscillator-to-oscillator coupling affected sensing of weak inputs (low values of
kIN) or noisy inputs (high values ofσ). We found that increasing coupling could not improve
sensing of weak noise-free inputs but rather led to spontaneous synchronization as coupling
strength is increased (S21 Fig). In contrast, oscillator-to-oscillator coupling markedly improved
sensing of noisy inputs (Fig 9). For simulations with little or no coupling, the effect of noise
was dominant, and membrane oscillators were unable to accurately couple to inputs (Fig 9;k1
= 0.1). Conversely, for very strong coupling, oscillators became synchronized to one another so Fig 8. Acute loss of Gβinduces a hypercoupled cytoskeleton.By synchronizing weakly coupled peripheral oscillators, a hypercoupled state is induced that is apparent as whole-field oscillations. This pathologic state is less permissive to the establishment of cell polarity and continuous realignment of polarity in a gradient. We suggest that this hypercoupled state prevents oscillators from becoming patterned by upstream signaling cues from inside or outside the cell.
doi:10.1371/journal.pbio.1002381.g008
strongly that they were completely input-insensitive (Fig 9;k1= 3.5) [25,71]. Between these
two extremes, our model revealed an optimum of input sensitivity at an intermediate coupling
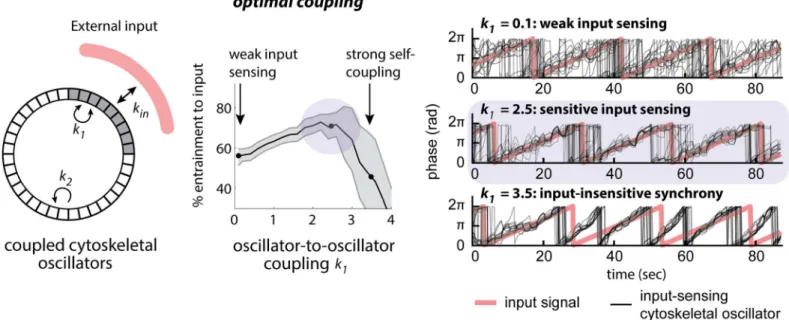
strength (Fig 9;k1= 2.5).
If weak oscillator-to-oscillator coupling was indeed beneficial for input sensing, one would expect wild-type cells to exhibit some coupling between oscillating foci. Indeed, we find experi-mentally that in wild-type cells the relative phases of oscillators are not random but loosely
cor-related (Fig 5E, asynchrony; phase distribution widthΘ50<90 [deg.];S12 FigandS1 Data).
Thus, we propose that upstream signaling cues optimally entrain the cytoskeleton when the coupling strength between its dynamic units is of intermediate strength.
Discussion
Spatial Coupling between Cytoskeletal Units Regulates Polarity and
Directional Migration
A dynamic actin cytoskeleton drives eukaryotic cell migration. Waves, flashes, patches, and
oscillatory actin foci have been observed inDictyostelium[2,5,6,15–19], neutrophils [1,4], and
other mammalian cells [17,20,72,73]. Underlying these phenomena are nonlinear reaction
pro-cesses that exhibit a range of behaviors including excitability and oscillations [1,2,26,29,70,74].
These cytoskeletal dynamics are shaped further by upstream cues such as internal polarity
sig-nals [1–3] and external chemoattractant [4,5]. Here, we show that signaling also directly
regu-lates the strength of coupling between local cytoskeletal processes. Acute loss of Gβleads to
strong synchronization of actin oscillators, which has detrimental consequences for cell polar-ity, motilpolar-ity, and directionality.
Electrotaxis revealed this new role for Gβin directed cell migration. However, we expect the
link between Gβand cytoskeletal dynamics to be essential for interpreting other cues as well.
Fig 9. A mathematical model demonstrates that intermediate oscillator coupling is sufficient to increase sensitivity to noisy inputs.Wild-type cells may be in a range of optimal coupling between cytoskeletal oscillators to facilitate entrainment by signaling cues. To investigate how coupling strength influences signal detection, we have built a simple model in which sectors all around a circle couple at a strengthk2. The test area couples locally with a
strengthk1, and entrainment to an external input of strengthkIN(left panel) is assessed. At intermediate values for oscillator coupling,k1entrainment to the
input is optimal (middle panel). Examples for oscillator entrainment at different values ofk1are shown (right panel).
During chemotaxis, when the activity of the Gαβγheterotrimer is proportional to the amount
of the chemical signal the cell experiences [75], fine control of the magnitude and intracellular
distribution [76] of oscillator coupling may be possible.
In future work, it will be important to learn more about how Gβexerts this control.
Com-mon signaling pathways involving PI3K, TORC2, and PLA2 appear to be not essential.
Simi-larly, perturbing levels of Ca2+, a messenger known to oscillate in many systems [22,67],
including chemotaxingPhysarum polycephalumcells [77], shows no obvious effect on coupling
between actin oscillators.P.polycephalum, however, is a beautiful, conceptual precedent for the
idea that cell movement may be governed by the coupling between independent oscillators: in this organism, periodic streams of small pieces of cytoplasm can become entrained to each other, which, through further modulation by attractants or repellants, supports directional
movement [78].
Recent evidence inDictyosteliumshows that Gβinteracts with Elmo, which suggests a
possi-ble direct link to the cytoskeleton bypassing the other signaling pathways [79]. We observed
oscillation of HSPC-300, a member of the actin-nucleating SCAR/WAVE complex. This may be the most upstream oscillator, with F-actin reporters and disassembly factors (e.g., Coronin)
following its dynamics. In this case, SCAR/WAVE’s relevant regulators will need to be
identi-fied [80]. Mechanistically, how could loss of Gβincrease the strength of coupling? Based on the
mechanisms through which oscillators are coupled in other systems, possible explanations include (1) increasing the density of oscillators at the periphery while keeping the coupling
range of each constant [81], and/or (2) directly increasing the range of a diffusible or
mechani-cal signal that is generated by the oscillators [26]. Our experimental data support the first
hypothesis. In strongly coupled Gβ-sequestered cells, a larger fraction of sectors contain actin
oscillators compared to Gβ-unsequestered cells or Gβ-null cells (S17A Fig). Moreover, upon
Gβsequestration, the number of membrane sectors that contain an actin oscillator increases,
while the amplitude of the oscillators remains constant (S17B Fig). Additionally, we find that
during cell polarization, oscillators largely disappear from the sides and back of the cell (S18
Fig). Taken together, our data suggest that the number or density of oscillators is regulated,
and this may be used as a mechanism to control coupling strength. Additional mechanisms could affect the firing threshold or the refractory period of the oscillators.
Our simple mathematical model helps to guide intuition on why coupling between oscilla-tors could be advantageous for polarity and directional movement. For both cases, the signals that need to be interpreted can be noisy, and in these scenarios moderate coupling between
oscillators can provide an advantage—input-coupled oscillators can“share”information to
fil-ter noise and betfil-ter entrain to an input signal. Our results are consistent with recent predic-tions in bacterial chemotaxis, in which an optimal membrane distribution of receptors balances sensitivity to spatially correlated external noise and spatially uncorrelated intrinsic
noise (which can be filtered out by a similar mechanism of local information sharing) [82].
The Benefits of Acute Perturbations: A Novel Cytoskeletal Role for G
β
Our work highlights limitations in classical genetic approaches. Genetic nulls are the most
common means of assaying gene function inDictyostelium. However, many genetic mutants
give no or mild phenotypes, and they often require combined hits in multiple signaling
path-ways to significantly inhibit chemotaxis [6,32–36]. In theory, two mechanisms can account for
this: a selection on the population levels can favor a subset of cells (potentially carrying sup-pressor mutations) that best cope with the genetic change. Alternatively, intrinsic redundancy with parallel pathways or slow compensation via negative feedback can obscure the true role of
a gene in cell behavior [42]. Such compensation enables robust function and is a widely
employed characteristic of adaptive/homeostatic systems. For example, pharmacological inhi-bition of synapses transiently inhibits signal transmission, but homeostatic mechanisms restore
function within minutes [39–41]. The motor of bacteria is another example. It compensates for
persistent changes in the level of internal signaling components to maintain the robustness of
chemotaxis [41].
Which mechanism is at play in our case? Both Gβ-null knockout and wild-type cells lack
excessive coupling of actin oscillators, albeit likely for different reasons. In wild-type cells, Gβ
suppresses the coupling, while Gβ-null knockout cells have, over time, arrived at a Gβ
indepen-dent steady state that does not support oscillations. Transformation of Gβ-null knockout cells
with the sequesterable Gβconstruct restores wild-type physiology, which can become
tran-siently unbalanced upon acute Gβsequestration. This imbalance remains for days—long
enough for us to observe its effect on oscillator coupling—but eventually the steady state of Gβ
-null knockout cells is assumed again, potentially due to compensation from parallel pathways. We favor this possibility over genetic suppression based on the speed with which oscillations disappear again after induction.
As a consequence of compensation, different modes of gene inactivation can result in strik-ingly different phenotypes. In zebrafish, gene knockdowns can produce strong phenotypes that
are masked by compensation in genetic knockouts [83]. Our data suggest that additional
phe-notypes appear when proteins become inactivated even more rapidly. Gβ-knockout and
knock-down cells have been extensively studied inDictyosteliumand other systems [43,44,84].
Although defects have been reported for a wide range of chemoattractant-stimulated responses,
including directed migration [44], these cells display normal basal polarity and actin dynamics
[2,3]. Acute sequestration was essential to uncover the role of Gβin tuning cytoskeletal
dynam-ics and initiating cell polarity. In this light, our work suggests that much can be learned by revisiting classical mutants with acute perturbation approaches, and not only in instances in which a loss-of-function mutation is lethal.
Materials and Methods
Dictyostelium Cell Culture and Sequestration Experiments
Dictyosteliumstrains were grown at 22°C in HL5 medium (ForMedium) in Nunclon tissue cul-ture dishes or in suspension in flasks shaken at 180 rpm. Cells were routinely used from
non-axenic cultures. In this case, cells were grown in association withKlebsiella aerogenes(K.a.) on
SM agar plates and used for assays when bacteria began to get cleared [85]. Growth under
these conditions gave the strongest responses to stimulation with folate, so this condition was used for most subsequent rapamycin-mediated sequestration experiments. However,
seques-tration of Gβalso induced oscillations in F-actin when cells were grown in HL-5 instead. For
imaging experiments, a scrap of cells was seeded in 200μl HL5 in a Lab-Tek II 8 well chamber
(Nunc), allowed to settle, and washed one to two times in KK2 (16.5 mM KH2PO4, 3.9 mM
K2HPO4, 2 mM MgSO4) immediately before the assay. Rapamycin (SIGMA) was freshly
pre-pared at 2μM in KK2 and added 1:1 in sequestration experiments. To render cells responsive
to cAMP (Fig 1C), aggregation-competent amoebae were prepared by resuspending washed
cells at 2 x 10⁷cells/ml in KK2, starving them for 1 h while shaking at 180 rpm, followed by
pulsing the cells with 70–90 nM cAMP (final conc.) for another 4 h. Before stimulation with
1μM cAMP, cells were basalated (shaking at 180 rpm in the presence of 5 mM caffeine for 20
min) with or without 5μM rapamycin, washed in ice-cold KK2, and kept on ice until
stimula-tion. For analysis by western blotting, samples were resolved on 4%–15% SDS-PAGE gels.
After electrophoresis, proteins were transferred to PVDF membrane and probed with anti—
detect the activation loop (T309) phosphorylation of PKBR1, and anti—pan-Ras antibody
from EMD (Ab-3). Sequestration of Gβwas confirmed by fluorescence microscopy.
Constructs and Strains
PhdA-GFP, LimEΔcoil-GFP, LimEΔcoil-RFP, GFP-Arp2, Hspc300-GFP, ABD-GFP, GBD
(PAK)-YFP, Coronin-GFP, and YFP-RBD(PI3K1) have been described previously [2,5,35,86].
Standard methods of molecular biology, including reagents from Quiagen and Zyppy Plasmid Miniprep Kits from Zymo Research, were used to generate the following constructs:
SRC-YFP-FRB (pHO34) was assembled in pDXA-YFP by subcloning FRB (XhoI/XbaI) from pOW578 with a synthetic sequence (HindIII/Nsi1) encoding the myristoylation tag from SRC. cAR1-RFP-FRB (pHO39) was assembled in pDXA-YFP by replacing YFP with a fragment con-taining cAR1-RFP (HindIII/XhoI) and adding amplified FRB (XhoI/XbaI).
Calnexi-nA-CFP-FKBP (pHO232) was assembled in multiple steps. CalnexinA was amplified from a
published plasmid [55] and inserted into a variant of pDXA-YFP encoding FKBP (pHO167) or
CFP and FKBP (pHO232). A Gateway-compatible vector derived from pDM448 [87] encoding
FRB-RFP was generated (pHO436), into which Gβwas inserted with an LR reaction to build
FRB-RFP-Gβ(pHO536). A tetracycline-inducible variant of GFP-Rac1AV12 (pHO578) was
built by enzymatic assembly (Gibson) in pDM369 [87].
To generate stable cell lines, cells were transformed by electroporation (Genepulser Xcell,
Bio-Rad) using 10–20μg DNA per 4x10⁶cells (100μl) in 1 mm cuvettes (Bio-Rad). Two
conse-cutive pulses with a 5-s recovery period between were delivered at 750 V, 25μF, and 50 Ohm.
For overexpression, cells were plated in bulk and selected with G418 (10μg/ml) and/or
hygro-mycin (50μg/ml) the next day.
The time course of inducible sequestration (Fig 1B) was benchmarked in strain HO543: A
Gβ-null strain (LW6) derived from DH1 [44] was used as the base strain into which the
seques-tration system was engineered. First, pHO536 (FRB-RFP-Gβ) was introduced, and
transfor-mants were selected with hygromycin (50μg/ml) to giveHO535. This strain was then
transformed with pHO167 (calnexinA-YFP-FKBP) to giveHO543or simultaneously with
pHO232 (calnexinA-CFP-FKBP) and LimEΔcoil-GFP to giveHO547, with pHO232 and
phdA-GFP to giveHO548, with pHO232 and pOH250 to giveHO549, and with pHO232 and
PAK(GBD)-YFP to giveHO630. Additional anchors, such as a NLS or the transmembrane
domain of Miro, were tested, but yielded poor depletion of Gβ. Transformants were selected
with G418 (10μg/ml). When appropriate for comparison, parent strains DH1 expressing
LimEΔcoil-GFP (HO618)or LW6 expressing LimEΔcoil-RFP (HO595) were analyzed. The
fol-lowing strains were used to control for the effect of rapamycin mediated recruitment: DH1
expressing LimEΔcoil-GFP, pHO232 and pHO39 (HO620; G418 resistant), Ax2 (Kay lab)
expressing LimEΔcoil-RFP, pHO232 and pHO34 (HO621; G418 resistant) and Ax2 (Kay lab)
expressing LimEΔcoil-GFP, pHO232 and pHO536 (HO626; G418 and hygromycin resistant).
For dual color oscillation experiments (Fig 5B), Ax2 (Kay lab) cells expressing LimEΔcoil-RFP
together with GFP-Arp2 (HO632), Hspc300-GFP (HO634), ABD-GFP (HO638), or
Coronin-GFP were analyzed.
Microscopy
A spinning disc Nikon Eclipse Ti fitted with a spinning disc head, 405 nm, 488 nm, and a 561 nm laser line and appropriate emission filters were used to record CFP, RFP, and GFP (or YFP) double- or triple-labeled cells at room temperature. Images were routinely recorded using a 60x (1.45 NA) objective, a Clara Interline CCD camera (Andor Technologies), and NIS Elements software. After analysis, when necessary for presentation, contrast was adjusted uniformly using
ImageJ or Photoshop, and to image sets of some experiments a uniform Gaussian Blur was
applied. To quantify oscillations, a single two- or three-channel image was taken to assess Gβ
sequestration, followed by a 2-min movie (1 frame/second) to record behavior in the reporter channel at the lowest laser intensity necessary for reasonable signal-to-noise. Longer imaging periods (10 min) and/or adjustment of the focal plane close to the coverslip were used when necessary (e.g., to record individual oscillating foci or alternating polar and apolar states).
Drug Treatments
ForFig 5, Ax2 cells expressing LimE-RFP were analyzed for 2 min (1 frame/second)
immedi-ately before and for 2 min (within 5 min) after applying perturbations. For Gβsequestration,
only oscillating cells (strainHO547) were considered. Ca2+and ionomycin were used at 10 mM
and 10μM, respectively. For triple drug inhibition, Bromoenol lactone (BEL 5μM) was washed
out after 5 min of treatment, after which acute application of LY294002 (50μM) together
with pp242 (40μM) followed. BEL and LY294002 have been demonstrated as effective
inhibi-tors of PLA2 and PI3K inDictyosteliumbefore [38]; pp242 is an inhibitor of TOR kinase and
inhibits TORC2-mediated phosphorylation events inDictyostelium(S19 Fig). Expression of
tet-on GFP-Rac1A(V12), was induced overnight with 100μg/ml doxycycline. The effect on
oscillating, Gβ-sequestered cells was additionally tested by treatment with U73122 (5μM),
EGTA (10 mM), and Ca2+(10 mM).
Electrotaxis Experiments
The electric fields were applied as previously described for vegetativeDictyosteliumcells [88]
by usingμ-Slides (Ibidi). These tissue-culture-treated slides with small cross-sectional area
pro-vide high resistance to current flow and minimized Joule heating during experiments. To elimi-nate toxic products from the electrodes that might be harmful to cells, agar salt bridges made
with 1% agar gel in Steinberg’s salt solution were used to connect silver/silver chloride
elec-trodes in beakers of Steinberg’s salt solution to pools of excess developing buffer (5 mM
Na2HPO4, 5 mM KH2PO4, 1 mM CaCl2, and 2 mM MgCl2, pH 6.5) [89] at either side of the
chamber slide. EF strength is empirically chosen (~10V/cm) based on our previous experience
[90] and measured by a voltmeter before and after each experiment. Fields ofHO547cells were
chosen based on the presence of Gβand anchor expressing cells, which were distinguished by
fluorescence imaging (see Microscopy section for details). High-definition DIC movies (1 frame/30 s) were recorded at room temperature for at least 30 min after the electric field was switched on. To quantify directionality and speed, time-lapse images were imported into
Ima-geJ (http://rsbweb.nih.gov/ij). Tracks were marked by using the MtrackJ tool and plotted by
using the Chemotaxis tool described [91]. All experiments were repeated and produced similar
results. Data are combined and presented as means +/- SEM (standard error). To compare
group differences, unpaired, two-tailed Student’sttest was used. Ap-value of less than 0.05 is
considered significant.
Folic Acid Chemotaxis Experiments
HO543, DH1, or LW6 (Gβnull) cells were grown in HL5 medium containing 20μg/ml G418
and 50μg/ml hygromycin. Two days before the experiment, 2x10⁵cells were mixed with an
overnight culture of K.a. in 250μl streptomycin-free HL-5 medium and plated on an SM agar
plate. On the day of the experiment, cells were washed off the SM plate with DB buffer, washed
once, and resuspended in DB at 2x10⁷cells/ml. Suitable amount of cells were transferred to
LabTek II chambered coverglass (Nalge Nunc) containing DB with 5μM rapamycin and 0.05%
mM folic acid were used. Microscopy for this set of experiments was carried out with a Nikon Eclipse TiE microscope illuminated by an Ar laser (YFP) and a diode laser (RFP). Time-lapse images in bright field, YFP, and RFP channels were acquired by a Photometrics Evolve EMCCD camera controlled by Nikon NIS-Elements. Tracks of cell migration were analyzed in ImageJ to obtain directedness and speed of cells.
Automated Identification of Cells and Subcellular Regions
For all other analyses, cells were identified, tracked, and processed to extract various properties (e.g., cytoplasmic fluorescence, membrane fluorescence, extent of polarization, angle of polari-zation) using custom code written in Matlab. First, initial locations for each cell were provided by hand-drawn masks such that each mask contains a single cell at the first timepoint. At each subsequent timepoint, each cell was tracked by extracting a 100x100 pixel box centered at that
cell’s prior location in the LimE-GFP fluorescent channel. To identify the cell within this
box region, interior pixels were separated from background intensity using a fixed intensity threshold, followed by binary erosion with a single-pixel structuring element (to remove iso-lated noncell pixels) and a hole-filling operation (to fill all pixels within the cell). The largest connected component within this image was assumed to be the cell.
For each cell and at each timepoint, we extracted the following features:
• Centroid: The“middle”of the cell
• Center of mass: The intensity-weighted center of mass of the LimE-GFP channel (e.g., cells
with a bright actin pole would have a center of mass biased toward the pole).
• Cytoplasmic intensity: The mean LimE-GFP intensity was extracted from a disk with a radius
of 10 pixels, centered at the cell’s centroid.
• Cell membrane: From a cell’s mask at each timepoint, we subtract a mask that has been
eroded by a disk of radius 5 to identify a 10-pixel-wide“rim”around the cell.
• Membrane sector intensity: By extending lines from the cell’s centroid in 10-degree
incre-ments, we subdivided the cell into 36 equal-angle regions. The intensity was then measured in a region formed by their intersection with the previously identified membrane region. The sector size was chosen because it was sufficiently small to be unlikely to contain multiple foci; doubling the number of sectors did not qualitatively change our results.
• Gβ-anchor correlation: To measure the extent of sequestration of Gβto the ER at each
time-point, we computed the correlation of all cellular pixels (including both membrane and
cyto-plasm) between the Gβand ER channels using each cell’s mask as described above.
Identifying Cytoplasmic Oscillation
To identify which cells in a population were oscillating and characterize the timescale of
oscilla-tion, we turned to a Fourier approach (for the analyses of Figs3and4). We found that the
cyto-plasmic LimE-GFP levels undergo strong, regular periodic fluctuations. From each cytocyto-plasmic intensity timecourse, we subtracted a 30 s moving average to center cytoplasmic fluctuations on a mean value of zero (eliminating intensity fluctuations during cell movement or photo-bleaching) and computed the discrete Fourier transform of this mean-centered signal. Cells
were then marked as“oscillating”if any sampling frequency between 0.05 and 0.2 Hz
con-tained at least 10% of the cytoplasmic signal’s total power (seeS4 Figfor oscillating and
nonos-cillating representative cells). These frequencies correspond to periods ranging from 5 to 20 s,
which covered the range of frequencies we observed in a preliminary analysis across more than
50 oscillating cells. Each cell’s oscillation frequency was then taken to be the sampling
fre-quency at which the power was maximal.
Analysis of Dual Reporter Movies
To understand how cortical LimE dynamics relate to those of other cytoskeletal factors, we sought to correlate LimE-RFP with other reporters (GFP fusions to HSPC300, Coronin, the ABD actin binding domain of ABP120, and Arp2). To identify cells expressing both LimE and
a second reporter, we thresholded cells using both GFP and RFP fluorescence. The cell’s cortex
was identified as a 5-pixel-wide shell of this thresholded image for each cell. To compute the
intensity of cytoskeletal foci around the cell’s cortex, we then subdivided the cortex into 36
equal-angle segments (sweeping out 10 degrees each) and measured the fluorescence intensity in both the GFP and RFP channels.
We then sought to compare the temporal dynamics of GFP and RFP in each spatial region from each cell. To do so, we calculated the cross-correlation between these two channels. For uncorrelated cytoskeletal factors (e.g., myosin, paxillin), we found that dynamics in GFP and RFP were uncorrelated, leading to a low-magnitude, flat cross-correlation. For correlated cyto-skeletal factors (e.g., HSPC300, Coronin, Arp2, and the actin binding domain ABD), the cross-correlation peaked at the characteristic delay time between LimE and that particular cytoskele-tal factor. We estimated this delay time by fitting a Gaussian distribution to the
cross-correla-tion to identify the locacross-correla-tion of this peak—the resulting delay times are shown inFig 5B.
Measuring Polarization and Identifying Polarized and Unpolarized Time
Periods
From the centroid and center of mass measurements described above, the direction and extent
of polarization was determined by computing the vector between the center of mass (~c) and
centroid (~n).
~p¼~c~n
The magnitude of~pdescribes the extent of polarization, while its direction reflects the pole’s
orientation.
We were also interested in identifying periods of time in which cells exhibit long-term,
sta-ble polarization (for the analyses ofFig 7). By inspecting many cell trajectories, we found that
stable polarization was associated with a consistent direction of polarity—cells would retain a
pole with a similar directional orientation, and changes in direction were associated with the formation of a new pole. Conversely, during unpolarized phases, fluctuations of actin around
the membrane would lead to frequent changes in the direction of~p(S14 Fig; lower panels).
Thus, we implemented a greedy search algorithm tofind continuous periods of time when the
angle of polarization was contained in a 1-radian window and lasted at least 25 s, and measured
the number and duration of these polar regions for each cell (S14 Figshows two representative
cells).
Computing Hilbert Transform; Instantaneous Phase and Period
To assess the synchrony of oscillation between different membrane regions of a cell, we set out
to measure each region’s oscillation phase at each timepoint. The phase of oscillation describes