Fiabilitate si Durabilitate - Fiability & Durability No 1/ 2016 Editura “Academica Brâncuşi” , Târgu Jiu, ISSN 1844 – 640X 67
SOME STATISTICAL SOFTWARE APPLICATIONS FOR TAGUCHI
METHODS
Dr.ing. Adrian Stere PARIS, Univ. Politehnica Bucharest, email: [email protected]
Abstract The paper details the variety of Taguchi methods, as important contribution to the quality improvement. The extended use of these methods imposes more and more complex calculi for the practical application and optimization. It should be necessary to benefit by the new software developments, assisted by the advanced statistical methods. The paper presents a few particular applications of some statistical software for the Taguchi methods as a quality enhancement insisting on the quality loss functions, the design of experiments and the new developments of statistical process control.
Key words: Taguchi methods, software applications
1. Introduction
The Taguchi philosophy is a guide and reference source, with the principal goal of improving the quality of products in the industrial practice. From the practical point of view, the goal of Taguchi methods is to find a trade-off between quality loss and product price [8, 14]. The paper presents a few applications for Taguchi methods with software support, starting with the new quality loss laws, which have symmetrical and asymmetrical distributions and therefore more adequate models in the real world [17]. Many software applications approach the Taguchi’s design of experiments. New trends try to apply effectively Taguchi’s methods to the traditional statistical process control (SPC).
The methods developed by Genichi Taguchi are applied mainly to engineering, but also to many others fields like marketing and advertising. Helpful to companies in both manufacturing and service industries, Taguchi's applications provide accessible material on such topics as:
Quality loss function On-line quality engineering Signal-to-noise ratio
Robust engineering
Design of experiments (known as the "Taguchi method") Mahalanobis–Taguchi Systems (MTS), and more [2].
Fiabilitate si Durabilitate - Fiability & Durability No 1/ 2016 Editura “Academica Brâncuşi” , Târgu Jiu, ISSN 1844 – 640X 68
2. Processing Taguchi data and software packages
The use of mathematical software to modelling, mainly to analyze or numeric calculation is more and more popular with the new hardware developments. An important step forward was the explosion of mobile devices, like tablets and smart phones, making more accessible and rapid manipulation of data. More important, the new mobile operating system, Android (Google), based on the Linux kernel and designed primarily for touch screen mobile devices, has the largest deployment for those ones. The big advantage is the majority of free applications (including the mathematical and the statistical ones). MathAlly Graphing Calculator is quickly becoming the most comprehensive free Graphing, Symbolic, and Scientific Calculator for Android: it can solve equations, make a lot of graphs and even some frequent statistics like regression. For the experienced people with spreadsheets applications (MSExcel) there are similar software, like Polaris Office, a free office application to view, edit & share Microsoft Office compatible documents on the mobile device or PC. There is even a Romanian language spreadsheet (Foi de calcul, Google) with the same possibilities, making possible the cheapest solution (off line).
Of course, more complex statistical calculations need additional software offers, with the on line access: more and more universities and specialists present Free Online Statistics Calculators or more complete sites (http://stattrek.com/; http://shodor.org/, etc.). In the end there are a lot of expensive complex statistical packages (SPSS, MINITAB, OriginLab, etc.) R, a programming language and software environment for statistical computing and graphics, written primarily in C, Fortran, and R, and freely available becomes very popular in the last years.
3. Regression and curve fitting for Taguchi’s loss function
Regression is a conceptually simple technique for investigating functional relationship between output and input decision variables [10].
All the important statistical packages offer a regression module [7], but there are also low cost solutions, suggested in [6].
Fiabilitate si Durabilitate - Fiability & Durability No 1/ 2016 Editura “Academica Brâncuşi” , Târgu Jiu, ISSN 1844 – 640X 69
The use of computer aided processing of experimental data opened new opportunities to develop the basic simple three forms of loss functions. The start-up was achieved with the asymmetric loss functions, using Pareto, generalized Pareto, and beta pattern [3, 12], adapted hyperbolic cosine model (Fig.1a), shifted generalized gamma (Fig.1b), etc. [17].
The next step was the introduction of response surface methodology and the multivariate loss functions [3, 12, 16, 18, 19]: the applications in quality control is illustrated by an example to improve the overall quality of a printing machine in applying coloring inks on package labels [4, 19]. The primary data from [4] are represented in Figure 2.
A computer aided regression for the fitted hyper plane of the bivariate loss function L(y1, y2), results as the positive definite quadratic form with interactions (Fig. 3) [19]:
L(y12,y22,y1y2)=0,0256y12+55,8 y22+0,60y1y2
Fig. 2 The response surface with the initial data Fig.3 A quadratic loss function [19]
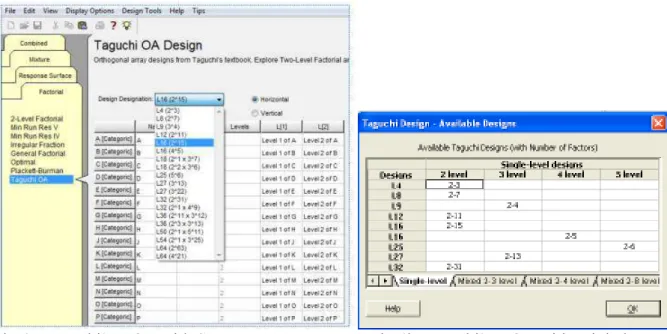
4. Software solutions for Taguchi’s design of experiments
Fiabilitate si Durabilitate - Fiability & Durability No 1/ 2016 Editura “Academica Brâncuşi” , Târgu Jiu, ISSN 1844 – 640X 70
Fig.4a Taguchi’s DOE with Stat-Ease Fig.4b Taguchi’s DOE with Minitab
The application of Taguchi method for optimizing turning process by the effects of machining parameters is presented in fig. 4d for the cutting of EN24steel [15].
Fiabilitate si Durabilitate - Fiability & Durability No 1/ 2016 Editura “Academica Brâncuşi” , Târgu Jiu, ISSN 1844 – 640X 71
Fig.4d Analyses Taguchi Design-Option [15]
5. Taguchi’s loss function and SPC
If should be used Taguchi`s quality loss function nominal-the-best, overlapping the control chart for mean, respectively the monetary value of loss, this is far more suggestive as the dimensional deviations for controlling process variability. [9].
An algorithm was developed for the optimization design of control charts based on the probability distribution of the random process shifts (e.g. mean shift). The design objective was to minimize the overall mean of Taguchi’s loss function per out-of-control case (denoted as ML) by adjusting the sample size, sampling interval and control limits of the chart. The comparison studies show that the ML chart is significantly superior to the Shewhart control chart in view of overall performance [20].
The in-control and out-of-control costs can be easily found after examining the figure 5 (the loss function as dotted line). It can be seen that any deviation from the target value will incur a cost even if it was within the control limits [1].
Fiabilitate si Durabilitate - Fiability & Durability No 1/ 2016 Editura “Academica Brâncuşi” , Târgu Jiu, ISSN 1844 – 640X 72
A CUSUM control chart detecting process shifts in the mean value through minimizing the overall mean value (ML) of a Taguchi’s loss function over the probability distribution of the random process mean shift (fig.6) is described in [5].
6. Conclusions
A concise overview of Taguchi’s methods and statistical software is presented in this paper with extension to specialized software solutions. A final choice for adequate software for quality data processing should consider the customer conditions for experience, data volume and necessary investment, starting with spreadsheets to the complex statistical software, with the new developments for smart phones, based on the new mobile operating system, Android.
For small data samples and less details it is cheap to use low cost or freeware/shareware software packages. New trends try to apply effectively Taguchi’s methods to the traditional statistical process control (SPC).
5.References
1.Al-Ghazi A., Al-Shareef K., Duffuaa S. O., (2007), Integration of Taguchi's Loss Function in the Economic Design of x Control Charts with Increasing Failure Rate and Early Replacement, Proceedings of IEEE International Conference on Industrial Engineering and Engineering Management, Dec., ed. Curran Associates, Inc., Singapore, pp.1209-1215.
2. Dehnad, K., (1989) Quality Control, Robust Design, and Taguchi Method, Ed. Springer 3.Demetrescu, M., Paris, A.S. , Tarcolea, C., (2008),- Loss Functions with Interactions and Practical Application Proceedings of the 10th WSEAS Int. Conference on
MATHEMATICAL and COMPUTATIONAL METHODS in SCIENCE and
ENGINEERING (MACMESE'08) Bucharest, Romania, November 7-9, Mathematics and Computers in Science and Engineering, Published by WSEAS, pp. 296-299
4. Demetrescu, M., Paris A.S. , Tarcolea C., (2010),Uni-and multivariate loss functions and the Taguchi theory, BSG PROCEEDINGS 17, (DGDS-2009) Oct. 2009, Bucharest, Geometry Balkan Press, pp. 79-83
5. Jiao R. J., Helo P. J., (2008), Optimization design of a CUSUM control chart based on Taguchi’s loss function, The International Journal of Advanced Manufacturing Technology, Springer Verlag, Berlin, February, Volume 35, Issue 11, pp 1234-1243
6. Paris A.S., (2012), Statistik Anwendungen in Ingenieurwissenschaften- eine starke Innovationsunterstützung, “Interdisciplinary approach of innovation as a progress factor” Proc. 1th Intl. Sc. Conf. Buc., Ro., 7th Dec., FILS, UPB, Ed. Printech pp. 15-20
7. Paris, A., S. – (2011), Software applications for field reliability data, 4th Symposyum
„DURABILITY AND RELIABILITY OF MECHANICAL SISTEMS” Univ C. Brancusi, mai
2011, Fiability and Durability, no. 1(7), Ed.Acad., Tg. Jiu, p.75-80
Fiabilitate si Durabilitate - Fiability & Durability No 1/ 2016 Editura “Academica Brâncuşi” , Târgu Jiu, ISSN 1844 – 640X 73
9. Paris, A. S. – (2012), An overlap proposal between statistical process control and
Taguchi’s quality loss function, Proceedings of the 12th International Conference on Technology and Quality for Sustained development TQSD Ed. Printech, Buc, pp 86-89
10. Paris, A, . S., Târcolea, C. , Regression models applied to manufacturing systems, (2010), Proceedings in Manufacturing Systems, Editura Academiei Române, vol.5, nr.4, pp. 249-253.
11. Paris, A.S., Târcolea, C. (2004), Taguchi Applications on Manufacturing Systems; Editura Academiei Romane International Conference on Manufacturing Systems - ICMaS 2004 08-09.10.2004 UPB, Romanian Journal of Technical Sciences APPLIED MECHANICS, Proceedings of the International Conference on Manufacturing Systems, ICMAS'2004, vol. 49, n° Special, pp.459-462.
12. Paris, A.S., Târcolea, C. (2010) Loss functions used in the quality theory 3rd Symposyum „Durability and reliability ofmechanical sistems” Univ C Brancusi Tg. Jiu 13. Roy R. K., (2001), Design of Experiments Using the Taguchi Approach: 16 Steps to Product and Process Improvement, A Wiley-Interscience publication, Editor John Wiley & Sons,
14. Taguchi G., Chowdhury S., Wu Y., (2004), Taguchi's Quality Engineering Handbook, John Wiley,
15.Taneja K.J., Bector M., Kumar R. (2012) Application of Taguchi Method for Optimizing Turning Process by the effects of Machining Parameters, International Journal of Engineering and Advanced Technology (IJEAT) Volume-2, Issue-1, October 2012, pp. 263-274
16. Târcolea, C., Paris, A. S., (1995), Modele bidimensionale de tip Taguchi. In: Managementul Industrial, an 3, nr.1-2,.pp.58-62
17. Târcolea, C., Paris, A. S., (2011), Loss functions used in the quality theory, U.P.B. Sci. Bull. Series A, Vol. 73, Iss. 1, , ISSN 1223-7027, pp 45-54
18.Târcolea, C., Paris, A.S., Drăgoi, G. (1997), Etude de la qualite dans la phase de conception -modele de type Taguchi multidimensionel. In vol.: Les cahiers des enseignement francophones en Roumanie: Module d'enseignment francophone "Conception integree des systemes mecatroniques intelligentes" -UPB oct., pp.124-130.
19.Târcolea, C., Paris, A.S., Sylvan, D., (2014), Loss Functions and Taguchi Theory, The 7-th International Conference of Differential Geometry and Dynamical Systems, ( DGDS-2013),
BSG Proceedings 21, Geometry Balkan Press, pp. 175-180,
http://www.mathem.pub.ro/proc/bsgp-21/K21-ta-846.pdf
20. WU Z., SHAMSUZZAMAN M., PAN E. S., (2004), Optimization design of control
![Fig. 2 The response surface with the initial data Fig.3 A quadratic loss function [19]](https://thumb-eu.123doks.com/thumbv2/123dok_br/18354085.353386/3.892.140.765.438.667/fig-response-surface-initial-data-fig-quadratic-function.webp)