ISSN 2179-8087 (online)
Original Article
Conservação da Natureza
Creative Commons License. All the contents of this journal, except where otherwise noted, is licensed under a Creative Commons Attribution License.
Incoming Longwave Radiation Evaluation for the Legal Amazon
Using HadRM3 and Geostatistic Theoretical Models
Paulo Eduardo Teodoro
1, Rafael Coll Delgado
2, Jose Francisco Oliveira-Junior
3,
Givanildo Gois
4, Fernanda Tayt’Sohn
11Universidade Federal de Mato Grosso do Sul – UFMS, Chapadão do Sul/MS, Brasil 2Universidade Federal Rural do Rio de Janeiro – UFRRJ, Rio de Janeiro/RJ, Brasil
3Universidade Federal de Alagoas – UFAL, Maceió/AL, Brasil 4Universidade Federal Fluminense – UFF, Volta Redonda/RJ, Brasil
ABSTRACT
Incoming longwave radiation was estimated using air temperature data from the output of the regional HadRM3 model in the Intergovernmental Panel on Climate Change’s (IPCC) A2 scenario for projections up to 2070, 2080 and 2090 and using Swinbank’s equation. Spatial distribution was done by Ordinary Kriging through three theoretical mathematical models for the IPCC A2 scenario for the whole Legal Amazon. It was found that the highest averages and outliers occurred in 2090 compared to other years evaluated. The average incoming longwave radiation for 2070, 2080 and 2090 was 394.8, 403.9 and 413.0 Wm-2year-1, respectively. The coefficients
of variation (CV) were higher for 2080 (2.6%) and 2090 (2.8%), similar to the results found by standard deviation. 2070 obtained CV (2.2%) for estimated values of incoming longwave radiation with greater accuracy. Again, 2070 was the only year that could be interpolated because the average degree of spatial dependence found for all models was 12.23%. Lastly, 2080 could only be interpolated using the Gaussian model in the Legal Amazon.
1. INTRODUCTION
The relevance of the variability of incoming longwave radiation can be justified in several ways, as being important for: (1) Surface Energy Balance (SEB); (2) Numerical Weather Forecasting (NWF); (3) simulations carried out at several different scale models; (4) the global radiation balance; (5) climate studies; (6) agrometeorological studies (predictions for night frosts, mist, air temperature variation and cloudiness in a particular region); (7) other applications (Iziomon et al., 2003; Aguilar et al., 2015; Morcrette, 2002; Ma et al., 2014). Incoming longwave radiation is surely the most difficult component of the radiation balance to measure. One significant reason is that the pygmometer emits radiation at wavelengths and intensities comparable to those that it seeks to measure, which creates a need for correction (Liou, 2002).
The Amazon is the region encompassed by the Amazon River basin, the most extensive in the world, comprising 25,000 Km of navigable rivers, in about 6,900,000 Km2, of which approximately 3.8 million
Km2 are in Brazil. The Legal Amazon, established
in Article 2 of the Law nº 5.173, October 1966, covers the states of Acre, Amapá, Amazonas, Mato Grosso, Pará, Rondônia, Roraima, Tocantins, part of Maranhão and five municipalities of Goiás. It is represents 59% of the Brazilian territory, distributed over 775 municipalities, where 20.3 million people (12.32% of the national population) were resident in 2000, with 68.9% of this contingent being in urban areas (IBGE, 2015).
In this context, it is important to understand the dynamics of the region, as well as the mechanisms that interact with incoming longwave radiation and its relationship to forest functioning (Satyamurty et al., 2010; Almeida et al., 2017). Incoming longwave radiation monitoring, in this region, requires spatially well-distributed, high density automatic weather stations (AWS) with an operating pygmometer. Currently, the AWS does not possess such equipment, and consequently, there is no measurement of incoming longwave radiation (Vilani et al., 2010; Aguiar et al., 2011). Recently, Aguilar et al. (2015) showed that the difficulty for data collection is due to the price of the equipment and its calibration. Despite
this, some studies have been developed in the region, such as Vilani et al. (2010) and Aguiar et al. (2011). However, these studies only estimate the variable over the time scale, and are not being spatialized using geostatistics.
Conventional weather stations (CWS) and AWS coming from the Instituto Nacional de Meteorologia (INMET) still present many flaws in the data series, which in turn also harm the estimate of incoming longwave radiation in the region by way of in situ. Additionally, the Amazon region is extensive and is difficult to access due to dense forest areas. It therefore contains a low number of weather stations, which can cause significant uncertainty when trying to understand the different processes related to dynamic climate mechanisms and their spatial variability.
The United Nations Environment Programme (UNEP), and the World Meteorological Organization (WMO) established the Intergovernmental Panel on Climate Change (IPCC, 2007a, b) in 1988. The Assessment Report presented different CO2 emission scenarios, containing the A2 (high emission, pessimistic) and B2 (low emission, optimistic) scenarios. Currently, climate changes and their projections point to an average increase in air temperature of up to 4.0 °C. Therefore, in the context of changes occurring in the climate, many researchers from different regions around the world have used several numerical models. Particularly, Coupled Model Intercomparison Project Phase 5 (CIMP5) used by Zomer et al. (2014) in Yunnan Province, China and the regional model HadRM3 used in Europe and India (PRECIS, 2002) and, lastly, in the Western Amazon region (Justino et al., 2013; Delgado et al., 2014).
There are few studies to estimate the incoming longwave radiation based on existing equations in the literature, especially for the Amazon region in the spatial and temporal scales. Additionally, using future scenarios adopted by the IPCC there are still no scientific studies of the region. Given this, the present study aims i) to calculate and spatialize the incoming longwave radiation using Ordinary Kriging method (geostatistics) based on Swinbank’s (1963) equation; the output of the regional HadRM3 model for air temperature from the IPCC’s A2 scenario, for the Legal Amazon was used, in the annual periods 2070, 2080 and 2090; and ii) interpolation method evaluations of the mathematical transitive theoretical models for incoming longwave radiation.
2. MATERIAL AND METHODS
2.1. Study area
According to Köppen’s classification, the Amazon region shows climate type A, with three subclimates: rainy equatorial (“Af ”), the monsoon tropical (“Am”) and the dry and wet tropical (“Aw”), with the monsoon tropical covering most of the region. According to Figueroa & Nobre (1990), the average air temperature presents no large-scale variation, which is due to high levels of solar radiation throughout the year. Average
air temperature values are between 24 to 26 °C with an annual range from 1 to 2 °C. The average rainfall in the Amazon region is approximately 2,300 mm.year-1.
The rainy season is between November and March, and the dry season is between May and September. The months of April and October are months of transition between regimes (Satyamurty et al., 2010; Almeida et al., 2017).
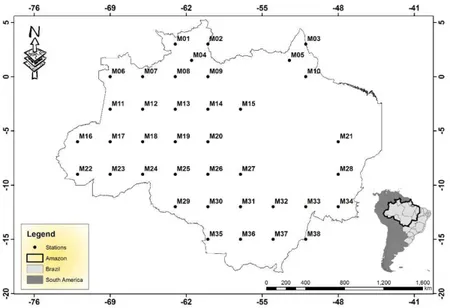
The studied case presents a grid of 38 points, which represent the grid points of the HadRM3 model in the Amazon. It has a 50 Km spatial resolution with 19 levels in the atmosphere (from the surface to 30 Km into the Stratosphere) and 4 levels into the soil. Additionally, it has full representation of the physical processes of the atmosphere and the earth’s surface, and includes the sulfur cycle (S). This grid, the air temperature data were extracted grid points of HadRM3 model on the Amazon (Figure 1). We used daily air temperature data, which were converted into yearly values. These data were extracted from the model output for the future A2 scenario (2070, 2080 and 2090) in Legal Amazon.
2.2. HadRM3 model
The Hadley Centre Regional Model Version 3 is a configuration of the HadCM3 model designed to provide high-resolution climate simulations of limited areas. It is based on the atmospheric component of HadCM3 with some modifications for the physical model. HadRM3
is typically configured with a horizontal resolution of 0.44 degrees of latitude and 0.44 degrees of longitude (approximately 50 Km) and uses a 5-minute time step to maintain numerical stability. The model was designed to take boundary conditions from coarser global resolution model simulations, in this case HadAM3, and provides a higher spatial resolution of the local topography and more realistic simulations of fine-scale climate features. The HadRM3 model was first used by the Hadley Centre for the UK Climate Impacts Programme 2002. It was subsequently used for a number of other high-resolution regional climate simulation studies, including a number of ensemble projects.
2.3. Calculation of incoming longwave
radiation
The interrelationship between the air temperature variables and incoming longwave radiation was determined using Swinbank’s equations (1963), which is physically substantiated. Therefore, the calculation of annual incoming longwave radiation can be obtained by Equation 1 (Swinbank, 1963).
6 6
9.2 10
in
L = x −σT (1)
wherein, σ is Stefan-Boltzmann’s constant (5.6697. 10-8
W.m-2.K-4) and T is the average air temperature (K) of
the 38 points of the Legal Amazon obtained from the HadRM3 model. The estimate has a probable error of less than 5 W.m-2, according to Swinbank (1963).
2.4. Geostatistical analysis
The spatial interpolation method used to analyze and calculate the spatial distribution of incoming longwave radiation for the Legal Amazon was the Ordinary Kriging (OK). Unlike other spatial interpolation methods, Kriging estimates a spatial covariance matrix to determine the weights attributed to different samples, data redundancy, the neighborhood to be considered in the inferential procedure and the error associated with the estimated value (Goovaerst, 1997).
In this study, we adopted the OK, which allows the calculation of averages sites, limiting the average stationary domain to a local neighborhood centered on the point to be estimated. According to Felgueiras (2001), quota z values are estimated using unobserved spatial coordinates (xj, yj), without the need to know
the stationary average (μ), from a linear combination of the values of a local sampling subset. The OK estimator is given by Equation 2:
( )
1
( , ) ( , ) * ( , )
n j
j j i j j i i i
z x y λ x y z x y
=
=
∑
(2)wherein, is the quota in position (xj, yj) and λi (xj, yj), the OK weight to the specified quota.
For the geostatistical analysis of interpolated data from incoming longwave radiation, we adopted three mathematical transitive theoretical models (Spherical, Exponential and Gaussian). Further details on transitive theoretical models can be found in Gois et al. (2015).
For analysis and selection of the theoretical mathematical model that best fit the experimental semivariogram, we used the Degree of Spatial Dependence (DSD %) and the errors attributed to each model. DSD is calculated by Equation 3:
0 0 C DSD 100 C C = × + (3)
wherein C0 = intercept or nugget effect; C0 + C = level and C = contribution.
The methodology proposed by Cambardella et al. (1994) was adopted in this study wherein a DSD ≤ 25% of the data possesses strong spatial dependence, DSD between 25 and 75% shows moderate spatial dependence, DSD ≥ 75% presents weak spatial dependence, and, finally, a DSD = 100% presents a spatially independent variable. In this case, it has a semivariogram with pure nugget effect. Besides the DSD, the error attributed to each model was adopted as a criterion to select the best model, according to the Equation 4:
( ) n 2 i i i 1 O X RMSE n = −
=
∑
(4)wherein, RMSE (W.m-2.year-1) is Root Mean Square
Error; Oi is equal to the observed values of incoming longwave radiation (W.m-2.year-1); X
i is equal to the
estimated values of incoming longwave radiation (W.m-2.year-1) and n is equal to number of data.
The coefficient of variation (CV, %) is given by Equation 5:
100
S
CV x
x
= (5)
3. RESULTS AND DISCUSSION
3.1. Data analysis
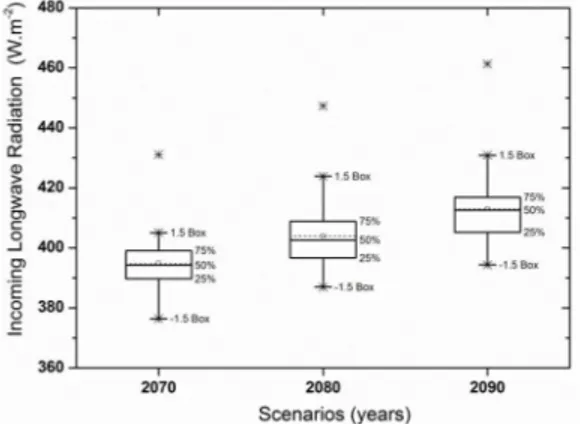
In Figure 2 and Table 1, the exploratory (boxplot) and descriptive (average, maximum, minimum, standard deviation, variance and coefficient of variation) analyses of incoming longwave radiation data for the IPCC A2 scenario in Legal Amazon is presented. The presence of outliers was observed for all years, with the highest averages and outliers occurring in 2090 in comparison with the other years evaluated. These high values are correlated with high Greenhouse Gas Emissions (GHG) and increasing the air temperature in the pessimistic A2 scenario adopted by the IPCC. Discrepant values found in the study showed that they behave differently in relation to that presented by the majority of values estimated by Swinbank’s (1963) equation through the HadRM3 model output. Lower average values for incoming longwave radiation were found in 2070 (394 W.m-2.year-1). In the global solar radiation results
obtained by Delgado et al. (2014) in the State of Acre, northern Brazil, a significant increase between
simulated years, calculated for both IPCC scenarios was also found, which is explained by the significant changes in the CO2 concentration in the A2 scenario.
In the numerical simulations of the HadRM3 model to estimate incoming longwave radiation for 2080 and 2090, the highest standard deviations were found. This indicates that the estimated values show a large spread, unlike 2070 which presented a low standard deviation, which in turn indicates that the estimated values of the incoming longwave radiation tend to be near the average and present lower dispersion (Table 1), followed by the CV values that were higher for 2080 (2.6%) and 2090 (2.8%), respectively. The high CV values for 2090 demonstrated the existence of a considerable increase in the variable air temperature in the study area, which in turn is the input variable in Swinbank’s equation (1963). This is due to the maximum GHG concentration and abrupt increase in average air temperature global/regional simulated by the HadRM3 model. Vilani et al. (2010) found similar results based on Swinbank’s (1963) equation.
3.2. Semivariogram
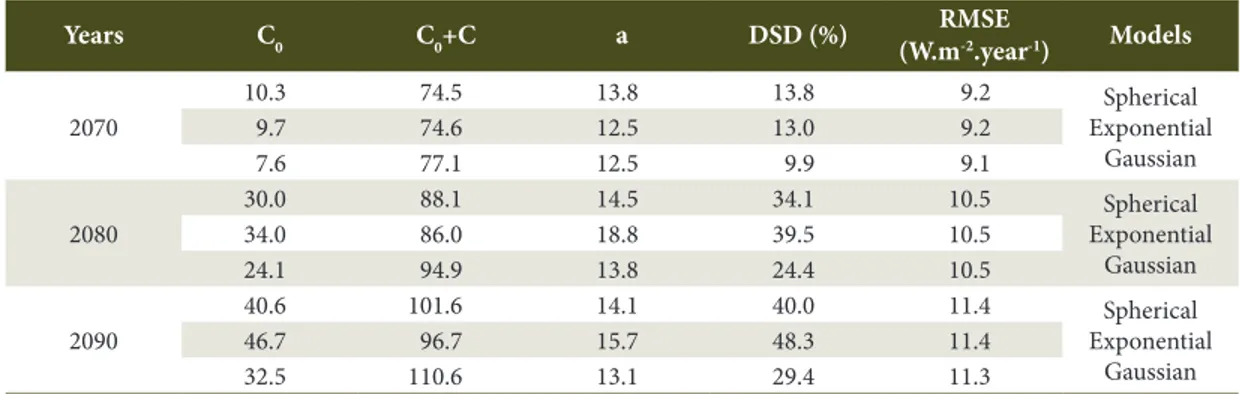
2070 presented the lowest DSD and RSME values, regardless of the transitive theoretical model used (Table 2). This year, the Gaussian model obtained the best DSD (9.9%) and RSME (9.1 W.m-2.year1) values.
For 2080, the transitive theoretical models were the same with respect to RSME (10.5 W.m-2.year-1), however
the Gaussian model was the only one which showed a strong spatial dependence (DSD = 24.4%). The other models (spherical and circular) showed moderate spatial dependence, precluding the spatial distribution of the results. For 2090, all transitive theoretical models showed moderate spatial dependence. Although the results found by Santos et al. (2011) are distinct, strong independence of information makes it impossible to spatially distribute the incoming longwave radiation Figure 2. Boxplot for the future A2 scenario in the
respective years 2070, 2080 and 2090 for incoming longwave radiation (W.m-2.year-1) for the Legal Amazon.
Table 1. Descriptive analysis of incoming longwave radiation (W.m-2.year-1), for the A2 scenario, for the Legal
Amazon.
Year Average
(Wm-2year-1)
Maximum (Wm-2year-1)
Minimum (Wm-2year-1)
Standard
deviation Variance CV (%)
2070 394.8 431.1 376.4 8.8 78.0 2.2
2080 403.9 447.3 387.0 10.5 109.3 2.6
for 2090 in the Legal Amazon. Wanderley et al. (2013) and Uliana et al. (2013) observed similar results, where the Gaussian model obtained the better fit for annual rainfall in the states of Alagoas and Espírito Santo, respectively.
3.3. Transitive theoretical models in 2070
By comparing the transitively interpolated theoretical mathematical models, it was firstly observed that despite sampling the grid points of the HadRM3 model, it did not cover a good grid (Figure 3). The difference of the interpolated maps of incoming longwave radiation by OK for the three models for 2070 was evaluated. Spatial variability of incoming longwave radiation in the studied region was observed, due to low RMSE and the closeness of DSD values for each interpolated model. In this study, the highest estimated values of incoming longwave radiation were found in the southwest-northeast direction (SW-NE) in the order of 400 W.m-2.year-1, while the lowest values were
observed in the West (W), Northwest (NW), South (S) and East (E) regions with approximate values of 390 W.m-2.year-1. According to Herrero & Polo (2012),
the acquisition of this information is important because the incoming longwave radiation controls temperature rates near the surface.
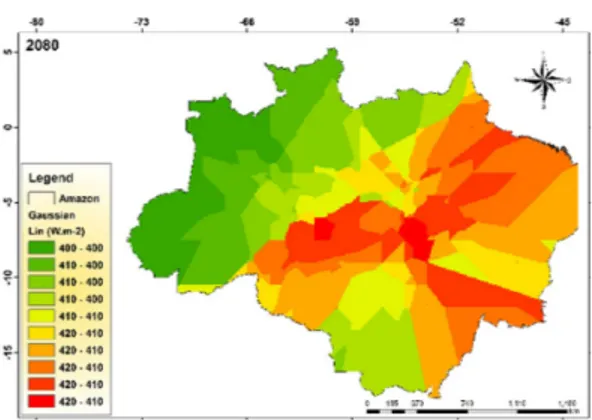
3.4. Case study of the Gaussian model in 2080
In Figure 4, the highest estimated values of incoming longwave radiation were found in the central portions and in the SE and Northeastern directions with values higher than 400 W.m-2.year-1. The lowest incoming
Table 2. Semivarioagram setting parameters and RMSE for the three transitive theoretical mathematical models.
Years C0 C0+C a DSD (%) RMSE
(W.m-2.year-1) Models
2070
10.3 74.5 13.8 13.8 9.2 Spherical
Exponential Gaussian
9.7 74.6 12.5 13.0 9.2
7.6 77.1 12.5 9.9 9.1
2080
30.0 88.1 14.5 34.1 10.5 Spherical
Exponential Gaussian
34.0 86.0 18.8 39.5 10.5
24.1 94.9 13.8 24.4 10.5
2090
40.6 101.6 14.1 40.0 11.4 Spherical
Exponential Gaussian
46.7 96.7 15.7 48.3 11.4
32.5 110.6 13.1 29.4 11.3
C0 = nugget effect; C0+C = level; a = reach; DSD = Degree of Spatial Dependence; RMSE = Root Mean Square Error.
Figure 3. Spatiotemporal variability of incoming longwave radiation (W.m-2.year-1) for transitive
longwave radiation values were concentrated in the W, NW and S regions with approximate values of 400 W.m-2.year-1. The observed and spatially simulated
results were in accordance with the considerable temperature and CO2 increases for this year simulated by the regional HadRM3 model.
4. CONCLUSIONS
The ordinary Kriging method is applicable throughout the Legal Amazon for 2070 and 2080 but not 2090 due to moderate spatial dependence, which precludes its application. The Gaussian model is the most suitable to estimate the incoming longwave radiation for the Amazon region.
The estimated incoming longwave radiation based on the air temperature output obtained from the HadRM3 regional model and applied in Swinbank’s equation showed promising results for the Legal Amazon.
The results of this study will enable and support new studies with the HadRM3 regional model, especially in intercomparative studies involving other regional models and other existing equations in the literature to estimate incoming longwave radiation.
SUBMISSION STATUS
Received: 17 nov., 2016 Accepted: 12 sept., 2017
CORRESPONDENCE TO
Paulo Teodoro
Universidade Federal de Mato Grosso do Sul – UFMS, Rodovia MS 306, Km 402, Campus Universitário, CEP 75560-000, Chapadão do Sul, MS, Brasil
e-mail: [email protected]
REFERENCES
Aguiar LJG, Costa JMND, Fischer GR, Aguiar RG, Costa ACL, Ferreira WPM. Estimativa da radiação de onda longa atmosférica em áreas de floresta e de pastagem no sudoeste da Amazônia. Revista Brasileira de Meteorologia
2011; 26(2): 215-224. http://dx.doi.org/10.1590/S0102-77862011000200006.
Aguilar JLC, Gentle AR, Smith GB, Chen D. A method to measure total atmospheric long-wave down-welling radiation using a low cost infrared thermometer tilted to the vertical. Energy 2015; 81(1): 233-244. http://dx.doi. org/10.1016/j.energy.2014.12.035.
Almeida CT, Oliveira-Júnior JF, Delgado RC, Cubo P, Ramos MC. Spatiotemporal rainfall and temperature trends throughout the Brazilian Legal Amazon, 1973-2013. International Journal of Climatology 2017; 37(4): 2013-2026. http://dx.doi.org/10.1002/joc.4831.
Cambardella CA, Moorman TB, Parkin TB, Karlen DL, Novak JM, Turco RF et al. Field scale variability of soil properties in central Iowa soil. Soil Science Society of America Journal 1994; 47(5): 1501-1511. http://dx.doi. org/10.2136/sssaj1994.03615995005800050033x.
Castro FDS, Pezzopane JE, Cecílio RA, Pezzopane JR, Xavier AC. Avaliação do desempenho dos diferentes métodos de interpoladores para parâmetros do balanço hídrico climatológico. Revista Brasileira de Engenharia Agrícola e Ambiental 2010; 14(7): 871-880. http://dx.doi. org/10.1590/S1415-43662010000800012.
Correa CCG, Teodoro PE, Cunha ER, Oliveira-Júnior JF, Gois G, Bacani VM et al. Spatial Interpolation of Annual Rainfall in the State Mato Grosso Do Sul (Brazil) Using Different Transitive Theoretical Mathematical Models.
International Journal of Innovative Research in Science.
Engineering and Technology 2014; 3: 16618-16625.
Delgado RC, Oliveira-Júnior JF, Gois G, Lyra GB. Cenários Climáticos da Radiação Solar Global Baseados no Modelo Regional HadRM3 para o Estado do Acre.
Floresta e Ambiente 2014; 21(4): 417-428. http://dx.doi. org/10.1590/2179-8087.082214.
Felgueiras CA. Modelagem ambiental com tratamento de incertezas em sistemas de informação geográfica: o paradigma geoestatístico por indicação [tese]. São José dos Campos: Instituto Nacional de Pesquisas Espaciais; 2001. Figure 4. Spatiotemporal variability of incoming
longwave radiation (W.m-2.year-1) for Gaussian
Figueroa SN, Nobre CA. Precipitions distribution over Central and Western Tropical South América. Climanálise Boletim de Monitoramento e Análise Climática 1990; 5(6): 36-45.
Gois G, Delgado RC, Oliveira-Júnior JF. Modelos teóricos transitivos aplicados na interpolação espacial do Standardized Precipitation Index (SPI) para os episódios de El Niño forte no Estado do Tocantins, Brasil. Irriga 2015; 20(2): 371-387. http://dx.doi.org/10.15809/irriga.2015v20n2p371.
Gondim RS, Castro MD, Evangelista SDM, Teixeira ADS, Fuck SDF Jr. Mudanças climáticas e impactos na necessidade hídrica das culturas perenes na Bacia do Jaguaribe, no Estado do Ceará. Pesquisa Agropecuária Brasileira 2008; 43(12): 1657-1664. http://dx.doi.org/10.1590/S0100-204X2008001200003.
Goovaerst P. Geostatistics for natural resources evaluation. Oxford : Oxford University Press; 1997. 481 p.
Herrero J, Polo MJ. Parameterization of atmospheric longwave emissivity in a mountainous site for all sky conditions. Hydrology and Earth System Sciences 2012; 16(9): 3139-3147. http://dx.doi.org/10.5194/hess-16-3139-2012.
Instituto Brasileiro de Geografia e Estatística – IBGE.
Amazônia legal. Rio de Janeiro: IBGE; 2015 [cited 2015 Feb 2]. Available from: http www.ibge.gov.br/home/ geociencias/geografia/mapas_doc3.shtm
Intergovernmental Panel on Climate Change – IPCC.
Climate change 2007: the physical science basis: summary for policymakers contribution of Working Group I to the Fourth Assessment Report of the Intergovernmental Panel on Climate Change. Genebra: IPCC; 2007a. 18 p.
Intergovernmental Panel on Climate Change – IPCC.
Climate change 2007: climate change impacts, adaptation and vulnerability. summary for policymakers contribution of Working Group II to the Intergovernmental Panel on Climate Change Fourth Assessment Report Climate Change 2007. Genebra: IPCC; 2007b. 23 p.
Iziomon MG, Mayer H, Matzarakis A. Downward atmospheric longwave irradiance under clear and cloudy skies: measurement and parameterization. Journal of Atmospheric and Solar-Terrestrial Physics 2003; 65(10): 1107-1116. http://dx.doi.org/10.1016/j.jastp.2003.07.007.
Justino F, Oliveira EC, Rodrigues RA, Gonçalves PHL, Souza PJOP, Stordal F et al. Mean and Interannual Variability of Maize and Soybean in Brazil under Global Warming Conditions. American Journal of Climate Change 2013; 2(4): 237-253. http://dx.doi.org/10.4236/ajcc.2013.24024.
Liou KN. An introduction to atmospheric radiation. 2nd ed. San Diego: Academic Press; 2002.
Ma Q, Wang KC, Wild M. Evaluations of atmospheric downward longwave radiation from 44 coupled general circulation models of CMIP5. Journal of Geophysical Research 2014; 119: 4486-4497.
Morcrette JJ. The Surface Downward Longwave Radiation in the ECMWF. Forecast System.Journal of Climate 2002; 15(14): 1875-1892. http://dx.doi.org/10.1175/1520-0442(2002)015<1875:TSDLRI>2.0.CO;2.
Providing Regional Climates for Impacts Studies – PRECIS.
The Hadley Centre regional climate modelling system. Exeter: Hadley Centre; 2002. 20 p.
Santos EHM, Griebeler NP, Oliveira LFC. Variabilidade espacial e temporal da precipitação pluvial na bacia hidrográfica do Ribeirão João Leite-GO. Engenharia Agrícola 2011; 31(1): 78-89. http://dx.doi.org/10.1590/ S0100-69162011000100008.
Satyamurty P, Castro AA, Tota J, Gularte LES, Manzi AO. Rainfall trends in the Brazilian Amazon Basin in the past eight decades. Theoretical and Applied Climatology
2010; 99(1): 139-148. http://dx.doi.org/10.1007/s00704-009-0133-x.
Uliana TM, Reis EF, Silva JGF, Xavier AC. Precipitação mensal e anual provável para o Estado do Espírito Santo.
Irriga 2013; 18(1): 139-147. http://dx.doi.org/10.15809/ irriga.2013v18n1p139.
Vilani MT, Sanches L, Pinheiro MR, Pinto OB Jr. Estimativa da radiação de onda longa incidente em uma floresta semidecídua tropical da Bacia Amazônica. Ciência e Natura 2010; 32(1): 65-081.
Swinbank W. Long‐wave radiation from clear skies. Quarterly Journal of the Royal Meteorological Society 1963; 89(381): 339-348. http://dx.doi.org/10.1002/qj.49708938105.
Wanderley HS, Amorim RFC, Carvalho FO. Interpolação espacial da precipitação no Estado de Alagoas utilizando técnicas geoestatística. Revista Ciências Exatas e da Terra e Ciências Agrárias 2013; 8(1): 34-42.