Pattern Recognition Approach in Multidimensional
Databases: Application to the Global Terrorism
Database
Semeh BEN SALEM
1, Sami NAOUALI
21
Polytechnic School of Tunisia, Rue El-Khawarizmi, B.P 743, La Marsa, 2078, TUNISIA
2
Military Academy of Fondouk Jedid, Virtual Reality and Information Technologies lab 8012 Fondouk Jedid, Nabeul -TUNISIA
Abstract—This paper presents a pattern recognition approach
in multidimensional databases. The approach is based on a clustering method using the distance measurement between a reference profile and the database observations. Two distance measurements will be proposed: an adaptation of the Khi2 formula to the multidimensional context, extracted from the Multiple Correspondence Analysis (MCA), and the Euclidean distance. A comparison between the two distances will be provided to retain the most efficient one for the multidimensional clustering context. The proposed approach will be applied to a real case study representing armed attacks worldwide stored in the Global Terrorism Database (GTD).
Keywords—clustering; pattern recognition; multidimensional
databases; distance measurement; Khi2 formula; Euclidean
distance; Multiple Correspondence Analysis I. INTRODUCTION
Data Warehouses (DW) [1] are centralized huge databases used to store heterogeneous data collected from disparate sources. Specific Data Mining techniques, such as clustering, are applied to analyze these structures for patterns recognition. Graphically, these data sets can be represented by cubic multidimensional data structures called OLAP (OnLine Analytical Processing) cubes [2]. Given a population of N observations described by a set of m attributes, clustering them into distinct groups allows identifying interesting patterns. In machine learning and Data Mining applications, data sets arise in huge matrix format [3] composed of a large number of rows and columns which processing requires effective techniques such as clustering and robust knowledge discovery algorithms.
This paper proposes a clustering approach using the Khi² formula adapted to the multidimensional context, and the Euclidean metric. The KHI² formula is commonly used to reduce the number of columns and lines in a dataset by evaluating similarities between observations and attributes. Reducing the lines or columns of a data table helps decreasing the amount of data in the data table and consequently computation costs and resources consumption. However, the Euclidean distance, specially used for geometric computations, allows calculating the distance between two distinct points.
This article is organized as follows: the next section presents previous related works in the field of pattern recognition and clustering techniques. The third section details
the proposed approach to be applied to multidimensional databases and introduces the corresponding algorithm. The corresponding case study of terrorist attacks in the year 1993 is presented in section four and finally results interpretation, conclusion and perspectives are given.
II. RELATED WORKS AND MOTIVATIONS A. Clustering large dataset: state of the art
Clustering is an analytical exploratory unsupervised method to classify a data set observations into a finite and a small number of groups based upon two or more variables. The clustering process finds most similar observations among a set of untagged data according to the specified patterns. A clustering , is a partition of a data set containing n elements, into different subsets with respectively
elements called clusters. Formally we have the following findings:
{ } where = and ⋃ =
∑However, two clusterings and of the same data set can lead to different clustering results and depending on the technique and algorithms used. An evaluation of the clusterings obtained is then required in order to identify the most appropriate clustering technique proposed. In a clustering process, elements belonging to the same group are given the same label and are similar but are dissimilar to elements belonging to other groups. In the literature, many clustering methods were proposed and developed [4].These approaches are either:
Hierarchical: A hierarchical algorithm uses a dendrogram representing the grouping of patterns and similarity levels at which groupings change. Most hierarchical clustering algorithms are variants of the single-link [5] (minimum distances between pairs), and complete-link [6] (maximum distances between pairs). Partitional: A partitional clustering algorithm obtains a
Polythetic: Most algorithms are polythetic which means that all the features enter into the computation of distances between the patterns.
Monothetic : A simple monothetic algorithm reported in [8] considers features successively to divide the given collection of patterns. The limitation of such an approach is the number of clusters generated ( clusters where d is the dimensionality of the patterns). The number of clusters obtained may be so large that the data set is divided into uninterestingly small and fragmented clusters.
In [9],the authors describe the limits of K-means algorithm, which is a well known clustering algorithm proposed for numeric (quantitative) data. The algorithm optimizes an objective function defined on the Euclidean distance measure. Although this algorithm gives promising results, the quality of clusters produced depends on the initialization of clusters and the order in which data elements are processed in the iteration.
In [10], the author proposes four clustering distances: Russel/Rao, Jaccard, Matching and Dice. The results show that over 90% of the cases were correctly grouped together.
In [11, 12], the authors conduct a clustering analysis with binary data. Two individuals should be viewed as similar to the degree that they share a common pattern of attributes among the binary variables. Observations with more similar patterns of response on the variables of interest are seen as closer to one another than are those with more disparate response patterns. B. Similarity measures
Distance measurement is used in many clustering algorithms to evaluate the similarity between two observations. The most known distance measurement is the Euclidean distance defined as follows:
( ) ∑( )
are two individuals (observations) with d attributes. The total number of modalities is k and each observation is defined by a vector as follows: where corresponds to the modality k of the individual i. The Euclidean distance is usually used for quantitative variables with varied values and wasn’t previously used in a binary computation context and produces compact or isolated clusters [13].
The use of metrics to measure the distance is reduced to the computation of a symmetric matrix of pairwise distances values for the n patterns to simplify the computation process and complexity. However, major clustering approaches are provided for quantitative (numerical) data and fewer techniques are proposed for qualitative (continuous) data. Some methods were developed to measure the proximity for heterogeneous type patterns: [14] proposes a combination of a modified Minkowski metric for continuous features and a distance for nominal attributes. A variety of other metrics have been reported in [15, 16] for computing the similarity between
patterns represented using quantitative as well as qualitative features.
C. Multiple Correspondence Analysis (MCA)
Multiple Correspondence Analysis (MCA) is a statistical method initially used to reduce either the number of columns or lines of a huge data set table by measuring the similarity between the profiles. It is used in this approach to evaluate the similarity between the observations in the data of our case study for clustering purposes using the Khi² distance. This method was also used in [17] to reduce the dimensions of a DW and has provided remarkable results.
A DW, which can then be considered as a large data table, containing I observations (facts) and J variables (dimensions) and represented by a matrix IxJ, called the Complete Disjunctive Table (CDT) [18] where represents the modality of the variable j possessed by the individual i. If is the number of modalities of the variable j, and K the total number of modalities, then we have ∑ . This table permits transforming the initially discrete (qualitative) data of the DW into a binary data table. If the patterns contains the considered modality, we will affect 1 in the corresponding of the CDT else we affect the value 0. The form of the CDT is presented in the following Table 1:
TABLE I. MATRIX OF THE CDT TABLE DATA
CDT=
J
1
i
n
The Khi² formula is given by the following Equation 1: ∑
∑
However, in this study, another adapted formula derived from the Equation 1 will be presented and considered for the computation in the approach.
III. PROPOSED APPROACH FOR MULTIDIMENSIONAL DATABASE CLUSTERING
A. The adapted KHI² formula
In this paper, a clustering qualitative data approach is proposed using both: the Khi² and the Euclidean distance formula. An experimental comparison between the two distances is also provided. The adapted Khi² formula is given in the following Equation 2:
∑ ⁄ ∑ (2) x and x’ are two observations (elements);
p is the number of dimensions;
n is the number of observations in the dataset (lines); is the number of occurrence of a modality ; the number of modalities in a dimension.
kij
B. Data pretreatment: data cleaning and multidimensional structure extraction
A transformation process from the initial qualitative data to binary values is required in this approach. Each observation in the data table (row) represents a K-dimensional vector profile, where K represents the total number of modalities. Each observation is will then represented by the following vector:
{ } { } , where I is the number of observations and K the number of modalities, if the corresponding modality exists for the observation and 0 otherwise. On the other hand, J represents the total number of dimensions in the DW and we should verify the following findings;
represents the dimension j of the DW and the universe of dimensions, i.e the set of values taken by the dimensions and its cardinality.
Each dimension contains a set of modalities , is the universe of the modalities and card( )=K and represents the modalities taken by the dimension ;
⋃
{ } ∑
The algorithm corresponding to such a process is given by the following Table 2:
TABLE II. KHI²CLUSTERING ALGORITHM
Algorithm DIST_COMPUTE
FUNCTION GEN_CDT 1.for each do
2.if then 1
3.else 0
4.end for
END GEN_CDT FUNCTION COMPUTE 5.occ 0, som 0
6.for each do 7.if = 1 then occ++
8.end if 9.end for
10.for each do 11. A= math.pow(( - ref)),2)/occ
12. som som+A 13.end for
END-COMPUTE
IV. CASE STUDY:GLOBAL ARMED ATTACKS IN THE YEAR 1993
In this section, a real case study is presented based on publicly available information collected on terrorist attacks that occurred worldwide in the year 1993. The objective is to apply the proposed clustering approach to recognize interesting groups and their associated patterns. Data Mining application deal with data sets containing a large amount of qualitative and quantitative data. This approach is proposed for qualitative
data. The initial dataset is filtered in order to keep only the most relevant attributes for the considered analyzing objectives. A. The Global Terrorism Database (GTD)
The Global Terrorism Database (GTD) [19, 20, 21] is a vast collection of terrorist activities reported around the globe that incorporates more than 27.000 terrorist incidents, provided by the National Consortium for the Study of Terrorism and Response to Terrorism (START), a United States department of Homeland Security of Excellence based at the University of Maryland. The data set is assembled from public sources including media, articles, electronic news, books, journals and legal documents. Using clustering techniques would provide interesting results in order to identify terrorist activities patterns correlated with each other.
B. Multidimensional structure extraction
The considered data table of the case study contains 748 observations associated with 123 qualitative and quantitative variables to characterize armed attacks that took place worldwide in 1993. These data are presented in a MS EXCEL table without any specific structure. As already defined, the pretreatment step also identifies a multidimensional structure to be extracted from the table. Only three dimensions will be retained in the computational process later which could be easier than considering all the identified dimensions. The following seven dimensions with the associated attributes are then identified:
TIME (year, moth, approxdate, extended, resolution); LOCATION (country, region, provstate, city, latitude,
longitude, specificity, vicinity, location);
FEATURES (summary, crit1, crit2, crit3, doubter, alternative, multiple, succeed, suicide);
ATTACK_TYPE (attack_type1, attack_type2, attack_type3, nbpers );
TARGET (target_type1, corp1, target1, nationality, target_type2, corp2, target2, nbkills, nbwounded ); WEAPON (weapon_type1, weapon1, weapon_subtype,
weapon_details, target_type2, corp2, target2 ); TERRORIST_GROUP (group_name, group_subname,
motivation, claimed);
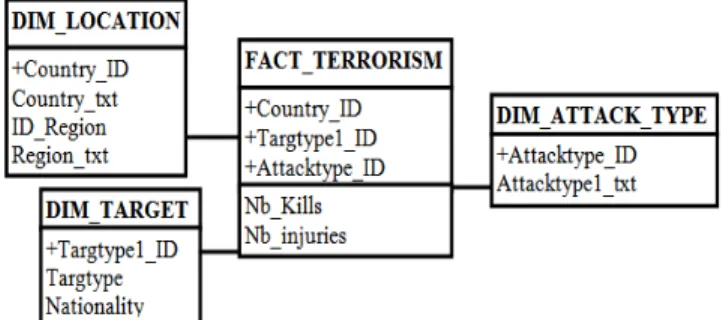
The following Figure1 represents the three dimensions to be retained for the study:
The three retained dimensions are {LOCATION, ATTACK_TYPE, TARGET}. The DW contains qualitative data where each dimension has a limited and fixed number of possible values. The dimensions and the measures are presented as follows:
LOCATION{ Europe, Middle East & North Africa, Asia, America, Russia};
ATTACK_TYPE{ Assassination, Armed Assault,
Bombing, Hostage Taking, Facility};
TARGET{ Civilians, Government, Military, Business,
Other };
Total number of fatalities NB-KILLS;
Total number of injuries NB-INJURIES;
Each observation in the CDT table is represented by a profile containing five information: three dimensions and two measures. An example of two observations is given by the following Table 3:
TABLE III. INDIVIDUAL REPRESENTATION IN THE DW FACT TABLE
IND 1 IND 2
LOCATION ME & NA AMERICA
ATTACK_TYPE ARMED ASSAULT BOMBING
TARGET MILITARY CIVILIANS
NB_KILLS
NB-INJURIES
The transformation of the previous qualitative profile in Table 3 to binary representation is given by the following Table 4:
TABLE IV. BINARY FACT TABLE REPRESENTATION:CDT
LOCATION ATTACK_TYPE TARGET
EU RO PE ME & N A AS IA AM ERI C A RU S S IA AS S A S ARM _ A S S BO MB IN G H O S T AG E FAC IL IT Y C IVI L IAN S GOV MIL IT ARY BU S IN E S S O T H ER
OBS 1 0 1 0 0 0 0 1 0 0 0 0 0 1 0 0
OBS 2 0 0 0 1 0 0 0 1 0 0 1 0 0 0 0
In the CDT, each individual has an encoding of 15-bit representing its whole characteristic profile. This encoding is not random; it should respect the following findings to preserve the integrity of the table:
The number of bits encoded 1 in a line is equal to the number of dimensions;
The total number of occurrences m of all modalities in a dimension is equal to the total number of observations;
V. RESULTS INTERPRETATION A. Clustering using the KHI² distance
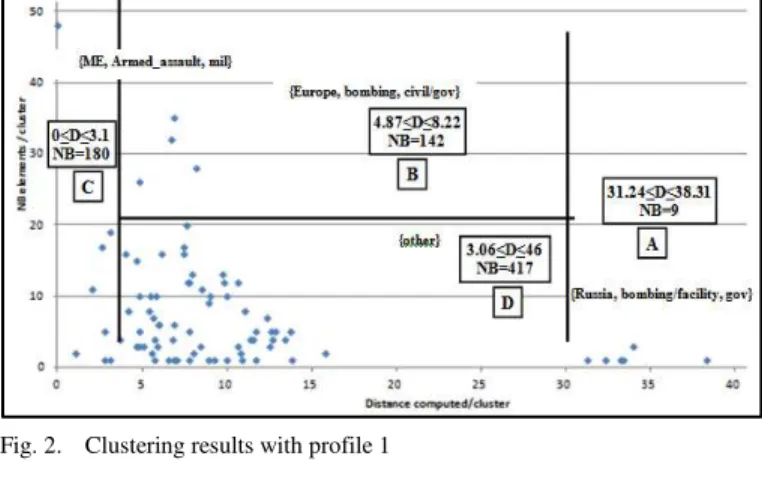
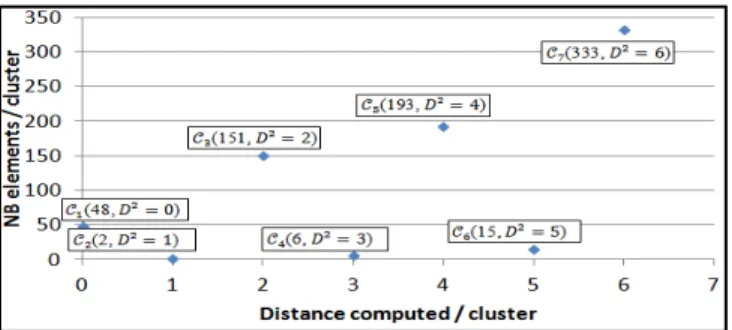
The clustering results performed in this approach are shown in Figures 2 and 3 below: clusters are represented according to the computed distances (D²) and the number of items in each
cluster. Each point in the Figure 2 and 3 represents a cluster. The computation was performed according to two reference profiles represented in the following Table 5.
TABLE V. REFERENCE PROFILES REPRESENTATION
LOCATION ATTACK_TYPETARGET
EU RO PE ME & N A AS IA AM ERI C A RU S S IA AS S A S ARM _ A S S BO MB IN G H O S T AG E FAC IL IT Y C IVI L IAN S GOV MIL IT ARY BU S IN E S S O T H ER
0 1 0 0 0 0 1 0 0 0 0 0 1 0 0 0 0 0 0 0 0 0 0 0 0 0 0 0 0 0
The distance would be measured between the reference profile and all the other individuals of the dataset.
Fig. 2. Clustering results with profile 1
Fig. 3. Clustering results with profile 2
According to the experimental results, 86 distinct groups were identified (0 <D< 38.3). The following Table 6 represents statistical results concerning the number of clusters and elements obtained according to each profile.
TABLE VI. PROFILE 1 AND PROFILE 2COMPARISON
NB clusters NB super groups
NB elements / super cluster
A B C D
Profile1 86 4 9 141 180 418
% 1.2 18.85 20.06 55.88
Profile2 85 3 9 246 494
In the previous Figure 2, we identify four main groups containing all the clusters (and therefore the corresponding elements) and having similar profiles. It is also proposed to introduce another parameter representing the number of common modalities between each individual and the reference. If the distance computed increases, the number of common modalities decreases, which explains that the elements become more and more dissimilar as shown in the following Table 7.
TABLE VII. DISTANCES COMPUTED WITH THE NUMBER OF RETAINED
MODALITIES
D² ( ) 0 1,08 2 2,03 2,63 2,76 2,82 2,83 3,10
NB (same modalities) 3 2 2 2 2 2 2 2 2
The following Table 8 presents the characteristics of the groups identified in relation with the distance computed and the number of elements in the groups.
TABLE VIII. CLUSTERS IDENTIFICATION
A B C D
Distance computed (D²)
High Low Low Medium High Low Low
NB elements
Low High High Low/Medium
Low High High
The four groups identified in Figures 2 and 3 can be interpreted as follows:
Group A contains only five clusters (1.09% of the total number of clusters) with the highest computed distances from the reference. The associated profile to this group is {RUSSIA, BOMBING, FACILITY / GOV}. It concerns armed attacks that occurred in Russia against either governmental or facility targets using bombs. These clusters, given their small number, are not representative of a specific behavior of armed group attacks in the country. The attacks mainly targeted the state and not the military or civilians which can be explained by the policy of the country and clarify the claims of the attacks that may have political backgrounds.
Group C is the most interesting super cluster; it contains clusters with minimum distances to the reference and consequently most similar to the initial profiles defined. Further information extraction and analysis from the database could provide more remarkable information : the most active armed groups in the region, the relation between these groups. Group B contains elements with medium distances (<
10) with relatively high cardinality (> 25 elements) by the maximum cluster distance to our reference, this is a result of groups containing more dissimilar elements. Group D represents various clusters that are compact
and even close. The distance between clusters is sometimes reduced which means that the results and profiles are quite similar.
The following Table 9 represents the different labels that could be assigned to each cluster with the corresponding groups:
TABLE IX. CLUSTER LABELS
CLUSTER Label Nb clusters Nb elements
A RUSSIA, BOMBING/FACILITY,
GOV 7 9
B EUROPE, BOMBING, CIVIL/GOV 5 142
C ME, ARMED_ASSAULT, MIL 9 181
D OTHER 62 416
TOTAL= 748
We note that during the year 1993, Europe and ME & NA are the most concerned regions by the armed attacks. These results indicate that criminal activities are very relevant in these regions. The total number of observations corresponding to the profile {MIDDLE EAST & NORTH AFRICA, ARMED ASSAULT, MILITARY} is 181, the total number of observations corresponding to the profile {EUROPE, BOMBING, GOVERNMENT} is 142. These results can have great importance for specialists in the counter-terrorist or criminal investigation services. Besides, according to Figures 2 and 3, we notice that the corresponding clusters are easily identifiable. Additional efforts should be led in order to strengthen the military intelligence services in the ME & NA countries while general intelligence for private government representatives should be considered in the European countries. Besides, attacking the governments and an official representative can be explained by the political issues declared by the government and these attacks may have political reasons. However, targeting the army and law enforcement agencies can be seen as an attempt to weaken the government capabilities in facing terrorism for more reasons not essentially political issues: we can mention the case of Islamic groups that are targeting military and police in order to widespread their jihadist beliefs. B. Clustering using the Euclidean distance
The objective of this study is to conduct a clustering using both: the Euclidean and KHI² distances. The Figure 4 below shows the clustering results obtained by the Euclidean distance.
Fig. 4. Clustering results with the Euclidean Distance
provides better clustering results compared to the Euclidean distance: The clusters are more visible and the results are better exposed. These results are due to the fact that the KHI² formula takes into consideration additional parameters that are not identified with the Euclidean distance, including the occurrence m of each modality, the total number of observations N and the number of dimensions P.
Lets consider the cluster computed with the Euclidean distance where D² = 2. The cluster contains all other groups previously identified with the Khi² formula (11 groups) and having the distances around D² = 2. This result presents one of the limits of the Euclidean distance: it is possible to group many observations that may have different profiles in the same cluster while they are distinguished with the KHI² distance. C. Further data analysis: armed groups identification
According to the following Table 10, most of the armed attacks in the year 1993 occurred in Europe and ME& NA with a total of 492 attacks (65.77%). Given their geographical proximity, it would be possible to conclude that links may exist between these attacks especially if the same armed group conducts attacks on both territories. Investigations has shown that many armed attacks happening in Europe were planned by terrorist groups adherents from the Middle East and North Africa. Thus more and more attention should be given to these groups and additional bilateral collaboration between these two continents should be taken into consideration. In Table 10, we represent the number of occurrence m of each modality. The m parameter is part of the KHI² formula used to characterize the most frequent modalities. Data integrity is verified because the total number of observations for each dimension is the same:
TABLE X. NUMBER OF OCCURRENCE OF THE MODALITIES IN THE DW
LOCATION ATTACK_TYPE TARGET
EU
R
O
P
E
M
E
&
N
A
A
S
IA
A
M
ER
IC
A
R
U
S
S
IA
A
S
S
A
S
A
R
M
_
A
S
S
B
O
M
B
IN
G
H
O
S
TA
G
E
F
A
C
ILI
TY
C
IV
ILI
A
N
S
GOV MILI
TA
R
Y
B
U
S
IN
ESS
O
TH
ER
Occ (M) 227 265 115 132 9 36 230 270 43 148 199 237 157 97 59
% 30 36 15 18 1 5 32 37 6 20 26 32 21 13 8
Total 748 748 748
Nb_Kills 2668
Nb_Wounds 5599
The most frequent modalities previously identified are {ME & NA, BOMBING, GOV}. The number of corresponding observations is only 17 which doesn’t represent an interesting profile to study despite it contains the most frequent modalities. Furthermore, the results provided by the approach, do not identify the profile {ME & NA, BOMBING, GOV} as an interesting profile with a great number of elements. This highlights the value of using reliable analytical techniques such as clustering for discovering interesting patterns and extracting relations between patterns.
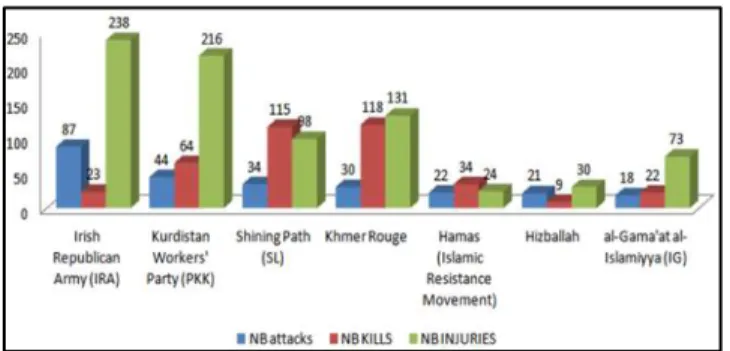
There are various armed organizations identified in the GTD dataset where more than two thousand different groups of terrorists have been recorded. The following Figure 5 presents
the most common identified groups according to the number of attacks, the number of kills and injuries.
Fig. 5. Statistics of damages caused by armed groups
The following Table 11 presents the countries where the attacks happened according to each group:
TABLE XI. ACTIONS OF GROUPS BY COUNTRY
Groups NB
attacks Region Place of attacks
IRA1 87
Europe
Great Britain / Northern Ireland
PKK2 26 Germany / Great Britain/Switzerland / France/Denmark / Austria
Hamas 3 22 The Middle East & North Africa
West Bank and Gaza Strip Israel
Hezbollah 21 Lebanon / Israel
IG4 18 Egypt
PKK 18 Turkey
According to the previous Table 11, we identify the number of attacks by region and by country associated with the most identified armed groups. Seeing the results provided, two categories of the most active groups are distinguished:
Groups operating in one geographical area such as (IRA) in Europe and "Hamas (Islamic Resistance Movement)", "Hizballah", (IG) in the Middle East & North Africa.
Groups that act on two different continents including (PKK) in Europe (26 attacks) and Turkey (18 attacks).
The results obtained are with a great importance for intelligence services and law enforcement agencies. These results help giving more intelligence about the behavior of these groups to understand the motives and reasons for their actions: Generally, an attack to foreign boundary includes locals from the same country. Similarly, the domestic attacks involve a national or a group of nationals who attack their own homeland.
While the world may confront extraordinary terrorist threats today, experts can explore a lot of things about today’s dangers by investigating the practices of terrorist groups in the recent past and the effects that these terrorist actors, and the terrorist vents they executed, have had.
1
Irish Republican Army.
2 Kurdistan Workers' Party 3
Islamic Resistance Movement
4
VI. CONCLUSIONS AND PERSPECTIVES
Data mining is a fundamental tool that has been widely used to model crime detection problems, detect unusual patterns, terrorist activities and fraudulent behaviors. It has great effectiveness and high influence in law enforcement studies or crime prevention, detection and analysis. Our approach is based on clustering armed attacks events to identify interesting patterns such as the main regions and countries concerned, targets and kind of attacks. The approach is based on the use of the KHI² distance extracted from the MCA and the Euclidean distance, to express the similarity between the observations. According to the study, the KHI² distance measurement is more effective than the Euclidean distance and can provide better discernible results. However, the approach is proposed for qualitative data and a pretreatment procedure is required to switch from the qualitative data to the binary one. Experimental results with quantitative data should also be presented to compare the effectiveness of the approach. Evaluating the effectiveness of the approach based on a specific method is also required especially when using different clustering methods providing almost comparable data. This issue will be taken into consideration in the following publications.
REFERENCES
[1] W. H. INMON. (1994). “Building the Data Wharehouse Toolkit”. Wiley Computer Publishing, ISBN 0-471-56960-7.
[2] L.Lebart, A.Morineau, M.Piron (2006). “Statistique exploratoire
multidimensionnelle“. Dunod, Paris.
[3] D.Agarwal and S.Merugu, “Predictive discrete latent factor models for
large scale dyadic data”, In proceedings of the 13th ACM SIGKDD international conference on Knowledge Discovery and Data Mining
(KDD’07), 2007,pp:26-35.
[4] Dillon, W.R and Goldstein, M.(1984), “Multivariate Analysis: Methods
and applications”, John Wiley and Sons.
[5] Snijders, T. A., Dormar, M. van Schurr, W.H, Dijkman Caes, C and
Driessen, G (1990), “Distribution of some similarity coefficients for
dyadic binary data in the case of associated attributes”, Journal of
classification 7, 1409-1438.
[6] A.K. JAIN, M.N. MURTY, P.J. FLYNN, “Data Clustering: A Review”, ACM Computing Surveys, Vol. 31, No. 3, September 1999.] [S
NEATH,P.H.A.AND SOKAL, R. R., “Numerical Taxonomy”, Freeman,
London, UK, 1973.
[7] KING, B. 1967 “Step-wise clustering proce- dures”. J. Am. Stat. Assoc. 69, 86–101.
[8] A NDERBERG, M. R. 1973. Cluster Analysis for Applications. Academic Press, Inc., New York, NY.
[9] J.A.Hartigan, “Clustering Algorithms”, Wiley, New York, 1991. [10] A.K.Jain, R.C.Dubes, “Algorithms for clustering data”, Prentice Hall,
Englewood Cliffs, NJ,1998.
[11] S K Gupta, K Sambasiva Rao, Vasudha Bhatnagar, “K-means clustering
Algorithm for categorical attributes”.
[12] Holmes Finch, “Comparaison of diatance Measures in Cluster Analysis
with Dichotomous Data”, Ball State University, Journal of Data Science
3(2005), 85-100.
[13] MAO, J. AND JAIN, A. K. 1996. “A self-organizing network for
hyperellipsoidal clustering”, (HEC).IEEE Trans. Neural Network. 7, 16–
29.
[14] WILSON,D.R.AND MARTINEZ, T. R. 1997. Improved heterogeneous distance func- tions. J. Artif. Intell. Res. 6, 1–34.
[15] D IDAY,E.AND SIMON, J. C. 1976. Clustering analysis. In Digital Pattern Recognition,K. S. Fu, Ed. Springer-Verlag, Secaucus, NJ, 47–94. [16] I CHINO,M.AND YAGUCHI, H. 1994. Generalized Minkowski metrics for mixed feature-type data analysis. IEEE Trans. Syst. Man Cy- bern. 24, 698–708.
[17] S. Naouali, S. Ben Salem, “Towards reducing the multidimensionality of OLAP cubes using the Evolutionary Algorithms and Factor Analysis
Methods”, International Journal of Data Mining & Knowledge
Management Process (IJDKP) Vol.6, No.1, January 2016
[18] Jérôme Pagès, “Analyse des Correspondances Multiples ACM,
introduction à l’aide d’un exemple” Laboratoire de mathématiques
appliqués Agrocampus, Rennes.
[19] Gary LaFree and Laura Dugan.(2007), “Introducing the Global
Terrorism Database”, Political violence and terrorism 19:181 -204G.P..Zarri. Semantic web and knowledge Representation, Proc. Of the 13th International Workshop on Database and Expert System
applications (DEXA’02), 2002, pp. 1529-4188.
[20] G.LaFree, “the Global Terrorism Database: Accomplishments and
Challenges”, Perspectives on Terrorism, vol. 4, no.1, 2010.
[21] G.LaFree and L.Dugan, “Introducing the Global Terrorism Database”, Terrorism and political Violence, vol.19, no.2, pp:181-204, 2007. [22] D.Guo, K.Liao and M.Morgar, “Visualizing patterns in a global