Endemicity in 2010
Peter W. Gething1*, Iqbal R. F. Elyazar2, Catherine L. Moyes1, David L. Smith3,4, Katherine E. Battle1, Carlos A. Guerra1, Anand P. Patil1, Andrew J. Tatem4,5, Rosalind E. Howes1, Monica F. Myers1, Dylan B. George4, Peter Horby6,7, Heiman F. L. Wertheim6,7, Ric N. Price7,8,9, Ivo Mu¨eller10, J. Kevin Baird2,7, Simon I. Hay1,4*
1Spatial Ecology and Epidemiology Group, Department of Zoology, University of Oxford, Oxford, United Kingdom,2Eijkman-Oxford Clinical Research Unit, Jakarta, Indonesia,3Johns Hopkins Malaria Research Institute, Johns Hopkins Bloomberg School of Public Health, Baltimore, Maryland, United States of America,4Fogarty International Center, National Institutes of Health, Bethesda, Maryland, United States of America,5Department of Geography and Emerging Pathogens Institute, University of Florida, Gainesville, Florida, United States of America,6Oxford University Clinical Research Unit - Wellcome Trust Major Overseas Programme, Ho Chi Minh City, Vietnam,7Nuffield Department of Medicine, Centre for Tropical Medicine, University of Oxford, Oxford, United Kingdom,8Global Health Division, Menzies School of Health Research, Charles Darwin University, Darwin, Northern Territory, Australia,9Division of Medicine, Royal Darwin Hospital, Darwin, Northern Territory, Australia,
10Papua New Guinea Institute of Medical Research, Goroka, Papua New Guinea
Abstract
Background:Current understanding of the spatial epidemiology and geographical distribution ofPlasmodium vivaxis far less developed than that forP. falciparum, representing a barrier to rational strategies for control and elimination. Here we present the first systematic effort to map the global endemicity of this hitherto neglected parasite.
Methodology and Findings:We first updated to the year 2010 our earlier estimate of the geographical limits ofP. vivax transmission. Within areas of stable transmission, an assembly of 9,970 geopositionedP. vivaxparasite rate (PvPR) surveys collected from 1985 to 2010 were used with a spatiotemporal Bayesian model-based geostatistical approach to estimate endemicity age-standardised to the 1–99 year age range (PvPR1–99) within every 565 km resolution grid square. The model
incorporated data on Duffy negative phenotype frequency to suppress endemicity predictions, particularly in Africa. Endemicity was predicted within a relatively narrow range throughout the endemic world, with the point estimate rarely exceeding 7%PvPR1–99. The Americas contributed 22% of the global area at risk ofP. vivaxtransmission, but high endemic areas were generally sparsely populated and the region contributed only 6% of the 2.5 billion people at risk (PAR) globally. In Africa, Duffy negativity meant stable transmission was constrained to Madagascar and parts of the Horn, contributing 3.5% of global PAR. Central Asia was home to 82% of global PAR with important high endemic areas coinciding with dense populations particularly in India and Myanmar. South East Asia contained areas of the highest endemicity in Indonesia and Papua New Guinea and contributed 9% of global PAR.
Conclusions and Significance:This detailed depiction of spatially varying endemicity is intended to contribute to a much-needed paradigm shift towards geographically stratified and evidence-based planning forP. vivaxcontrol and elimination.
Citation:Gething PW, Elyazar IRF, Moyes CL, Smith DL, Battle KE, et al. (2012) A Long Neglected World Malaria Map:Plasmodium vivaxEndemicity in 2010. PLoS Negl Trop Dis 6(9): e1814. doi:10.1371/journal.pntd.0001814
Editor:Jane M. Carlton, New York University, United States of America
ReceivedApril 24, 2012;AcceptedJuly 29, 2012;PublishedSeptember 6, 2012
This is an open-access article, free of all copyright, and may be freely reproduced, distributed, transmitted, modified, built upon, or otherwise used by anyone for any lawful purpose. The work is made available under the Creative Commons CC0 public domain dedication.
Funding:SIH is funded by a Senior Research Fellowship from the Wellcome Trust (#095066), which also supports PWG, CAG, and KEB. CLM and APP are funded by a Biomedical Resources Grant from the Wellcome Trust (#091835). REH is funded by a Biomedical Resources Grant from the Wellcome Trust (#085406). IRFE is funded by grants from the University of Oxford—Li Ka Shing Foundation Global Health Program and the Oxford Tropical Network. DLS and AJT are supported by grants from the Bill and Melinda Gates Foundation (#49446,#1032350) (http://www.gatesfoundation.org). PH is supported by Wellcome Trust grants 089276/Z/ 09/Z and the Li Ka Shing Foundation. RNP is a Wellcome Trust Senior Fellow in Clinical Science (#091625). JKB is supported by a Wellcome Trust grant (#B9RJIXO). PWG, APP, DLS, AJT, DBG, and SIH also acknowledge support from the RAPIDD program of the Science and Technology Directorate, Department of Homeland Security, and the Fogarty International Center, National Institutes of Health (http://www.fic.nih.gov). This work forms part of the output of the Malaria Atlas Project (MAP, http://www.map.ox.ac.uk), principally funded by the Wellcome Trust, UK (http://www.wellcome.ac.uk). MAP also acknowledges the support of the Global Fund to Fight AIDS, Tuberculosis, and Malaria (http://www.theglobalfund.org). The funders had no role in study design, data collection and analysis, decision to publish, or preparation of the manuscript.
Competing Interests:The authors have declared that no competing interests exist.
* E-mail: [email protected] (PWG); [email protected] (SIH)
Introduction
The international agenda shaping malaria control financing, research, and implementation is increasingly defined around the goal of regional elimination [1–6]. This ambition ostensibly extends to all human malarias, but whilst recent years have seen a
holoendemic Africa can be transferred successfully to P. vivaxis, however, increasingly acknowledged as inadequate [13–17]. Previous eradication campaigns have demonstrated that P. vivax frequently remains entrenched long after P. falciparum has been eliminated [18]. The prominence ofP. vivaxon the global health agenda has risen further as evidence accumulates of its capacity in some settings to cause severe disease and death [19–25], and of the very large numbers of people living at risk [26].
Amongst the many information gaps preventing rational strategies for P. vivax control and elimination, the absence of robust geographical assessments of risk has been identified as particularly conspicuous [9,27]. The endemic level of the disease determines its burden on children, adults, and pregnant women; the likely impact of different control measures; and the relative difficulty of elimination goals. Despite the conspicuous impor-tance of these issues, there has been no systematic global assessment of endemicity. The Malaria Atlas Project was initiated in 2005 with an initial focus onP. falciparumthat has led to global maps [28–30] for this parasite being integrated into policy planning at regional to international levels [4,31–36]. Here we present the outcome of an equivalent project to generate a comprehensive evidence-base on P. vivax infections worldwide, and to generate global risk maps for this hitherto neglected disease. We build on earlier work [26] defining the global range of the disease and broad classifications of populations at risk to now assess the levels of endemicity under which these several billion people live. This detailed depiction of geographically
varying risk is intended to contribute to a much-needed paradigm shift towards geographically stratified and evidence-based plan-ning forP. vivaxcontrol and elimination.
Numerous biological and epidemiological characteristics of P. vivaxpresent unique challenges to defining and mapping metrics of risk. UnlikeP. falciparum, infections include a dormant hypnozoite liver stage that can cause clinical relapse episodes [37,38]. These periodic events manifest as a blood-stage infection clinically indistinguishable from a primary infection and constitute a substantial, but geographically varying, proportion of total patent infection prevalence and disease burden within different popula-tions [37,39–41]. The parasitemia of P. vivaxtypically occurs at much lower densities compared to those of falciparum malaria, and successful detection by any given means of survey is much less likely. Another major driver of the globalP. vivaxlandscape is the influence of the Duffy negativity phenotype [42]. This inherited blood condition confers a high degree of protection againstP. vivax infection and is present at very high frequencies in the majority of African populations, although is rare elsewhere [43]. These factors, amongst others, mean that the methodological framework for mapping P. vivax endemicity, and the interpretation of the resulting maps, are distinct from those already established forP. falciparum[28,29]. The effort described here strives to accommo-date these important distinctions in developing a global distribu-tion of endemic vivax malaria.
Methods
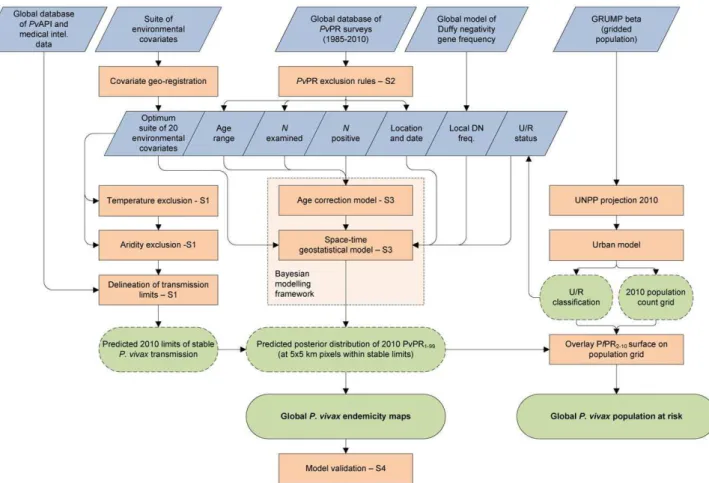
The modelling framework is displayed schematically in Figure 1. In brief, this involved (i) updating of the geographical limits of stableP. vivax transmission based on routine reporting data and biological masks; (ii) assembly of all availableP. vivax parasite rate data globally; (iii) development of a Bayesian model-based geostatistical model to mapP. vivaxendemicity within the limits of stable transmission; and (iv) a model validation procedure. Details on each of these stages are provided below with more extensive descriptions included as Protocols S1, S2, S3, and S4.
Updating Estimates of the Geographical Limits of EndemicPlasmodium vivaxin 2010
The first effort to systematically estimate the global extent ofP. vivaxtransmission and define populations at risk was completed in 2009 [26]. As a first step in the current study, we have updated this work with a new round of data collection for the year 2010. The updated data assemblies and methods are described in full in Protocol S1. In brief, this work first involved the identification of 95 countries as endemic forP. vivaxin 2010. From these,P. vivax annual parasite incidence (PvAPI) routine case reports were assembled from 17,893 administrative units [44]. These PvAPI and other medical intelligence data were combined with remote sensing surfaces and biological models [45] that identified areas where extreme aridity or temperature regimes would limit or preclude transmission (see Protocol S1). These components were combined to classify the world into areas likely to experience zero, unstable (PvAPI,0.1%per annum), or stable (PvAPI$0.1%per annum)P. vivax transmission. Despite the very high population frequencies of Duffy negativity across much of Africa, the presence of autochthonous transmission ofP. vivaxhas been confirmed by a systematic literature review for 42 African countries [26]. We therefore treated Africa in the same way as elsewhere in this initial stage: regions were deemed to have stableP. vivax transmission unless the biological mask layers or PvAPI data suggested otherwise.
Author Summary
Plasmodium vivaxis one of five parasites causing malaria in humans. Whilst it is found across a larger swathe of the globe and potentially affects a larger number of people than its more notorious cousin,Plasmodium falciparum, it receives a tiny fraction of the research attention and financing: around 3%. This neglect, coupled with the inherently more complex nature of vivax biology, means important knowledge gaps remain that limit our current ability to control the disease effectively. This patchy knowledge is becoming recognised as a cause for concern, in particular as the global community embraces the challenge of malaria elimination which, by definition, includesP. vivaxand the other less common Plasmodium species as well asP. falciparum. Particularly conspicuous is the absence of an evidence-based map describing the intensity of P. vivax endemicity in different parts of the world. Such maps have proved important for other infectious diseases in supporting international policy formulation and regional disease control planning, imple-mentation, and monitoring. In this study we present the first systematic effort to map the global endemicity ofP. vivax. We assembled nearly 10,000 surveys worldwide in which communities had been tested for the prevalence of P. vivax infections. Using a spatial statistical model and additional data on environmental characteristics and Duffy negativity, a blood disorder that protects againstP. vivax, we estimated the level of infection prevalence in every 565 km grid square across areas at risk. The resulting
Creating a Database of GeoreferencedPvPR Data As with P. falciparum, the most globally ubiquitous and consistently measured metric ofP. vivaxendemicity is the parasite rate (PvPR), defined as the proportion of randomly sampled individuals in a surveyed population with patent parasitemia in their peripheral blood as detected via, generally, microscopy or rapid diagnostic test (RDT). Whilst RDTs can provide lower sensitivity and specificity than conventional blood smear micros-copy, and neither technique provides accuracy comparable to molecular diagnostics (such as polymerase chain reaction, PCR), the inclusion of both microscopically and RDT confirmed parasite rate data was considered important to maximise data availability and coverage across the endemic world.
To map endemicity within the boundaries of stable transmis-sion, we first carried out an exhaustive search and assembly of georeferenced PvPR survey data from formal and informal literature sources and direct communications with data generating organisations [46]. Full details of the data search strategy, abstraction and inclusion criteria, geopositioning and fidelity checking procedure are included in Protocol S2. The final database, completed on 25thNovember 2011, consisted of 9,970 quality-checked and spatiotemporally unique data points, span-ning the period 1985–2010. Figure 2A maps the spatial distribution of these data and further summaries by survey origin, georeferencing source, time period, age group, sample size, and type of diagnostic used are provided in Protocol S2.
ModellingPlasmodium vivaxEndemicity within Regions of Stable Transmission
We adopt model-based geostatistics (MBG) [47,48] as a robust and flexible modelling framework for generating continuous surfaces of malaria endemicity based on retrospectively assembled parasite rate survey data [28,29,49]. MBG models are a special class of generalised linear mixed models, with endemicity values at each target pixel predicted as a function of a geographically-varying mean and a weighted average of proximal data points. The mean can be defined as a multivariate function of environmental correlates of disease risk. A covariance function is used to characterise the spatial or space-time heterogeneity in the observed data, which in turn is used to define appropriate weights assigned to each data point when predicting at each pixel. This framework allows the uncertainty in predicted endemicity values to vary between pixels, depending on the observed variation, density and sample size of surveys in different locations and the predictive utility of the covariate suite. Parts of the map where survey data are dense, recent, and relatively homogenous will be predicted with least uncertainty, whilst regions with sparse or mainly old surveys, or where measured parasite rates are extremely variable, will have greater uncertainty. When MBG models are fitted using Bayesian inference and a Markov chain Monte Carlo (MCMC) algorithm, uncertainty in the final predictions as well as all model parameters can be represented in the form of predictive posterior distributions [50].
Figure 1. Schematic overview of the mapping procedures and methods forPlasmodium vivaxendemicity.Blue boxes describe input data. Orange boxes denote models and experimental procedures; green boxes indicate output data (dashed lines represent intermediate outputs and solid lines final outputs). U/R = urban/rural; UNPP = United Nations Population Prospects. Labels S1-4 denote supplementrary information in Protocols S1, S2, S3, and S4.
We developed for this study a modified version of the MBG framework used previously to model P. falciparum endemicity [28,29], with some core aspects of the model structure remaining unchanged and others altered to capture unique aspects ofP. vivax biology and epidemiology. The model is presented in full in Protocol S3. As in earlier work [28,29,49], we adopt a space-time approach to allow surveys from a wide time period to inform predictions of contemporary risk. This includes the use of a spatiotemporal covariance function which is parameterised to downweight older data appropriately. We also retain a seasonal component in the covariance function, although we note that seasonality in transmission is often only weakly represented in PvPR in part because of the confounding effect of relapses occurring outside peak transmission seasons [51]. A minimal set of covariates were included to inform prediction of the mean function, based ona prioriexpectations of the major environmental factors modulating endemicity. These were (i) an indicator variable defining areas as urban or rural based on the Global Rural Urban
Mapping Project (GRUMP) urban extent product [52,53]; (ii) a long-term average vegetation index product as an indicator of overall moisture availability for vector oviposition and survival [54,55]; and (iii) aP. vivaxspecific index of temperature suitability derived from the same model used to delineate suitable areas on the basis of vector survival and sporogony [45].
Age Standardisation
Our assembly ofPvPR surveys was collected across a variety of age ranges and, since P. vivax infection status can vary systematically in different age groups within a defined community, it was necessary to standardise for this source of variability to allow all surveys to be used in the same model. We adopted the same model form as has been described [56] and used previously forP. falciparum [28,29], whereby population infection prevalence is expected to rise rapidly in early infancy and plateau during childhood before declining in early adolescence and adulthood. The timing and relative magnitude of these age profile features are Figure 2. The spatial distribution ofPlasmodium vivaxmalaria endemicity in 2010.Panel A shows the 2010 spatial limits ofP. vivaxmalaria risk defined byPvAPI with further medical intelligence, temperature and aridity masks. Areas were defined as stable (dark grey areas, wherePvAPI
$0.1 per 1,000 pa), unstable (medium grey areas, where PvAPI,0.1 per 1,000 pa) or no risk (light grey, wherePvAPI = 0 per 1,000 pa). The community surveys of P. vivaxprevalence conducted between January 1985 and June 2010 are plotted. The survey data are presented as a continuum of light green to red (see map legend), with zero-valued surveys shown in white. Panel B shows the MBG point estimates of the annual meanPvPR1–99for 2010 within the spatial limits of stableP. vivaxmalaria transmission, displayed on the same colour scale. Areas within the stable
limits in (A) that were predicted with high certainty (.0.9) to have aPvPR1–99less than 1% were classed as unstable. Areas in which Duffy negativity
likely distinct between the two parasites in different endemic settings [51,57], and so the model was parameterised using an assembly of 67 finely age-stratified PvPR surveys (Protocol S2), with estimation carried out in a Bayesian model using MCMC. The parameterised model was then used to convert all observed survey prevalences to a standardised age-independent value for use in modelling, and then further allowed the output prevalence predictions to be generated for any arbitrary age range. We chose to generate maps of all-age infection prevalence, defined as individuals of age one to 99 years (thus PvPR1–99). We excluded
infection in those less than one year of age from the standardisa-tion because of the confounding effect of maternal antibodies, and because parasite rate surveys very rarely sample young infants. We deviated from the two-to-ten age range used for mapping P. falciparum [28,29] because the relatively lower prevalences has meant that surveys are far more commonly carried out across all age ranges.
Incorporating Duffy Negativity
Since Duffy negative individuals are largely refractory toP. vivax infection [58], high population frequencies of this phenotype have a dramatic suppressing effect on endemicity, even where conditions are otherwise well suited for transmission [26]. The predominance of Duffy negativity in Africa has led to a historical perception thatP. vivaxis absent from much of the continent, and a dearth of surveys or routine diagnoses testing for the parasite have served to entrench this mantra [59]. However, evidence exists of autochthonousP. vivaxtransmission across the continent [26], and therefore we did not preclude any areas at riska priori. Instead, we used a recent map of estimated Duffy negativity phenotypic frequency [43] and incorporated the potential influence of this blood group directly in the MBG modelling framework. The mapped Duffy-negative population fraction at each location was excluded from the denominator in PvPR survey data, such that any P. vivax positive individuals were considered to have arisen from the Duffy positive population subset. Thus in a location with 90% Duffy negativity, five positive individuals in a survey of 100 would give an assumed prevalence of 50% amongst Duffy positives. Correspondingly, prediction ofPvPR was then restricted to the Duffy positive proportion at each pixel, with the final prevalence estimate re-converted to relate to the total population. This approach has two key advantages. First, predictedPvPR at each location could never exceed the Duffy positive proportion, therefore ensuring biological consistency between theP. vivaxand Duffy negativity maps. Second, where PvPR survey data were sparse across much of Africa, the predictions could effectively borrow strength from the Duffy negativity map because predic-tions ofPvPR were restricted to a much narrower range of possible values.
Model Implementation and Map Generation
The P. vivaxendemic world was divided into four contiguous regions with broadly distinct biogeographical, entomological and epidemiological characteristics: the Americas and Africa formed separate regions, whilst Asia was subdivided into Central and South East sub-regions with a boundary at the Thailand-Malaysia border (see Protocol S2). This regionalisation was implemented in part to retain computational feasibility given the large number of data points, but also to allow model parameterisations to vary and better capture regional endemicity characteristics. Within each region, a separate MBG model was fitted using a bespoke MCMC algorithm [60] to generate predictions of PvPR1–99 for every
565 km pixel within the limits of stable transmission. The prediction year was set to 2010 and model outputs represent an
annualised average across the 12 months of that year. Model output consisted of a predicted posterior distribution ofPvPR1–99
for every pixel. A continuous endemicity map was generated using the mean of each posterior distribution as a point estimate. The uncertainty associated with predictions was summarised by maps showing the ratio of the posterior distribution inter-quartile range (IQR) to its mean. The IQR is a simple measure of the precision with which eachPvPR value was predicted, and standardisation by the mean produced an uncertainty index less affected by underlying prevalence levels and more illustrative of relative model performance driven by data densities in different locations. This index was then also weighted by the underlying population density to produce a second map indicative of those areas where uncertainty is likely to be most operationally important.
Refining Limits Definition and Population at Risk Estimates
In some regions within the estimated limits of stable transmis-sion,PvPR1–99was predicted to be extremely low, either because
of a dense abundance of survey data reporting zero infections or, in Africa, because of very high coincident Duffy negativity phenotype frequencies. Such areas are not appropriately described as being at risk of stable transmission and so we defined a decision rule whereby pixels predicted with high certainty (probability
.0.9) of being less than 1% PvPR1–99 were assigned to the
unstable class, thereby modifying the original transmission limits. These augmented mapped limits were combined with a 2010 population surface derived from the GRUMPbetaversion [52,53] to estimate the number of people living at unstable or stable risk within each country and region. The fraction of the population estimated to be Duffy negative [43] within each pixel was considered at no risk and therefore excluded from these totals.
Model Validation
A model validation procedure was implemented whereby 10% of the survey points in each model region were selected using a spatially declustered random sampling procedure. These subsets were held out and the model re-fitted in full using the remaining 90%. Model predictions were then compared to the hold-out data points and a number of different aspects of model performance were assessed using validation statistics described previously [28,29]. The validation procedure is detailed in full in Protocol S4.
Results
Model Validation
Full validation results are presented in Protocol S4. In brief, examination of the mean error in the generation of the P. vivax malaria endemicity point-estimate surface revealed minimal overall bias in predicted PvPR with a global mean error of
20.41 (Americas21.38, Africa 0.03, Central Asia20.43, South East Asia20.43), with values in units of PvPR on a percentage scale (see Protocol S4). The global value thus represents an overall tendency to underestimate prevalence by just under half of one percent. The mean absolute error, which measures the average magnitude of prediction errors, was 2.48 (Americas 5.05, Africa 0.53, Central Asia 1.52, South East Asia 3.37), again in units of PvPR (see Protocol S4).
GlobalPlasmodium vivaxEndemicity and Populations at Risk in 2010
data are shown in Figure 2A. The continuous surface ofP. vivax endemicity predicted within those limits is shown in Figure 2B. The uncertainty map (posterior IQR:mean ratio) is shown in Figure 3A and the population-weighted version in Figure 3B.
We estimate thatP. vivaxwas endemic across some 44 million square kilometres, approximately a third of the Earth’s land surface. Around half of this area was located in Africa (51%) and a quarter each in the Americas (22%) and Asia (27%) (Table 1). However, the uneven distribution of global populations, coupled with the protective influence of Duffy negativity in Africa, meant that the distribution of populations at risk was very different. An estimated 2.48 billion people lived at any risk ofP. vivaxin 2010 (Table 1), of which a large majority lived in Central Asia (82%) with much smaller fractions in South East Asia (9%), the Americas (6%), and Africa (3%). Of these, 1.52 billion lived in areas of unstable transmission where risk is very low and case incidence is unlikely to exceed one per 10,000 per annum. The remaining 964 million people at risk lived in areas of stable transmission, representing a wide diversity of endemic levels. The global distribution of populations in each risk class was similar to the total
at risk, such that over 80% of people in both classes lived in Central Asia (Table 1).
Plasmodium vivaxEndemicity in the Americas
Areas endemic forP. vivaxin the Americas extended to some 9.5 million square kilometres, of which the largest proportion was in the Amazonian region of Brazil (Figure 2B). Interestingly, only a relatively small fraction of these areas (15%) experienced unstable rather than stable transmission, suggesting a polarisation between areas at stable risk and those where the disease is absent altogether (Table 1). The regions of highest endemicity were found in Amazonia and in Central America – primarily Nicaragua and Honduras – with predicted meanPvPR1–99 exceeding 7% in all
three locations. An important feature ofP. vivaxthroughout the Americas is that its distribution is approximately inverse to that of the population. This is particularly true of the two most populous endemic countries of the region, Brazil and Mexico, and it means that, whilst the Americas contributed 53% of the land area experiencing stable transmission worldwide, they housed only 5% of the global population at that level of risk.
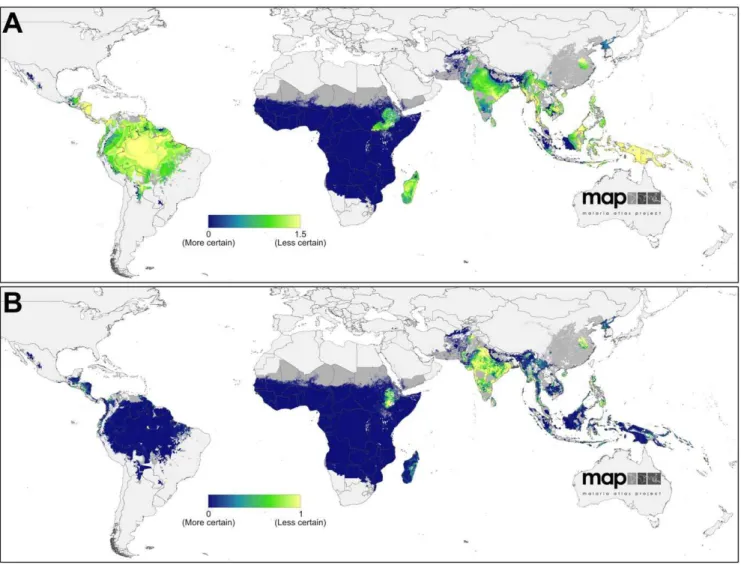
Figure 3. Uncertainty associated with predictions ofPlasmodium vivaxendemicity.Panel A shows the ratio of the posterior inter-quartile range to the posterior mean prediction at each pixel. Large values indicate greater uncertainty: the model predicts a relatively wide range ofPvPR1–99
as being equally plausible given the surrounding data. Conversely, smaller values indicate a tighter range of values have been predicted and, thus, a higher degree of certainty in the prediction. Panel B shows the same index multiplied by the underlying population density and rescaled to 0–1 to correspond to Panel A. Higher values indicate areas with high uncertainty and large populations.
Uncertainty in predictedPvPR1–99was relatively high
through-out much of the Americas (Figure 3B). This reflects the heterogeneous landscape of endemicity coupled with the generally scarce availability of parasite rate surveys in the region (see Figure 2A). However, when this uncertainty is weighted by the underlying population density (Figure 3B), its significance on a global scale is placed in context: because most areas at stable risk are sparsely populated, the population-weighted uncertainty was very low compared to parts of Africa and much of Asia.
Plasmodium vivaxEndemicity in Africa, Yemen and Saudi Arabia (Africa+)
Our decision to assume stable transmission ofP. vivaxin Africa unless robustPvAPI or biological mask data confirmed otherwise meant that much of the continent south of the Sahara was initially classified as being at stable risk (Figure 2A). However, by implementing the MBG predictions ofPvPR1–99 throughout this
range and reclassifyinga posteriorithose areas likely to fall below an endemicity threshold of 1%PvPR1–99, the majority of stable risk
areas were downgraded to unstable (Figure 2B). Thus, in the final maps, 92% of endemic Africa was at unstable risk, with the majority of Madagascar and Ethiopia, and parts of South Sudan and Somalia making up most of the remaining area at stable risk. Even in these areas, endemicity was uniformly low, with predicted endemicity values rarely exceeding a point estimate of 2%PvPR1–
99. We augmented the final map with an additional overlay mask
delineating areas where Duffy negativity phenotype prevalence has been predicted to exceed 90% (Figure 2B). The influence of this blood group on the estimated populations at risk is profound: of the 840 million Africans living in areas within which transmission is predicted to occur, only 86 million were considered at risk, contributing just 3% to the global total (Table 1).
Uncertainty in predictedPvPR1–99followed a similar pattern to
the magnitude of the predictions themselves (Figure 3B). Certainty around the very low predicted endemicity values covering most of the continent was extremely high – reflecting the increased precision gained by incorporating the Duffy negativity information that compensated for the paucity ofP. vivaxparasite rate surveys on the continent. The pockets of higher endemicity in Madagascar and northern East Africa were predicted with far less certainty. In the population-weighted uncertainty map (Figure 3B), the lower population densities of Madagascar reduced the index on that island whereas the densely populated Ethiopian highlands remained high.
Plasmodium vivaxEndemicity in Central and South East Asia
Large swathes of high endemicity, very large population densities and a negligible presence of Duffy negativity combine
to make the central and south-eastern regions of Asia by far the most globally significant forP. vivax. We estimate that India alone contributed nearly half (46%) of the global population at risk, and two thirds (67%) of those at stable risk. China is another major contributor with 19% of the global populations at risk, primarily in unstable transmission regions, whilst Indonesia and Pakistan together contributed a further 12%. Within regions of stable transmission, endemicity is predicted to be extremely heteroge-neous (Figure 2B). Areas where the point estimate of PvPR1–99
exceeded 7% were found in small pockets of India, Myanmar, Indonesia, and the Solomon Islands, with the largest such region located in Papua New Guinea.
The uncertainty map (Figure 3A) reveals how the most precise predictions were associated with areas of uniformly low endemicity and abundant surveys, such as Afghanistan and parts of Sumatra and Kalimantan in Indonesia. Conversely, areas with higher or more heterogeneous endemicity, such as throughout the island of New Guinea, were the most uncertain. The population-weighted uncertainty map (Figure 3B) differs substantively, indicating how the populous areas of Indonesia, for example, were relatively precisely predicted whereas India, China, and the Philippines had the largest per-capita uncertainty.
Discussion
The status ofP.vivax as a major public health threat affecting the world’s most populous regions is becoming increasingly well documented. The mantra of vivax malaria being a very rarely threatening and relatively benign disease [7,10] has been challenged with evidence suggesting that it can contribute a significant proportion of severe malaria disease and death attributable to malaria in some settings [61]. Some reports have pointed especially to very young children being a major source of morbidity [20,62] and some hospital-based studies have reported comparable mortality rates between patients classified with severe P. vivaxand severeP. falciparum[21,24,63]. The recognition of a lethal threat by this parasite comes with evidence of failing chemotherapeutics against the acute attack [64] and overdue acknowledgement of the practical inadequacy of the only available therapy against relapse [65]. As the international community defines increasingly ambitious targets to minimise malaria illness and death [66–68], and to progressively eliminate the disease from endemic areas [1–6], further sustained neglect ofP. vivaxbecomes increasingly untenable.
Here we have presented the first systematic attempt to map the global distribution ofP. vivaxendemicity using a defined evidence base, transparent methodologies, and with measured uncertainty. These new maps aim to contribute to a more rational international appraisal of the importance ofP. vivax in the broad context of Table 1.Area and populations at risk ofPlasmodium vivaxmalaria in 2010.
Region Area (million km2) Population (millions)
Unstable Stable Any risk Unstable Stable Any risk
America 1.38 8.08 9.46 87.66 49.79 137.45
Africa+ 20.60 1.86 22.46 48.72 37.66 86.38
C Asia 5.60 3.63 9.24 1,236.92 812.55 2,049.47
SE Asia 0.96 1.78 2.74 150.17 64.90 215.07
World 28.55 15.35 43.90 1,523.47 964.90 2,488.37
malaria control and elimination policies, as well as providing a practical tool to support control planning at national and sub-national levels.
InterpretingP. vivaxEndemicity in 2010
In 2010, areas endemic forP. vivaxcovered a huge geographical range spanning three major continental zones and extending into temperate climates. In the Americas, whilst important pockets of high endemicity are present, the majority of areas of stable transmission coincide with lower population densities, diminishing the contribution of this continent to global populations at risk. In Africa the protection conferred by Duffy negativity to most of the population means the large swathes of the continent in which transmission may occur contain only small populations at biological risk. Thus it is primarily in Asia where very large populations coincide with extensive high endemic regions, and as a result nine out of every ten people at risk ofP. vivaxglobally live on that continent.
A number of important contrasts arise when comparing this map with the equivalent 2010 iteration for P. falciparum [28]. Perhaps most obvious are the lower levels of observed endemicity at which P. vivaxtends to exist within populations experiencing stable transmission. We used a cartographic scale between 0% and 7% to differentiate global variation inP. vivaxendemicity, although point estimates exceeded that upper threshold in localised areas. For P. falciparum the equivalent scale spanned 0% to 70% [28], suggesting an approximate order-of-magnitude difference in prevalence of patent parasitemia. In part, this difference reflects the decision to standardise our predictions across the 1–99 age range, and values would have been higher if we had opted for the peak 2–10 age range used forP. falciparum. This difference might be accentuated by the likely more rapid acquisition of immunity to P. vivaxthanP. falciparumin the most highly endemic areas [57]. A number of other biological and epidemiological differences between the two species also mean these lower apparent levels of endemicity must be interpreted differently. One factor is the lower sensitivities of microscopy and RDT diagnoses for a given level ofP. vivaxinfection prevalence, because infections tend to be associated with much lower parasite densities which increase the likelihood of false negative diagnoses [9]. A number of studies in both high and low endemic settings have found microscopy to underestimate prevalence by a factor of up to three when compared with molecular diagnosis [57,69–72]. The decreasing cost and time implications of molecular diagnosis may mean that these gold standard diagnostic techniques become the standard for parasite rate surveys in the future. A global map of PCR-positive parasitemia rates would almost certainly reveal a larger underlying reservoir of infections and, possibly, reveal systematic differences in patterns of endemicity than we are able to resolve currently with less sensitive diagnostic methods.
The lower parasite loads must be interpreted in the context of implications for progression to clinical disease. For example, Plasmodium vivaxis known to induce fevers at comparatively lower parasite densities thanP. falciparum, a feature likely linked to overall inflammatory responses of greater magnitude [16].P. vivaxis also comparable to P. falciparum in its potential to cause anaemia regardless of lower parasite densities, due to a combination of dyserythropoesis and repeated bouts of haemolysis [22]. A recent hospital-based study at a site in eastern Indonesia of hypo- to meso-endemic transmission of both species showed far lower frequencies of parasitemia.6,000/uL among inpatients classified as having not serious, serious, and fatal illness with a diagnosis ofP. vivaxcompared toP. falciparum[24]. Further, the majority of case reports describing severe and fatal illness with a diagnosis of vivax
malaria typically show parasitemia .5,000/uL. In contrast, the World Health Organization threshold for severe illness attribut-able to hyperparasitemia withP. falciparumis.200,000/uL [73]. In brief, the relationship between prevalence and risk of disease and transmission forP. vivaxis distinct from that forP. falciparum, and it is weighted more heavily towards substantial risks at much lower parasite densities and levels of prevalence of microscopically patent parasitemia.
The capacity of P. vivax hypnozoites to induce relapsing infections has a number of important implications. First, because dormant liver stage infections are not detectable in routine parasite rate surveys, our maps do not capture the potentially very large reservoir of asymptomatic infections sequestered in each popula-tion. Evidence is emerging that this hidden reservoir may be substantially larger than previously thought, with long-latencyP. vivax phenotypes both prevalent and geographically widespread [37]. Whilst not contributing to clinical disease until activated, these dormant hypnozoites ultimately play a vital role in sustaining transmission since they are refractory to blood-stage antimalarial chemotherapy and interventions to reduce transmission. Hypno-zoites also ensure an ability of P. vivax to survive in climatic conditions that cannot sustainP. falciparumtransmission. Second, theP. vivax parasite rates observed in population surveys detect both new and relapsing infections, although the two are almost never distinguishable. This confounds the relationship between observed infection prevalence and measures of transmission intensity such as force of infection or the entomological inoculation rate. This, in turn, has implications for the use of transmission models seeking to evaluate or optimise control options forP. vivax [2,9,27,74]. The current unavailability of any diagnostic method for detecting hypnozoites [75] and our resulting ignorance about the size and geographic distribution of this reservoir therefore remain critical knowledge gaps limiting the feasibility of regional elimination [9]. It is also worth noting that conventional parasite rate data do not measure multiplicity of infection which is an additional potential confounding effect between observed infection prevalence and transmission intensity.
P. vivaxin Africa and Duffy Polymorphism
movement go beyond the effect of Duffy negativity: the carriage of parasites from high to low endemic regions, for example by migratory workers, may play an important role in sustaining transmission in some regions and further research is required to investigate such processes.
Mapping to Guide Control
There exists forP. falciparuma history of control strategies linked explicitly to defined strata of endemicity, starting with the first Global Malaria Eradication Programme [18,87,88] and undergo-ing a series of refinements that now feature in contemporary control and elimination efforts. Most recently, stratification has been supported by insights gained from mathematical models linking endemic levels to optimum intervention suites, control options, and timelines for elimination planning [2,89–95]. In stark contrast, control options forP. vivax are rarely differentiated by endemicity, and there is little consensus around how this may be done. In part, the absence of agreed control-oriented strata ofP. vivax endemicity stems from the biological complexities and knowledge gaps that prevent direct interpretation of infection prevalence as a metric for guiding control. It is also to some extent inevitable that the dogma of unstratified control becomes self-propagating: risk maps are not created because control is not differentiated by endemicity, but that differentiation cannot proceed without reliable maps.
As well as providing a basis for stratified control and treatment, the endemicity maps presented here have a number of potential applications in combination with other related maps. First, there is an urgent need to better identify regions where high P. vivax endemicity is coincident with significant population prevalence of glucose-6-phosphate dehydrogenase deficiency (G6PDd). This inherited blood disorder plays a key role in chemotherapy policy for P. vivax because primaquine, the only registered drug active against the hypnozoite liver stage is contra-indicated in G6PDd individuals in whom it can cause severe and potentially fatal haemolytic reactions [96,97]. A new global map of G6PDd prevalence is now available (Howes et al, submitted) which can be combined with the endemicity maps presented here to provide a rational basis for estimating adverse outcomes and setting appro-priate testing and treatment protocols. Moreover, in practice most clinical infections are managed without differentiating the causative parasite species: combining the endemicity maps forP. vivaxandP. falciparummay therefore inform unified strategies for malaria control programs and policy [28]. It has been proposed, for example, that artemesinin-based combination therapy (ACT) be adopted for all presumptively diagnosed malaria in areas coendemic for both species, as opposed to a separate ACT/chloroquine treatment strategy [98]. Further, in some regions more than 50% of patients diagnosed with falciparum malaria go on to experience an attack of vivax malaria in the absence of risk of reinfection [99]. This high prevalence of hypnozoites may also justify presumptive therapy with primaquine against relapse with any diagnosis of malaria where the two species occur at relatively high frequencies. Such geographically specific cross-parasite treatment considerations hinge on robust risk maps for both species.
Future Challenges in P. vivaxCartography
Numerous research and operational challenges remain unad-dressed that would provide vital insights into the geographical distribution ofP. vivaxand its impacts on populations. Perhaps the highest priority is to improve understanding of the link between infection prevalence and clinical burden in both P. vivax mono-endemic settings and where it is comono-endemic with P. falciparum. Official estimates of national and regional disease burdens forP.
vivaxremain reliant on routine case reporting of unknown fidelity and are only crudely distinguished fromP. falciparum[100]. It is illuminating that only 53 of the 95P. vivaxendemic countries were able to provide vivax-specific routine case reporting data, and there is a clear mandate for strengthening the routine diagnosis and reporting of P. vivax cases. Cartographic approaches to estimating P. vivax burden can therefore play a crucial role in triangulating with these estimates to provide insight into the distribution of the disease independent of health system surveil-lance and its attendant biases [27,101–105]. There is also a particular need to define burden and clinical outcomes associated withP. vivaxin pregnancy [9,106] and other clinically vulnerable groups, most notably young children. Linking infection prevalence to clinical burden implies the need to better understand the contribution of relapsing infections to disease. Whilst the magnitude of this contribution is known to be highly heteroge-neous, its geographical pattern is poorly measured and causal factors only partially understood [39,41].
Further challenges lie in understanding howP. falciparumandP. vivax interact within human hosts and how these interactions manifest at population levels. Comparison of the maps for each species reveals a complete spectrum from areas endemic for only one parasite through to others where both species are present at broadly equal levels. Whilst identifying these patterns of coendemicity is an important first step, the implications in terms of risks of coinfection and clinical outcomes, antagonistic mechanisms leading to elevated severe disease risk, or cross-protective mechanisms of acquired immunity remain disputed [20,107–109].
Conclusions
To meet international targets for reduced malaria illness and death, and to progress the cause of regional elimination, the malaria research and control communities can no longer afford to neglect the impact of P. vivax. Its unique biology and global ubiquity present challenges to its elimination that greatly surpass those of its higher-profile cousin, P. falciparum. Making serious gains against the disease will require substantive strengthening of the evidence base on almost every aspect of its biology, epidemiology, control and treatment. The maps presented here are intended to contribute to this effort. They are all made freely available from the MAP website [110] along with regional and individual maps for every malaria-endemic country. Users can access individual map images or download the global surfaces for use in a geographical information system, allowing them to integrate this work within their own analyses or produce bespoke data overlays and displays. We will also make available, where permissions have been obtained, all underlyingP. vivax parasite rate surveys used in this work.
Supporting Information
Protocol S1 Updating the global spatial limits of Plasmodium vivaxmalaria transmission for 2010.S1.1 Overview. S1.2 Identifying Countries ConsideredP. vivaxMalaria Endemic. S1.3 Updating National Risk Extents with P. vivax Annual Parasite Incidence Data. S1.4 Biological Masks of Transmission Exclusion. S1.5 Risk Modulation Based on Medical Intelligence. S1.6 Assembling theP. vivaxSpatial Limits Map. S1.7 Refining Regions of Unstable Transmission after MBG Modelling. S1.8 Predicting Populations at Risk ofP. vivaxin 2010.
(DOC)
PvPR Data. S2.2 Database Fidelity Checks. S2.3 Data Exclusions. S2.4 ThePvPR Input Data Set. S2.5 Age-Standardisation. S2.6 Regionalisation.
(DOC)
Protocol S3 Bayesian model-based geostatistical frame-work for predictingPvPR
1–99.S3.1 Bayesian Inference. S3.2
Model Overview. S3.3 Formal Presentation of Model. (DOC)
Protocol S4 Model validation procedures and additional results. S4.1 Creation of Validation Sets. S4.2 Procedures for Testing Model Performance. S4.3 Validation Results.
(DOC)
Acknowledgments
The large global assembly of parasite prevalence data was critically dependent on the generous contributions of data made by a large number of people in the malaria research and control communities and these individuals are listed on the MAP website (http://www.map.ac.uk/ acknowledgements). We thank Professor David Rogers for providing the Fourier-processed remote sensing data. We are grateful for the comments of three anonymous referees that have helped strengthen the manuscript.
Author Contributions
Conceived and designed the experiments: PWG SIH. Performed the experiments: PWG APP DLS. Analyzed the data: PWG APP DLS IRFE CAG KEB. Contributed reagents/materials/analysis tools: IRFE CLM CAG MFM KEB APP AJT REH DBG PH HFLW RNP IM JKB. Wrote the paper: PWG.
References
1. MalERA (2011) Introduction: a research agenda to underpin malaria eradication. PLoS Med 8: e1000406.
2. Chitnis N, Schapira A, Smith DL, Smith T, Hay SI, et al. (2010) Mathematical modeling to support malaria control and elimination. Roll Back Malaria Progress and Impact Series, number 5. Geneva, Switzerland: Roll Back Malaria. 48 p.
3. Tanner M, Hommel M (2010) Towards malaria elimination–a new thematic series. Malaria J 9: 24.
4. Feachem RGA, Phillips AA, Targett GA, on behalf of the Malaria Elimination Group, editors (2009) Shrinking the Malaria Map: a Prospectus on Malaria Elimination. San Francisco, U.S.A.: The Global Health Group, University of California - Santa Cruz Global Health Sciences. 187 p.
5. Moonen B, Cohen JM, Snow RW, Slutsker L, Drakeley C, et al. (2010) Operational strategies to achieve and maintain malaria elimination. Lancet 376: 1592–1603.
6. Tatem A, Smith D, Gething P, Kabaria C, Snow R, et al. (2010) Ranking elimination feasibility among malaria endemic countries. Lancet 376: 1579–1591. 7. Baird JK (2007) Neglect ofPlasmodium vivaxmalaria. Trends Parasitol 23: 533–
539.
8. Mendis K, Sina BJ, Marchesini P, Carter R (2001) The neglected burden of
Plasmodium vivaxmalaria. Am J Trop Med Hyg 64: 97–106.
9. Mueller I, Galinski MR, Baird JK, Carlton JM, Kochar DK, et al. (2009) Key gaps in the knowledge ofPlasmodium vivax, a neglected human malaria parasite. Lancet Infect Dis 9: 555–566.
10. Price RN, Tjitra E, Guerra CA, Yeung S, White NJ, et al. (2007)Vivaxmalaria: neglected and not benign. Am J Trop Med Hyg 77: 79–87.
11. Carlton JM, Sina BJ, Adams JH (2011) Why IsPlasmodium vivaxa neglected tropical disease? PLoS Neglect Trop D 5: e1160.
12. PATH (2011) Staying the Course? Malaria Research and Development in a Time of Economic Uncertainty. Seattle: PATH.
13. Bockarie MJ, Dagoro H (2006) Are insecticide-treated bednets more protective against Plasmodium falciparum than Plasmodium vivax-infected mosquitoes? Malaria J 5: 15.
14. Luxemburger C, Perea WA, Delmas G, Pruja C, Pecoul B, et al. (1994) Permethrin-impregnated bed nets for the prevention of malaria in schoolchil-dren on the Thai-Burmese border. T Roy Soc Trop Med H 88: 155–159. 15. Bousema T, Drakeley C (2011) Epidemiology and infectivity ofPlasmodium
falciparumandPlasmodium vivaxgametocytes in relation to malaria control and elimination. Clin Microbiol Rev 24: 377–410.
16. Andrade B, Reis-Filho A, Souza-Neto S, Clarencio J, Camargo L, et al. (2010) Severe Plasmodium vivax malaria exhibits marked inflammatory imbalance. Malaria J 9: 13.
17. Baird JK (2010) Eliminating malaria - all of them. Lancet 376: 1883–1885. 18. Yekutiel P (1980) III The Global Malaria Eradication Campaign. In: Klingberg
MA, editor. Eradication of infectious diseases: a critical study. Basel, Switzerland: Karger. pp. 34–88.
19. Barcus MJ, Basri H, Picarima H, Manyakori C, Sekartuti, et al. (2007) Demographic risk factors for severe and fatalvivaxand falciparum malaria among hospital admissions in northeastern Indonesian Papua. Am J Trop Med Hyg 77: 984–991.
20. Genton B, D’Acremont V, Rare L, Baea K, Reeder JC, et al. (2008)Plasmodium vivaxand mixed infections are associated with severe malaria in children: a prospective cohort study from Papua New Guinea. PLoS Med 5: e127. 21. Tjitra E, Anstey NM, Sugiarto P, Warikar N, Kenangalem E, et al. (2008)
Multidrug-resistantPlasmodium vivaxassociated with severe and fatal malaria: a prospective study in Papua, Indonesia. PLoS Med 5: e128.
22. Anstey NM, Russell B, Yeo TW, Price RN (2009) The pathophysiology ofvivax
malaria. Trends Parasitol 25: 220–227.
23. Kochar DK, Das A, Kochar SK, Saxena V, Sirohi P, et al. (2009) Severe
Plasmodium vivaxmalaria: a report on serial cases from Bikaner in northwestern India. Am J Trop Med Hyg 80: 194–198.
24. Nurleila S, Syafruddin D, Elyazar IRF, Baird JK (2011) Morbidity and mortality caused byfalciparumandvivaxmalaria in hypo- to meso-endemic West Sumba, Indonesia: a two year retrospective hospital-based study. Am J Trop Med Hyg 85 (Suppl 451-A-516): 471.
25. Kochar DK, Saxena V, Singh N, Kochar SK, Kumar SV, et al. (2005)
Plasmodium vivaxmalaria. Emerg Infect Dis 11: 132–134.
26. Guerra CA, Howes RE, Patil AP, Gething PW, Van Boeckel TP, et al. (2010) The international limits and population at risk ofPlasmodium vivaxtransmission in 2009. PLoS Neglect Trop D 4: e774.
27. MalERA (2011) A Research Agenda for Malaria Eradication: monitoring, evaluation, and surveillance. PLoS Med 8: e1000400.
28. Gething P, Patil A, Smith D, Guerra C, Elyazar I, et al. (2011) A new world malaria map:Plasmodium falciparumendemicity in 2010. Malaria J 10: 378. 29. Hay SI, Guerra CA, Gething PW, Patil AP, Tatem AJ, et al. (2009) A world
malaria map: Plasmodium falciparum endemicity in 2007. PLoS Med 6: e1000048.
30. Hay SI, Snow RW (2006) The Malaria Atlas Project: developing global maps of malaria risk. PLoS Med 3: e473.
31. Global Partnership to Roll Back Malaria, Johansson EW, Cibulskis RE, Steketee RW (2010) Malaria funding and resource utilization: the first decade of Roll Back Malaria. Geneva, Switzerland: World Health Organization on behalf of the Roll Back Malaria Partnership Secretariat. 95 p.
32. McLaughlin C, Levy J, Noonan K, Rosqueta K (2009) Lifting the burden of malaria: an investment guide for impact-driven philanthropy. Philadelphia: The Center for High Impact Philanthropy. 1–79 p.
33. Zanzibar Malaria Control Program (2009) Malaria elimination in Zanzibar: a feasibility assessment. Zanzibar, Tanzania: Zanzibar Ministry of Health and Social Welfare.
34. Anonymous (2009) Kenya Malaria Monitoring and Evaluation Plan 2009– 2017. Nairobi, Kenya: Division of Malaria Control, Ministry of Public Health and Sanitation, Government of Kenya.
35. World Bank (2009) World Development Report 2009: Reshaping Economic Geography. Washington, DC. 383 p.
36. DFID (2010) Breaking the Cycle: Saving Lives and Protecting the Future. The UK’s Framework for Results for Malaria in the Developing World. London, UK. 65 p.
37. White NJ (2011) Determinants of relapse periodicity in Plasmodium vivax
malaria. Malaria J 10: 297.
38. Krotoski WA, Collins WE, Bray RS, Garnham PC, Cogswell FB, et al. (1982) Demonstration of hypnozoites in sporozoite-transmitted Plasmodium vivax
infection. Am J Trop Med Hyg 31: 1291–1293.
39. Betuela I, Rosanas A, Kiniboro B, Stanisic D, Samol L, et al. (2011) Relapses are contributing significantly to risk ofP. vivaxinfection and disease in Papua New Guinean children 1–5 years of age. Trop Med Int Health 16: 60–61. 40. Orjuela-Sanchez P, da Silva NS, da Silva-Nunes M, Ferreira MU (2009)
Recurrent parasitemias and population dynamics ofPlasmodium vivax polymor-phisms in rural Amazonia. Am J Trop Med Hyg 81: 961–968.
41. Battle KE, Van Boeckel T, Gething PW, Baird JK, Hay SI (2011) A review of the geographical variations inPlasmodium vivaxrelapse rate. Am J Trop Med Hyg 85 (Suppl 451-A-516): 470.
42. Mercereau-Puijalon O, Menard D (2010) Plasmodium vivaxand the Duffy antigen: a paradigm revisited. Transfus Clin Biol: 176–183.
43. Howes RE, Patil AP, Piel FB, Nyangiri OA, Kabaria CW, et al. (2011) The global distribution of the Duffy blood group. Nat Commun 2: 266. 44. Guerra CA, Gikandi PW, Tatem AJ, Noor AM, Smith DL, et al. (2008) The
limits and intensity of Plasmodium falciparum transmission: implications for malaria control and elimination worldwide. PLoS Med 5: e38.
46. Guerra CA, Hay SI, Lucioparedes LS, Gikandi PW, Tatem AJ, et al. (2007) Assembling a global database of malaria parasite prevalence for the Malaria Atlas Project. Malaria J 6: 17.
47. Diggle PJ, Tawn JA, Moyeed RA (1998) Model-based geostatistics. J Roy Stat Soc C-App 47: 299–326.
48. Diggle PJ, Ribeiro PJ (2007) Model-based geostatistics; Bickel P, Diggle P, Fienberg S, Gather U, Olkin I et al., editors. New York: Springer. 228 p. 49. Gething PW, Patil AP, Hay SI (2010) Quantifying aggregated uncertainty in
Plasmodium falciparummalaria prevalence and populations at riskviaefficient space-time geostatistical joint simulation. PLoS Comput Biol 6: e1000724. 50. Patil AP, Gething PW, Piel FB, Hay SI (2011) Bayesian geostatistics in health
cartography: the perspective of malaria. Trends Parasitol 27: 245–252. 51. Lin E, Kiniboro B, Gray L, Dobbie S, Robinson L, et al. (2010) Differential
patterns of infection and disease withP. falciparumandP. vivaxin young Papua New Guinean children. PLoS One 5: e9047.
52. Balk DL, Deichmann U, Yetman G, Pozzi F, Hay SI, et al. (2006) Determining global population distribution: methods, applications and data. Adv Parasitol 62: 119–156.
53. CIESIN/IFPRI/WB/CIAT (2007) Global Rural Urban Mapping Project (GRUMP) alpha: Gridded Population of the World, version 2, with urban reallocation (GPW-UR). Available: http://sedac.ciesin.columbia.edu/gpw. Palisades, New York, USA: Center for International Earth Science Information Network, Columbia University/International Food Policy Research Institute/ The World Bank/and Centro Internacional de Agricultura Tropical. 54. Scharlemann JP, Benz D, Hay SI, Purse BV, Tatem AJ, et al. (2008) Global
data for ecology and epidemiology: a novel algorithm for temporal Fourier processing. MODIS data. 3: e1408.
55. Hay SI, Tatem AJ, Graham AJ, Goetz SJ, Rogers DJ (2006) Global environmental data for mapping infectious disease distribution. Adv Parasitol 62: 37–77.
56. Smith DL, Guerra CA, Snow RW, Hay SI (2007) Standardizing estimates of thePlasmodium falciparumparasite rate. Malaria J 6: 131.
57. Mueller I, Widmer S, Michel D, Maraga S, McNamara DT, et al. (2009) High sensitivity detection of Plasmodium species reveals positive correlations between infections of different species, shifts in age distribution and reduced local variation in Papua New Guinea. Malar J 8: 41.
58. Miller LH, Mason SJ, Clyde DF, McGinniss MH (1976) Resistance factor to
Plasmodium vivaxin blacks Duffy-blood-group genotype, FyFy. New Engl J Med 295: 302–304.
59. Rosenberg R (2007)Plasmodium vivaxin Africa: hidden in plain sight? Trends Parasitol 23: 193–196.
60. Patil A, Huard D, Fonnesbeck CJ (2010) PyMC: Bayesian stochastic modelling in Python. J Stat Softw 35: e1000301.
61. Price RN, Douglas NM, Anstey NM (2009) New developments inPlasmodium vivaxmalaria: severe disease and the rise of chloroquine resistance. Curr Opin Infect Dis 22: 430–435.
62. Poespoprodjo JR, Fobia W, Kenangalem E, Lampah DA, Hasanuddin A, et al. (2009)Vivaxmalaria: a major cause of morbidity in early infancy. Clin Infect Dis 48: 1704–1712.
63. Rogerson SJ, Carter R (2008) Severe vivax malaria: newly recognised or rediscovered. PLoS Med 5: e136.
64. Baird JK (2009) Resistance to therapies for infection byPlasmodium vivax. Clin Microbiol Rev 22: 508–534.
65. Baird JK, Surjadjaja C (2011) Consideration of ethics in primaquine therapy against malaria transmission. Trends Parasitol 27: 11–16.
66. Anonymous The Abuja Declaration and the Plan of Action: An extract from The African Summit on Roll Back Malaria, Abuja, 25 April 2000 (WHO/ CDS/RBM/2000.17) Roll Back Malaria/World Health Organization. 1–11 p. 67. WHO (2005) Global strategic plan. Roll Back Malaria. 2005–2015. Geneva:
World Health Organization. 44 p.
68. RBMP (2008) The global malaria action plan for a malaria free world. Geneva, Switzerland: Roll Back Malaria Partnership (R.B.M.P), World Health Organization.
69. Harris I, Sharrock WW, Bain LM, Gray KA, Bobogare A, et al. (2010) A large proportion of asymptomatic Plasmodium infections with low and sub-microscopic parasite densities in the low transmission setting of Temotu Province, Solomon Islands: challenges for malaria diagnostics in an elimination setting. 9: 254.
70. Katsuragawa TH, Soares Gil LH, Tada MS, de Almeida e Silva A, Neves Costa JDA, et al. (2010) The dynamics of transmission and spatial distribution of malaria in riverside areas of Porto Velho, Rondonia, in the Amazon region of Brazil. PLoS One 5.
71. da Silva NS, da Silva-Nunes M, Malafronte RS, Menezes MJ, D’Arcadia RR, et al. (2010) Epidemiology and control of frontier malaria in Brazil: lessons from community-based studies in rural Amazonia. Trans Roy Soc Trop Med Hyg 104: 343–350.
72. Steenkeste N, Rogers WO, Okell L, Jeanne I, Incardona S, et al. (2010) Sub-microscopic malaria cases and mixed malaria infection in a remote area of high malaria endemicity in Rattanakiri province, Cambodia: implication for malaria elimination. 9: 108.
73. WHO (2010) Guidelines for the treatment of malaria. Second edition. Geneva, Switzerland: World Health Organization. 194 p.
74. MalERA (2011) A Research Agenda for Malaria Eradication: modeling. PLoS Med 8: e1000403.
75. MalERA (2011) A Research Agenda for Malaria Eradication: diagnoses and diagnostics. PLoS Med 8: 1–10.
76. Menard D, Barnadas C, Bouchier C, Henry-Halldin C, Gray LR, et al. (2010)
Plasmodium vivax clinical malaria is commonly observed in Duffy-negative Malagasy people. P Natl Acad Sci USA 107: 5967–5971.
77. Mendes C, Dias F, Figueiredo J, Mora VG, Cano J, et al. (2011) Duffy negative antigen is no longer a barrier toPlasmodium vivax– molecular evidences from the African west coast (Angola and Equatorial Guinea). PLoS Neglect Trop D 5: e1192.
78. Wurtz N, Lekweiry KM, Bogreau H, Pradines B, Rogier C, et al. (2011)Vivax
malaria in Mauritania includes infection of a Duffy-negative individual. Malaria J 10: 336.
79. Ryan JR, Stoute JA, Amon J, Dunton RF, Mtalib R, et al. (2006) Evidence for transmission ofPlasmodium vivaxamong a Duffy antigen negative population in western Kenya. Am J Trop Med Hyg 75: 575–581.
80. Koita OA, Sangare´ L, Sango HA, Dao S, Keita N, et al. (2012) Effect of Seasonality and Ecological Factors on the Prevalence of the Four Malaria Parasite Species in Northern Mali. J Trop Med 2012.
81. Pasvol G (2007) Eroding the resistance of Duffy negativity to invasion by
Plasmodium vivax? T Roy Soc Trop Med H 101: 953–954.
82. Cavasini CE, Mattos LCd, Couto AA, Bonini-Domingos CR, Valencia SH, et al. (2007) Plasmodium vivax infection among Duffy antigen-negative individuals from the Brazilian Amazon region: an exception? T Roy Soc Trop Med H 101: 1042–1044.
83. Kasehagen LJ, Mueller I, Kiniboro B, Bockarie MJ, Reeder JC, et al. (2007) Reduced Plasmodium vivax Erythrocyte Infection in PNG Duffy-Negative Heterozygotes. PLoS One 2.
84. Sousa TN, Sanchez BAM, Ceravolo IP, Carvalho LH, Brito CFA (2007) Real-time multiplex allele-specific polymerase chain reaction for genotyping of the Duffy antigen, thePlasmodium vivaxinvasion receptor. Vox Sang 92: 373–380. 85. Cavasini CE, de Mattos LC, D’Almeida Couto AAR, D’Almeida Couto VSC, Gollino Y, et al. (2007) Duffy blood group gene polymorphisms among malaria vivax patients in four areas of the Brazilian Amazon region. Malaria J 6: 167. 86. Albuquerque SRL, Cavalcante FD, Sanguino EC, Tezza L, Chacon F, et al. (2010) FY polymorphisms and vivax malaria in inhabitants of Amazonas State, Brazil. Parasitol Res 106: 1049–1053.
87. Pampana E (1969) A textbook of malaria eradication. London: Oxford University Press.
88. Macdonald G, Go¨eckel GW (1964) The malaria parasite rate and interruption of transmission. Bull World Health Organ 31: 365–377.
89. Smith DL, Hay SI (2009) Endemicity response timelines for Plasmodium falciparumelimination. Malaria J 8: 87.
90. Smith T, Maire N, Ross A, Penny M, Chitnis N, et al. (2008) Towards a comprehensive simulation model of malaria epidemiology and control. Parasitology 135: 1507–1516.
91. Chitnis N, Schapira A, Smith T, Steketee R (2010) Comparing the effectiveness of malaria vector-control interventions through a mathematical model. Am J Trop Med Hyg 83: 230–240.
92. Smith T, Killeen GF, Maire N, Ross A, Molineaux L, et al. (2006) Mathematical modeling of the impact of malaria vaccines on the clinical epidemiology and natural history ofPlasmodium falciparummalaria: Overview. Am J Trop Med Hyg 75: 1–10.
93. Ross A, Maire N, Sicuri E, Smith T, Conteh L (2011) Determinants of the cost-effectiveness of intermittent preventive treatment for malaria in infants and children. PLoS One 6: e18391.
94. Okell LC, Drakeley CJ, Bousema T, Whitty CJ, Ghani AC (2008) Modelling the impact of artemisinin combination therapy and long-acting treatments on malaria transmission intensity. PLoS Med 5: e226.
95. Griffin JT, Hollingsworth TD, Okell LC, Churcher TS, White M, et al. (2010) ReducingPlasmodium falciparummalaria transmission in Africa: a model-based evaluation of intervention strategies. PLoS Med 7: e1000324.
96. Ruwende C, Hill A (1998) Glucose-6-phosphate dehydrogenase deficiency and malaria. J Mol Med 76: 581–588.
97. Cappellini MD, Fiorelli G (2008) Glucose-6-phosphate dehydrogenase deficiency. Lancet 371: 64–74.
98. Douglas NM, Anstey NM, Angus BJ, Nosten F, Price RN (2010) Artemisinin combination therapy forvivaxmalaria. Lancet Infect Dis 10: 405–416. 99. Douglas NM, Nosten F, Ashley EA, Phaiphun L, van Vugt M, et al. (2011)
Plasmodium vivaxrecurrence following falciparum and mixed species malaria: risk factors and effect of antimalarial kinetics. Clin Infec Dis 52: 612–620. 100. WHO (2011) World malaria report 2011. Geneva: World Health
Organiza-tion. 246 p.
101. Rowe AK, Kachur SP, Yoon SS, Lynch M, Slutsker L, et al. (2009) Caution is required when using health facility-based data to evaluate the health impact of malaria control efforts in Africa. Malaria J 8: 209.
102. Gupta S, Gunter J, Novak R, Regens J (2009) Patterns ofPlasmodium vivaxand
Plasmodium falciparummalaria underscore importance of data collection from private health care facilities in India. Malaria J 8: 227.
103. Hay SI, Gething PW, Snow RW (2010) India’s invisible malaria burden. Lancet 376: 1716–1717.
105. Hay SI, Okiro EA, Gething PW, Patil AP, Tatem AJ, et al. (2010) Estimating the global clinical burden ofPlasmodium falciparummalaria in 2007. PLoS Med 7: e1000290.
106. Nosten F, McGready R, Simpson JA, Thwai KL, Balkan S, et al. (1999) Effects ofPlasmodium vivaxmalaria in pregnancy. Lancet 354: 546–549.
107. Snounou G, White NJ (2004) The co-existence ofPlasmodium: sidelights from
falciparumandvivaxmalaria in Thailand. Trends Parasitol 20: 333–339.
108. Maitland K, Williams TN, Bennett S, Newbold CI, Peto TEA, et al. (1996) The interaction betweenPlasmodium falciparumandP. vivaxin children on Espiritu Santo island, Vanuatu. T Roy Soc Trop Med H 90: 614–620.
109. Maitland K, Williams TN, Newbold CI (1997) Plasmodium vivax and P. falciparum: biological interactions and the possibility of cross-species immunity. Parasitol Today 13: 227–231.