Assessing Causality in the Association between Child
Adiposity and Physical Activity Levels: A Mendelian
Randomization Analysis
Rebecca C. Richmond1, George Davey Smith1, Andy R. Ness2, Marcel den Hoed3, George McMahon1,
Nicholas J. Timpson1*
1MRC Integrative Epidemiology Unit, School of Social and Community Medicine, University of Bristol, Bristol, United Kingdom,2Department of Oral and Dental Science, University of Bristol, Bristol, United Kingdom,3Molecular Epidemiology and Science for Life Laboratory, Department of Medical Sciences, Uppsala University, Uppsala, Sweden
Abstract
Background:Cross-sectional studies have shown that objectively measured physical activity is associated with childhood adiposity, and a strong inverse dose–response association with body mass index (BMI) has been found. However, few studies have explored the extent to which this association reflects reverse causation. We aimed to determine whether childhood adiposity causally influences levels of physical activity using genetic variants reliably associated with adiposity to estimate causal effects.
Methods and Findings:The Avon Longitudinal Study of Parents and Children collected data on objectively assessed activity levels of 4,296 children at age 11 y with recorded BMI and genotypic data. We used 32 established genetic correlates of BMI combined in a weighted allelic score as an instrumental variable for adiposity to estimate the causal effect of adiposity on activity. In observational analysis, a 3.3 kg/m2(one standard deviation) higher BMI was associated with 22.3 (95% CI, 17.0, 27.6) movement counts/min less total physical activity (p= 1.6610216), 2.6 (2.1, 3.1) min/d less moderate-to-vigorous-intensity activity (p= 3.7610229), and 3.5 (1.5, 5.5) min/d more sedentary time (p= 5.061024). In Mendelian randomization analyses, the same difference in BMI was associated with 32.4 (0.9, 63.9) movement counts/min less total physical activity (p= 0.04) (,5.3% of the mean counts/minute), 2.8 (0.1, 5.5) min/d less moderate-to-vigorous-intensity activity (p= 0.04), and 13.2 (1.3, 25.2) min/d more sedentary time (p= 0.03). There was no strong evidence for a difference between variable estimates from observational estimates. Similar results were obtained using fat mass index. Low power and poor instrumentation of activity limited causal analysis of the influence of physical activity on BMI.
Conclusions:Our results suggest that increased adiposity causes a reduction in physical activity in children and support research into the targeting of BMI in efforts to increase childhood activity levels. Importantly, this does not exclude lower physical activity also leading to increased adiposity, i.e., bidirectional causation.
Please see later in the article for the Editors’ Summary.
Citation:Richmond RC, Davey Smith G, Ness AR, den Hoed M, McMahon G, et al. (2014) Assessing Causality in the Association between Child Adiposity and Physical Activity Levels: A Mendelian Randomization Analysis. PLoS Med 11(3): e1001618. doi:10.1371/journal.pmed.1001618
Academic Editor:David S. Ludwig, Boston Children’s Hospital, United States of America ReceivedMay 14, 2013;AcceptedFebruary 5, 2014;PublishedMarch 18, 2014
Copyright:ß2014 Richmond et al. This is an open-access article distributed under the terms of the Creative Commons Attribution License, which permits unrestricted use, distribution, and reproduction in any medium, provided the original author and source are credited.
Funding:RCR is funded by the Wellcome Trust 4-year studentship (Grant Code: WT083431MF). NJT, GDS, and GM work within the Integrative Epidemiology Unit (IEU), which is supported by the MRC (MC_UU_12013/1 and MC_UU_12013/3) and the University of Bristol. ARN works within the NIHR Biomedical Research Unit at the University of Bristol and the University Hospitals Bristol NHS Foundation Trust in Nutrition, Diet and Lifestyle. The UK Medical Research Council and the Wellcome Trust (Grant ref: 092731) and the University of Bristol provide core support for ALSPAC. The funders had no role in study design, data collection and analysis, decision to publish, or preparation of the manuscript.
Competing Interests:GDS is a member of the Editorial Board ofPLOS Medicine. All other authors have declared that no competing interests exist. Abbreviations:ALSPAC, Avon Longitudinal Study of Parents and Children; BMI, body mass index; DWH, Durbin-Wu-Hausman; FMI, fat mass index; GWAS, genome wide association study; MR, Mendelian randomization; SD, standard deviation; SNP, single nucleotide polymorphism.
* E-mail: [email protected]
Introduction
Cross-sectional studies have shown that objectively measured physical activity is associated with childhood adiposity [1–6], and a strong inverse dose–response association with body mass index (BMI) has been found [1]. However, confounding or reverse causation (where adiposity influences inactivity, rather than vice versa) may explain part of the association [7,8]. Indeed, there may be a bidirectional relationship between adiposity and physical
activity, and this would imply that only a small change in adiposity or physical activity may be required to initiate a cycle of weight gain and increased inactivity [9].
There are few randomized trials examining the effectiveness of physical activity interventions for weight loss [10]. Those that exist report smaller, if any, effects on BMI [11–14] than predicted by observational associations. However, the efficacy of BMI as a measure of adiposity is subject to debate, and some improvements in other measures of fatness such as skinfold
thickness have been demonstrated in school-based physical activity interventions, without an accompanying reduction in BMI [14]. Nevertheless, the small effect seen in these trials suggests that reverse causation may in part have generated the association between physical activity and adiposity observed in cross-sectional studies. These findings, together with the quality of the trials—which has been limited by short trial duration, lack of assessment of trial adherence, or a limited difference in activity achieved between intervention and control groups [12]—call for further investigation and the use of genetic instruments as a better surrogate for adiposity.
To address the issue of reverse causation, prospective studies have measured activity and adiposity at multiple time points in children [7,15–22], although few studies have investigated bidirectional associations between activity and fatness in childhood and adolescence. Of those that have, one showed a lack of longitudinal association between physical activity and body composition [21], while three showed that whereas physical activity could not predict fatness, fatness was predictive of future physical inactivity [7,20,22]. Sample size
and poorly assessed activity have limited the ability to infer the causal direction of effects, even where longitudinal data are available.
Mendelian randomization (MR) can be used to assess whether adiposity causally affects activity levels [23]. MR is an approach that applies instrumental variable methods, using genetic variants as a proxy for environmentally modifiable exposures. This technique, which is analogous to a randomized trial where randomization to genotype takes place at conception, is not susceptible to reverse causation or confounding and so may be used to reassess observational associations and strengthen causal inference [23–26].
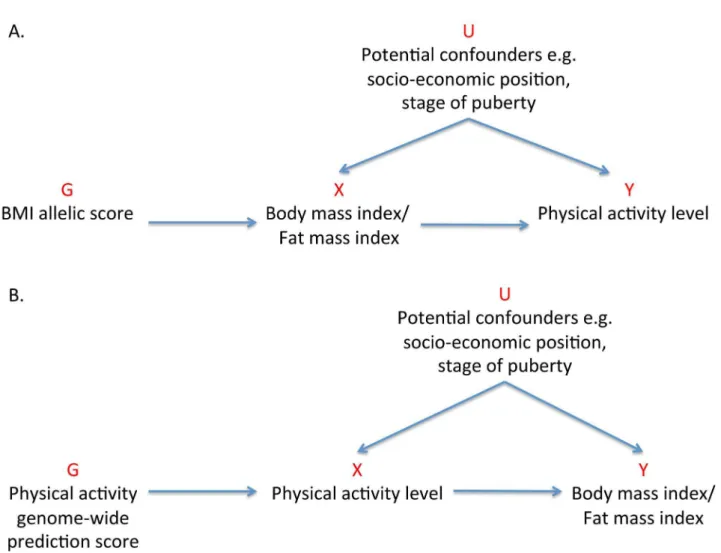
Previous MR studies investigating the effect of adiposity on various outcomes have used one or a few of the common genetic locus variants with the largest effect sizes to serve as instruments [27–32]. In this study, we aimed to use 32 independent genetic correlates of BMI, confirmed in a large-scale meta-analysis of genome-wide association studies (GWASs) [33], to elucidate the causality and magnitude of the effect of adiposity on activity levels in children (Figure 1A).
Figure 1. Addressing the causal directions of effect in the association between adiposity and physical activity with the use of allelic scores and Mendelian randomization analysis.(A) MR analysis to investigate the causal effect of adiposity on levels of physical activity with the use of a weighted allelic score as a genetic instrument. (B) Reciprocal MR analysis to investigate the causal effects of physical activity levels on adiposity using a genome-wide prediction score as a genetic instrument. G, genetic instrument; U, unobserved confounders; X, exposure; Y, outcome. doi:10.1371/journal.pmed.1001618.g001
BMI and Activity Mendelian Randomization Analysis
Methods
Study Sample
The Avon Longitudinal Study of Parents and Children (ALSPAC) is a prospective birth cohort that enrolled over 13,000 pregnant women in the former County of Avon, UK, with an expected delivery date between April 1991 and December 1992 [34,35]. Detailed information has been collected on these women and their offspring using self-administered questionnaires, research clinic examinations, data extraction from medical notes, and linkage to routine information systems. The study website contains details of all available data through a fully searchable data dictionary (http://www.bristol.ac.uk/alspac/researchers/ data-access/data-dictionary/). Ethical approval was obtained from the ALSPAC Law and Ethics Committee and local research ethics committees.
Exposure Variables
Body composition was measured at a clinic where the children’s average age was 11.7 y [1]. BMI, the primary exposure variable, was calculated as weight (in kilograms) divided by height (in meters) squared. BMI as a measure of adiposity has well-recognised limitations [36,37], and of particular concern for this analysis is that BMI does not distinguish between fat and lean mass, since lean mass correlates positively with levels of activity [2]. Therefore, phenotypic refinement was employed through the use of total body fat, assessed using a Lunar Prodigy dual energy X-ray absorptiometry scanner [1]. The fat mass index (FMI) was subsequently calculated as fat mass (in kilograms) divided by height (in meters) squared.
Outcome Variables
All children who attended the age 11-y clinic were asked to wear an MTI Actigraph AM7164 2.2 accelerometer for 7 d [38]. Only data from children who wore the Actigraph for at least 10 h/d for 3 d were included in this analysis. Movement counts were detected as a combined function of the frequency and intensity of movements. Activity was expressed as the total daily volume of physical activity averaged over the period of valid recording (counts/minute), and as time spent on moderate-to-vigorous-intensity physical activity (.3,600 counts/min) [39] and sedentary time (,199 counts/min) in minutes/day [40].
Genotyping
9,912 ALSPAC children were genotyped using the Illumina HumanHap550 quad genome-wide single nucleotide polymor-phism (SNP) genotyping platform by the Wellcome Trust Sanger Institute (Cambridge, UK) and the Laboratory Corporation of America (Burlington, North Carolina, US). Individuals with incorrect sex assignments, extreme heterozygosity (,0.320 and
.0.345 for Wellcome Trust Sanger Institute data and,0.310 and
.0.330 for Laboratory Corporation of America data), dispropor-tionate levels of individual missingness (.3%), evidence of cryptic relatedness (.10% identity by descent), or non-European ancestry were excluded. The resulting dataset consisted of 8,365 individ-uals. Of 609,203 SNPs, those with a minor allele frequency of,
1%, with a call rate of ,95%, or not in Hardy–Weinberg equilibrium (p,561027) were removed, leaving 500,527 SNPs that passed quality control. Established BMI variants that had not been genotyped directly were imputed with MACH 1.0.16 Markov Chain Haplotyping software [41,42] using CEPH individuals from HapMap phase 2 (release 22) as a reference set. From these genome-wide data, a weighted allelic score was created using 32 independent variants shown to be robustly
associated with BMI in a large-scale GWAS meta-analysis [33] (Table S1). The dose of the effect allele at each locus was weighted by the effect size of the variant in this independent meta-analysis [33], and these doses were summed to reflect the average number of BMI-increasing alleles carried by an individual. This weighted allelic score was created to act as an instrumental variable in MR analysis, and explained a greater proportion of variance in BMI than single SNPs [43]. The allelic score was also used as an instrument for FMI.
Statistical Methods
Means and standard deviations (SD) were calculated for continuous variables to describe baseline characteristics. The distribution of moderate-to-vigorous activity was skewed and was therefore log-transformed to achieve normality. All adiposity and activity values were converted to sex-specific SD (z) scores.
Observational associations between adiposity and activity measures were assessed using linear regression adjusted for age. Additional analyses were adjusted for potentially confounding factors that have been found to be independently associated with obesity [44], including maternal pre-pregnancy BMI, estimated gestational age at birth, infant birth weight, maternal education level, parental social class, maternal smoking during pregnancy, child’s stage of puberty at age 11 y, total daily dietary intake, and intake of main food groups.
For investigating associations between the allelic score and standardised phenotypes, continuous effects were estimated using linear regression with adjustment for age. An additive genetic model was assumed since there was no evidence for interaction effects among the SNPs combined in the allelic score [33]. MR analysis may generally forego the need for inclusion of other covariates, which are anticipated to be randomly distributed with respect to genotype [23]. Despite this, we examined associations between the confounding factors and genotypes to check the core instrumental variable assumption that the instrument (genotype) is independent of factors that potentially confound the observational association [25,26].
For MR analyses, we performed two-stage least squares using the weighted allelic score as an instrument for adiposity and implementing the ‘‘ivreg2’’ function in Stata.F-statistics from the first-stage regression between genotype and adiposity were examined to check the instrumental variable assumption that the instrument is sufficiently associated with the exposure, in order to reduce the possibility of weak instrument bias [45]. The Durbin-Wu-Hausman (DWH) test for endogeneity [46] was used to compare effect estimates from the second stage of the instrumental variable analysis and observational analysis. Stata 12 (StataCorp) was used for all analyses.
Sensitivity Analyses
Multiple independent instruments. The existence of pleiotropy, where a genetic instrument has an effect on an outcome (activity) independent of its effect on the exposure (adiposity), would have implications for assumptions made in MR analyses [47]. Similar instrumental variable estimates acquired using independent instruments would provide suggestive evidence against an influence of pleiotropic effects, as it is unlikely that they have shared pleiotropy [43,48]. The two independent genetic instruments generated were rs1558902 inFTO, the individual SNP with the largest effect size in the meta-analysis of GWASs for BMI [33], and a weighted allelic score constructed from the remaining 31 BMI-associated SNPs.
Genome-wide prediction for physical activity. An ex-ploratory MR analysis investigating the association between BMI and Activity Mendelian Randomization Analysis
adiposity and activity levels may provide evidence for causality in this direction. However, it does not exclude the possibility that physical activity has a causal effect on adiposity levels. A genetic instrument for activity is required to test the relationship in a bidirectional manner (Figure 1B) [31,32]. No meta-analysis of GWASs has so far been reported for physical activity, and no genetic variants have been robustly associated with activity to date [49,50]. Genome-wide prediction scores, which examine the aggregated contribution of genome-wide variation in a trait, have the potential to recover some of the information lost by dismissing false-negative results in GWASs [51–55] and may be used as instruments in MR analysis.
Before the generation of a genetic instrument for physical activity, the heritability of activity in ALSPAC was assessed to consider the plausibility of a genetic contribution to activity. GCTA (Genome-wide Complex Trait Analysis) (version 1.04) [56] was used to estimate the total amount of variance captured by all 500,527 SNPs in the genotypic data for the activity measures. The approach first involves the estimation of a genetic relationship matrix for individuals based on autosomal genotype information, with a further cryptic relatedness cutoff of 2.5% applied to reduce the potential for biased estimates. The variance of each activity trait attributable to all SNPs was estimated using restricted maximum likelihood. Given evidence of a heritable contribution to observed variance in activity measures (Table S2), genome-wide prediction scores were generated for total physical activity, moderate-to-vigorous activity, and sedentary time. Individuals in the complete sample were randomized into two subgroups. Using activity and genotypic data from the first subgroup (n= 2,148), genetic variants yielding a p-value#0.1 in a GWAS for each activity variable were extracted, and prediction scores were constructed using profile scoring and the ‘‘–score’’ command within PLINK (version 1.07) [57]. The prediction score is a sum across SNPs of the number of reference alleles multiplied by the weight for that SNP, which is its effect size in the GWAS with activity.
We used split sample analysis, where the physical activity prediction scores from the first subgroup (composed of one half of the sample) were applied to individuals in the second independent subgroup (composed of the other half of the sample) and used in two-stage least squares instrumental variable analysis to assess a causal effect of activity on adiposity. This method was repeated with prediction scores generated from data in the second subgroup and applied to instrumental variable analysis in the first [58]. The results of these two instrumental variable analyses were meta-analysed using the inverse variance-weighted method with a fixed-effects model. A test for heterogeneity [59] was performed to investigate similarity between instrumented effects in the two independent subgroups.
We performed all of the above analyses stratified by sex because a sex interaction for the associations between adiposity and activity levels has been shown previously [1] (Tables S11, S12, S13).
Results
Of the 11,952 children who were invited to attend the research clinic, 7,159 (59.9%) came to the clinic. 6,622 of the 7,159 (92.5%) agreed to wear an Actigraph accelerometer, and 5,595 of the 6,622 (84.5%) returned Actigraph accelerometer data that satisfied the validity criteria. Of the 5,595, BMI and genotypic data were available for 4,296 children (76.8%). FMI estimates were available for 4,244 children (75.8%) (Figure 2).
Of the individuals included in this analysis, 22.1% (950/4,296) were defined as being overweight and 4.2% (181/4,296) as obese,
according to age- and sex-specific cutoffs proposed by the International Obesity Task Force [60]. A comparison of the baseline characteristics of individuals who did and did not attend the age 11-y clinic has been described in detail elsewhere [1]. Differences in baseline characteristics between the subset of children included in this analysis and those who did not attend the age 11-y clinic are shown in Table S3. The children included in this analysis were more likely to be girls and had a higher birth weight, higher gestational age at birth, higher social class, higher dietary intake at age 10 y and mothers who were less likely to be smokers and were more highly educated.
Observational Analysis
From observational analysis of baseline characteristics, objec-tively assessed activity levels were higher for boys than girls for total physical activity (664.6 versus 555.1 mean movement counts/ min,p,0.001) and for moderate-to-vigorous activity (25.8 versus 16.0 median min/d,p,0.001). Sedentary time was higher for girls than for boys (435.6 versus 418.2 mean min/d,p,0.001), as were mean values of BMI (19.1 versus 18.7 kg/m2, p,0.001) and fat mass (12.7 versus 10.2 kg,p,0.001) (Table 1). BMI and FMI were strongly correlated (Pearson’s correlation coefficient = 0.94).
A 3.3 kg/m2(1 SD) higher BMI was associated with 22.3 (95% CI, 17.0, 27.6) counts/min less total physical activity (p= 1.6610216
), 2.6 (2.1, 3.1) min/d less moderate-to-vigorous activity (p= 3.7610229
), and 3.5 (1.5, 5.5) min/d more sedentary time (p= 5.061024). These associations were stronger when using FMI instead of BMI and were largely unaltered by adjusting for additional confounders (Table 2). In observational analyses stratified by sex, effect estimates were larger in boys for all activity phenotypes (Table S11).
Direct Genotypic Associations
The BMI allelic score was normally distributed, with a mean of 29.6, SD of 3.9, and range of 16.3–42.3 (Figure S1). A per (average BMI-increasing) allele change in the allelic score was associated with a 0.14 (95% CI, 0.12, 0.17) kg/m2 increase in BMI (p= 5.5610229), and a 0.11 (0.09, 0.13) kg/m2increase in FMI (p= 2.3610225) (Table 3). The BMI allelic score explained 2.8% of the variance in standardised BMI in this cohort, and 2.5% of the variance in FMI.
In contrast to BMI and FMI, confounding factors were not associated with the genotypes in this cohort (Table S4). Although the allelic score showed some weak associations with reported dietary intake and certain food groups and macronutrients (Table S5), these associations are largely driven by the inclusion ofFTOin the score. As dietary intake is a known mediator in the association between FTO and adiposity [61], adjustment in instrumental variable analysis would not be appropriate.
A per allele change in the BMI allelic score was associated with a decrease of 1.4 (95% CI, 0.0, 2.8) counts/min of total physical activity (p= 0.05), an approximate decrease of 0.1 (0.0, 0.2) min/d of moderate-to-vigorous activity (p= 0.05), and an increase of 0.6 (0.1, 1.1) min/d of sedentary time (p= 0.03) (Table 3).
Mendelian Randomization
Instrumental variable analysis using the BMI allelic score showed that a 3.3 kg/m2 higher BMI was associated with 32.4 (95% CI, 0.9, 63.9) counts/min less total physical activity (p= 0.04) (equivalent to 5.3% of the mean counts/min), 2.8 (0.1, 5.5) min/d less moderate-to-vigorous activity (p= 0.04), and 13.2 (1.3, 25.2) min/d more sedentary time (p= 0.03) (F-statistic = 124.9; partial R2= 0.03).
BMI and Activity Mendelian Randomization Analysis
There was no evidence of a departure of instrumental-variable-derived estimates from observational results, as demonstrated by DWH tests (p$0.10), indicating similarity between observational and MR estimates in the effect of BMI on physical activity levels. Furthermore, point estimates for effect sizes from the instrumental variable analysis were equal to or greater than those derived from basic observational analyses for all traits, though wider confidence intervals for the instrumental variable estimates resulted in larger pvalues.
Similar results were found when FMI was instrumented (Table 4). In addition, similar results were found when using physical activity and adiposity data for individuals at age 13 y, though the number of individuals at this time point was smaller (Table S6). In sensitivity analyses stratified by sex, wide confidence intervals for instrumental variable estimates did not allow the resolution of differences between boys and girls (Table S11).
Multiple Independent Instruments
An analysis of the alleles included in the BMI allelic score showed that rs1558902 (FTO) was the variant contributing most to its association with BMI (Figure 3). Results of instrumental variable analysis using this genetic variant were compared with those of a weighted allelic score consisting of the 31 genetic variants excludingFTO(Tables 5 and 6). The instrumented effect
for FTO showed some difference to observational estimates, especially for sedentary time, where the instrumental variable analysis produced larger effect estimates than the observational analysis (p= 0.01 for DWH test). However, there was no strong statistical evidence that the instrumented effects of BMI on activity levels were different from one another (pfor heterogeneity
$0.06). An additional analysis was run that showed that independent pairs of variants from the 32 SNPs have normally distributed instrumental variable effects. Although pairs of variants includingFTO lie at the lower end of this distribution, indicating that variation inFTOproduces a larger-than-average effect in the instrumental variable analysis, this effect is not an outlier (Figure S2). Similar results were found when FMI was instrumented.
Genome-Wide Prediction for Physical Activity
The additive heritability of activity measures was estimated to be 17%–25% (Table S2), indicating a non-negligible contribution of genetic variation to variance in physical activity levels. Genome-wide prediction scores were generated for each of the activity measures and applied in instrumental variable analysis to independent subgroups. Physical activity scores were normally distributed and showed some association with their respective activity measures in the other subgroups (Table S7). The physical Figure 2. Participants in ALSPAC and in the analyses presented in this paper.DXA, dual energy X-ray absorptiometry.
doi:10.1371/journal.pmed.1001618.g002
BMI and Activity Mendelian Randomization Analysis
activity scores had no substantive correlation with the BMI allelic score (Table S8), providing evidence that the instruments for adiposity and physical activity were independent of each other.
There was no strong statistical evidence that the instrumented effects of activity on adiposity in the subgroups were different from
each other (pfor heterogeneity$0.11). A meta-analysis of both instrumental variable analyses, unlike observational analysis, found no strong evidence for a causal effect of physical activity on BMI at age 11 y (regression coefficient 0.27 [95% CI, 20.41, 0.94], p= 0.44, for total physical activity;20.03 [20.72, 0.66],p= 0.93, Table 1.Baseline characteristics of children.
Variable All (n= 4,296) Boys (n= 2,044) Girls (n= 2,252)
Mean or Percent SD Mean or Percent SD Mean or Percent SD
Age (mo) 140.8 2.8 140.8 2.8 140.8 2.7
Height (cm) 150.7 7.2 150.0 7.1 151.3 7.2
Weight (kg) 43.3 9.7 42.4 9.5 44.2 9.8
BMI (kg/m2) 18.9 3.3 18.7 3.2 19.1 3.4
Fat mass (kg) measured by DXA 11.5 6.5 10.2 6.4 12.7 6.4
FMI (kg/m2) 5.0 2.7 4.5 2.6 5.5 2.6
Body fat percentage (fat mass [kg]/weight [kg])
25.4 9.1 22.5 9.2 27.3 8.4
Total physical activity (counts/min) 607.2 178.4 664.6 187.9 555.1 151.7
Moderate-to-vigorous-intensity physical
activity (min/d)a 20.0 12.0–31.4 25.8 15.9–38.5 16.0 9.9–24.9
Sedentary time (min/d) 427.3 66.6 418.2 68.5 435.6 63.7
Birth weight (g) 3,433.8 526.7 3,483.5 568.3 3,388.3 481.2
Gestational age at birth (wk) 39.5 1.8 39.4 1.9 39.6 1.6
Maternal BMI (kg/m2) 22.9 3.7 23.0 3.7 22.9 3.7
Total daily dietary intake (kcal/d) 1,862.0 377.3 1,953.5 389.8 1,778.3 344.9
Maternal smoking during pregnancy
No 80.1% 80.1% 80.1%
Yes 19.9% 19.9% 19.9%
Maternal education
Education up to age 16 y with certificate of secondary education or vocational training
20.0% 21.0% 19.1%
Education up to age 16 y with general certificate of education (Ordinary level)
35.1% 34.4% 35.8%
Education up to age 18 y with general certificate of education (Advanced level)
27.2% 26.8% 27.5%
University degree 17.7% 17.8% 17.6%
Parental social classb
I Professional occupations 16.3% 16.5% 16.2%
II Managerial and technical occupations 45.9% 45.5% 46.3%
III(NM) Skilled non-manual occupations 24.4% 24.8% 24.0%
III(M) Skilled manual occupations 9.6% 9.9% 9.4%
IV Partly skilled occupations 3.3% 2.9% 3.6%
V Unskilled occupations 0.5% 0.5% 0.5%
Stage of pubertyc
Stage 1 47.7% 66.7% 33.2%
Stage 2 35.0% 28.8% 39.8%
Stage 3 13.7% 4.2% 21.0%
Stage 4 3.1% 0.4% 5.2%
Stage 5 0.5% 0% 0.8%
Total sample sizes range from 3,121 to 4,098 depending on the availability of the data.
aMedian and interquartile ranges are displayed for this variable because it is skewed.
bBased on parent with highest social class, as defined by the 1991 British Office of Population Censuses and Surveys classification. cBased on highest Tanner scale developmental stage of breasts and pubic hair for females and pubic hair for males.
DXA, dual energy X-ray absorptiometry. doi:10.1371/journal.pmed.1001618.t001
BMI and Activity Mendelian Randomization Analysis
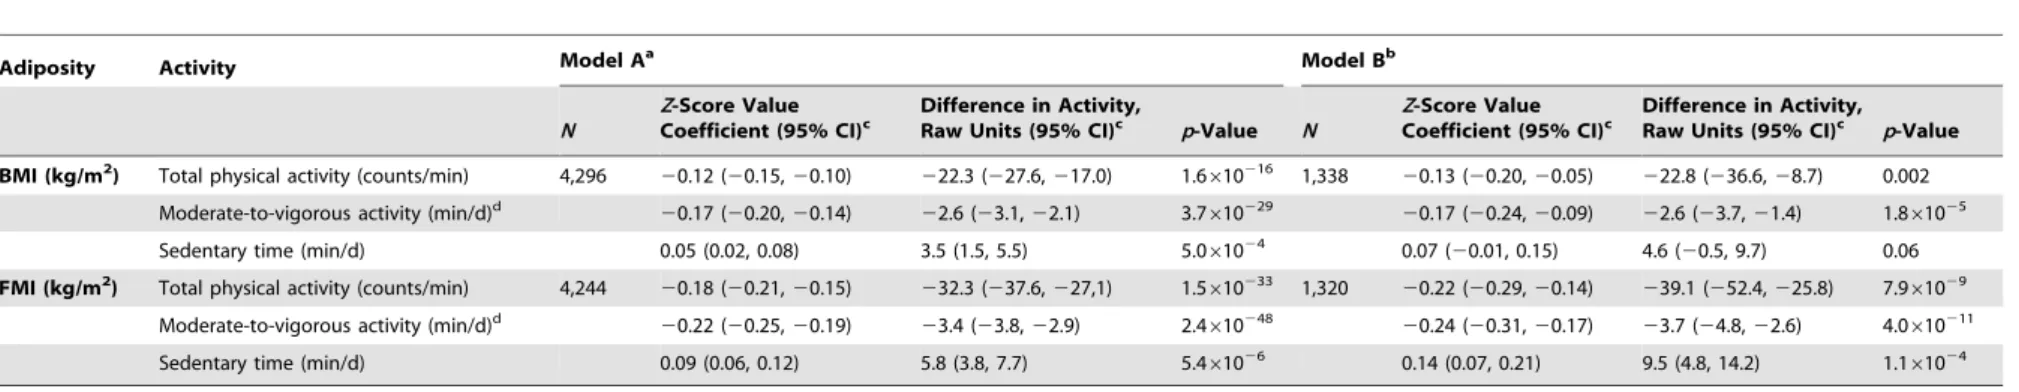
Table 2.Associations between measures of adiposity and physical activity levels.
Adiposity Activity Model Aa Model Bb
N
Z-Score Value Coefficient (95% CI)c
Difference in Activity,
Raw Units (95% CI)c p-Value N
Z-Score Value Coefficient (95% CI)c
Difference in Activity, Raw Units (95% CI)c p-Value
BMI (kg/m2) Total physical activity (counts/min) 4,296
20.12 (20.15,20.10) 222.3 (227.6,217.0) 1.6610216 1,338 20.13 (20.20,20.05) 222.8 (236.6,28.7) 0.002 Moderate-to-vigorous activity (min/d)d 20.17 (20.20,20.14) 22.6 (23.1,22.1) 3.7
610229 20.17 (20.24,20.09) 22.6 (23.7,21.4) 1.8
61025
Sedentary time (min/d) 0.05 (0.02, 0.08) 3.5 (1.5, 5.5) 5.061024 0.07 (20.01, 0.15) 4.6 (20.5, 9.7) 0.06
FMI (kg/m2) Total physical activity (counts/min) 4,244 20.18 (20.21,20.15) 232.3 (237.6,227,1) 1.5
610233 1,320 20.22 (20.29,20.14) 239.1 (252.4,225.8) 7.961029 Moderate-to-vigorous activity (min/d)d 20.22 (20.25,20.19) 23.4 (23.8,22.9) 2.4
610248 20.24 (20.31,20.17) 23.7 (24.8,22.6) 4.0
610211
Sedentary time (min/d) 0.09 (0.06, 0.12) 5.8 (3.8, 7.7) 5.461026 0.14 (0.07, 0.21) 9.5 (4.8, 14.2) 1.161024
aModel A: adjusted for age.
bModel B: adjusted for age, birth weight, gestational age at birth, maternal smoking during pregnancy, maternal education, parental social class, maternal BMI, stage of puberty, total daily dietary intake, and intake of main food
groups.
cCoefficients are displayed as sex-specificz-scores for both measures of adiposity and activity levels and have also been rescaled to give more meaningful outcomes relating to the raw units of these variables. The raw-unit
difference was computed by multiplying thez-score value by the SD of the variable, taken from Table 1.
dModerate-to-vigorous activity was log transformed for analysis.
doi:10.1371/journal.pmed.1001618.t002
Table 3.Associations between the weighted allelic score for 32 SNPs and body mass index/fat mass index and activity measures.
Outcome Per Allele Effects Per Allele Effects (Adjusted for Activitya)
N
Z-Score Value Coefficient (95% CI)b
Difference in Adiposity or Activity,
Raw Units (95% CI)b p-Value
Z-Score Value Coefficient (95% CI)b
Difference in Adiposity or Activity, Raw Units
(95% CI)b p-Value
BMI (kg/m2) 4,296 0.04 (0.04, 0.05) 0.14 (0.12, 0.17) 5.5
610229 0.04 (0.03, 0.05) 0.14 (0.11, 0.16) 4.2610228
FMI (kg/m2) 4,244 0.04 (0.03, 0.05) 0.11 (0.09, 0.13) 2.3
610225 0.04 (0.03, 0.05) 0.10 (0.08, 0.12) 2.3610224 Total physical activity
(counts/min)
4,296 20.01 (0.00,20.02) 21.4 (22.8,20.03) 0.05
Moderate-to-vigorous activity (min/d)c
4,296 20.01 (20.02, 0.00) 20.12 (20.24,20.00) 0.05
Sedentary time (min/d) 4,296 0.01 (0.00, 0.02) 0.57 (0.06, 1.1) 0.03
Regression results were adjusted for age. Per (average BMI-increasing) allele effects were obtained by linear regression for all of these continuous outcome variables.
aActivity variables were total physical activity, moderate-to-vigorous and minutes of sedentary time.
bCoefficients are displayed as sex-specificz-scores for both measures of adiposity and activity levels and have also been rescaled to give more meaningful outcomes relating to the raw units of these variables. The raw-unit
difference was computed by multiplying thez-score value by the SD of the variable, taken from Table 1.
cModerate-to-vigorous activity was log transformed for analysis.
doi:10.1371/journal.pmed.1001618.t003
BMI
and
Activity
Mendelian
Randomiz
ation
Analysis
PLOS
Medicine
|
www.plosm
edicine.org
7
March
2014
|
Volume
11
|
Issue
3
|
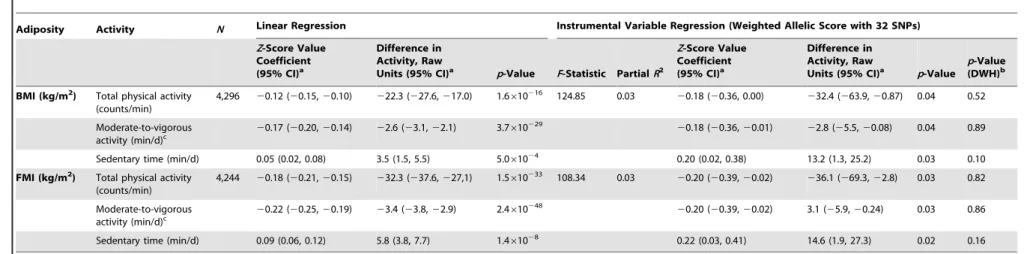
Table 4.Associations between body mass index/fat mass index and activity levels as tested both by conventional epidemiological approaches and through the application of instrumental variable analysis using a 32-SNP weighted allelic score as an instrument.
Adiposity Activity N Linear Regression Instrumental Variable Regression (Weighted Allelic Score with 32 SNPs)
Z-Score Value Coefficient (95% CI)a
Difference in Activity, Raw
Units (95% CI)a p-Value F-Statistic PartialR2
Z-Score Value Coefficient (95% CI)a
Difference in Activity, Raw
Units (95% CI)a p-Value
p-Value (DWH)b
BMI (kg/m2) Total physical activity
(counts/min)
4,296 20.12 (20.15,20.10) 222.3 (227.6,217.0) 1.6610216 124.85 0.03 20.18 (20.36, 0.00) 232.4 (263.9,20.87) 0.04 0.52
Moderate-to-vigorous activity (min/d)c
20.17 (20.20,20.14) 22.6 (23.1,22.1) 3.7610229 20.18 (20.36,20.01) 22.8 (25.5,20.08) 0.04 0.89
Sedentary time (min/d) 0.05 (0.02, 0.08) 3.5 (1.5, 5.5) 5.061024 0.20 (0.02, 0.38) 13.2 (1.3, 25.2) 0.03 0.10
FMI (kg/m2) Total physical activity
(counts/min)
4,244 20.18 (20.21,20.15) 232.3 (237.6,227,1) 1.5610233 108.34 0.03 20.20 (20.39,20.02) 236.1 (269.3,22.8) 0.03 0.82
Moderate-to-vigorous
activity (min/d)c 2
0.22 (20.25,20.19) 23.4 (23.8,22.9) 2.4610248 20.20 (20.39,20.02) 3.1 (25.9,20.24) 0.03 0.86
Sedentary time (min/d) 0.09 (0.06, 0.12) 5.8 (3.8, 7.7) 1.461028 0.22 (0.03, 0.41) 14.6 (1.9, 27.3) 0.02 0.16
Regression results were adjusted for age.
aCoefficients are displayed as sex-specific
z-scores for both measures of adiposity and activity levels and have also been rescaled to give more meaningful outcomes relating to the raw units of these variables. The raw-unit difference was computed by multiplying thez-score value by the SD of the variable, taken from Table 1.
bp(DWH) is thep-value of the Durbin form of the DWH test, which examines the difference between the estimates from linear regression and instrumental variable analysis. cModerate-to-vigorous activity was log transformed for analysis.
doi:10.1371/journal.pmed.1001618.t004
BMI
and
Activity
Mendelian
Randomiz
ation
Analysis
PLOS
Medicine
|
www.plosm
edicine.org
8
March
2014
|
Volume
11
|
Issue
3
|
for moderate-to-vigorous activity;20.51 [21.24, 0.22], p= 0.17, for sedentary time, withz-standardised units of BMI and activity measures) (Table S9). Results were similar when FMI was the outcome (Table S10). However, confidence intervals were wide, and small F-statistics indicated that caution should be applied when using these instruments for physical activity (F#6.80).
Discussion
This study used a MR approach to investigate a causal role for elevated BMI and FMI in lower physical activity levels in children. In agreement with previous findings that adiposity loci identified by GWASs in adults are associated with childhood anthropometric traits [62,63], the allelic score derived from established genetic variants for BMI was strongly associated with both exposures of interest (BMI and FMI). The allelic score explained a larger proportion of the variation in BMI compared with FMI. Nonetheless, theF-statistic for the association between the allelic score and FMI was large (.100), supporting previous findings for consistent associations between the 32 BMI-associated loci and other measures of adiposity [64].
The similarity between observational and instrumental variable estimates for the association between BMI and physical activity provides evidence suggesting that increasing adiposity leads to a causal reduction in total and moderate-to-vigorous physical
activity, and a causal increase in the length of sedentary time. Associations from instrumental variable analysis were marginally stronger between FMI and activity levels, as expected given that BMI does not differentiate between fat and lean mass, and lean mass correlates positively with levels of activity. These results are in line with findings from recent prospective studies that show that fatness is predictive of reduced physical activity at later time points [7,20,22].
The finding that the calculated effect sizes in this MR analysis account for a substantial proportion of the association between adiposity and activity identified in observational studies [1–6] has important public health implications. Whilst the mechanisms of this pathway are unclear and may constitute both physiological and psychological factors [65,66], evidence that adiposity is a causal risk factor for low physical activity is important, since it has been recommended that children spend at least 60 min in moderate-to-vigorous-intensity physical activity each day in order to maintain their physical health [67–73]. In particular, this evidence highlights the importance of developing programmes targeting body weight in order to increase physical activity levels in overweight children [74].
A limitation of the study was that we were not able to collect physical activity, body composition, or genetic data on a substantial number of children originally enrolled in the study. These missing data can lead to a bias if the causal effect of Figure 3. Strength of individual genetic variants for BMI as genetic instruments in instrumental variable analysis.F-statistic derived from first-stage regression in two-stage least squares analysis where each of the 32 alleles was used as an individual instrument for BMI. doi:10.1371/journal.pmed.1001618.g003
BMI and Activity Mendelian Randomization Analysis
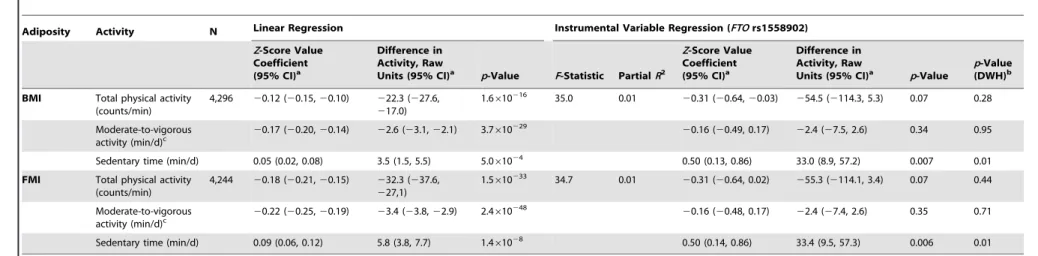
Table 5.Associations between body mass index/fat mass index and activity levels as tested both by conventional epidemiological approaches and through the application of instrumental variable analysis using theFTO(rs1558902) genetic variant as an instrument.
Adiposity Activity N Linear Regression Instrumental Variable Regression (FTOrs1558902)
Z-Score Value Coefficient (95% CI)a
Difference in Activity, Raw
Units (95% CI)a p-Value F-Statistic PartialR2
Z-Score Value Coefficient (95% CI)a
Difference in Activity, Raw
Units (95% CI)a p-Value
p-Value (DWH)b
BMI Total physical activity (counts/min)
4,296 20.12 (20.15,20.10) 222.3 (227.6, 217.0)
1.6610216 35.0 0.01 20.31 (20.64,20.03) 254.5 (2114.3, 5.3) 0.07 0.28
Moderate-to-vigorous activity (min/d)c
20.17 (20.20,20.14) 22.6 (23.1,22.1) 3.7610229 20.16 (20.49, 0.17) 22.4 (27.5, 2.6) 0.34 0.95
Sedentary time (min/d) 0.05 (0.02, 0.08) 3.5 (1.5, 5.5) 5.061024 0.50 (0.13, 0.86) 33.0 (8.9, 57.2) 0.007 0.01
FMI Total physical activity (counts/min)
4,244 20.18 (20.21,20.15) 232.3 (237.6, 227,1)
1.5610233 34.7 0.01 20.31 (20.64, 0.02) 255.3 (2114.1, 3.4) 0.07 0.44
Moderate-to-vigorous
activity (min/d)c 2
0.22 (20.25,20.19) 23.4 (23.8,22.9) 2.4610248 20.16 (20.48, 0.17) 22.4 (27.4, 2.6) 0.35 0.71
Sedentary time (min/d) 0.09 (0.06, 0.12) 5.8 (3.8, 7.7) 1.461028 0.50 (0.14, 0.86) 33.4 (9.5, 57.3) 0.006 0.01
Regression results were adjusted for age.
aCoefficients are displayed as sex-specific
z-scores for both measures of adiposity and activity levels and have also been rescaled to give more meaningful outcomes relating to the raw units of these variables. The raw-unit difference was computed by multiplying thez-score value by the SD of the variable, taken from Table 1.
bp(DWH) is thep-value of the Durbin form of the DWH test, which examines the difference between the estimates from linear regression and instrumental variable analysis. cModerate-to-vigorous activity was log transformed for analysis.
doi:10.1371/journal.pmed.1001618.t005
BMI
and
Activity
Mendelian
Randomiz
ation
Analysis
PLOS
Medicine
|
www.plosm
edicine.org
10
March
2014
|
Volume
11
|
Issue
3
|
Table 6.Associations between body mass index/fat mass index and activity levels as tested both by conventional epidemiological approaches and through the application of instrumental variable analysis using a 31-SNP weighted allelic score (excludingFTO) as an instrument.
Adiposity Activity N Linear Regression Instrumental Variable Regression (Weighted Allelic Score with 31 SNPs)
Z-Score Value Coefficient (95% CI)a
Difference in Activity,
Raw Units (95% CI)a p-Value F-Statistic PartialR2
Z-Score Value Coefficient (95% CI)a
Difference in Activity, Raw Units (95% CI)a p-Value
p-Value (DWH)b
BMI Total physical activity (counts/min)
4,296 20.12 (20.15,20.10) 222.3 (227.6,217.0) 1.6610216 88.9 0.02 20.13 (20.34, 0.07) 224.0 (261.2, 13.1) 0.21 0.92
Moderate-to-vigorous activity (min/d)c
20.17 (20.20,20.14) 22.6 (23.1,22.1) 3.7610229 20.19 (20.40, 0.02) 22.9 (26.1, 0.3) 0.07 0.85
Sedentary time (min/d) 0.05 (0.02, 0.08) 3.5 (1.5, 5.5) 5.061024 0.09 (20.12, 0.30) 5.8 (28.2, 19.7) 0.42 0.75
FMI Total physical activity (counts/min)
4,244 20.18 (20.21,20.15) 232.3 (237.6,227,1) 1.5610233 73.3 0.02 20.16 (20.38, 0.07) 228.1 (268.4, 12.2) 0.17 0.84
Moderate-to-vigorous
activity (min/d)c 2
0.22 (20.25,20.19) 23.4 (23.8,22.9) 2.4610248 20.22 (20.44, 0.01) 23.4 (26.8, 0.8) 0.06 0.99
Sedentary time (min/d) 0.09 (0.06, 0.12) 5.8 (3.8, 7.7) 1.461028 0.10 (20.13, 0.33) 6.8 (28.4, 22.1) 0.38 0.89
Regression results were adjusted for age.
aCoefficients are displayed as sex-specific
z-scores for both measures of adiposity and activity levels and have been rescaled to give more meaningful outcomes relating to the raw units of these variables. The raw-unit difference was computed by multiplying thez-score value by the SD of the variable, taken from Table 1.
bp(DWH) is thep-value of the Durbin form of the DWH test, which examines the difference between the estimates from linear regression and instrumental variable analysis. cModerate-to-vigorous activity was log transformed for analysis.
doi:10.1371/journal.pmed.1001618.t006
BMI
and
Activity
Mendelian
Randomiz
ation
Analysis
PLOS
Medicine
|
www.plosm
edicine.org
11
March
2014
|
Volume
11
|
Issue
3
|
adiposity on physical activity (and vice versa) is different in the children who did not take part. Whilst we cannot fully exclude such a bias, associations were not altered by adjustment for factors associated with missing data [1]. Possible limitations to the MR analysis in general include the possibility of population stratifica-tion, canalizastratifica-tion, power deficiency, pleiotropy, and linkage disequilibrium [23,47]. Major population stratification is unlikely since this analysis was completed in unrelated individuals of European ancestry. A pleiotropic association of a genetic variant included in the allelic score with the outcome, or linkage disequilibrium with a functional variant associated with the outcome, would violate the assumptions of MR analysis. Multiple independent instruments were used to provide evidence against the existence of shared pleiotropy and against the influence of linkage-disequilibrium-induced confounding [48]. Whereas instru-mental variable estimates for the association between adiposity and physical activity obtained using the 31-SNP allelic score (excluding FTO) were consistently similar to observational effect sizes, the estimates produced using the FTO variant as an instrument were generally larger than observational findings. However, there was no strong statistical evidence for a difference between the instrumented estimates, arguing against a pleiotropic effect. It should be emphasised that this investigation does not provide definitive evidence against the existence or impact of pleiotropy, and more functional knowledge of the variants is required to assess this more comprehensively.
With evidence for causality in the direction from adiposity to activity levels, further analyses were undertaken to address the reciprocal association between physical activity and levels of adiposity in children at age 11 y. The absence of a causal effect of physical activity on adiposity goes some way towards explaining the lack of impact of short-term physical activity intervention trials on adiposity levels in children [11–13]. It is also in line with the fact that there is little evidence that there has been a major decline in physical activity during the course of the obesity epidemic [75], compared with stronger evidence that there has been an increase in energy intake in the same time period [76]. Although no causal effect was shown in our preliminary analysis, this analysis is likely to suffer from limitations of small sample sizes and inadequacy of the prediction scores for physical activity in terms of the association between genotype and physical activity [77–79], genetic confounding, or pleiotropy. In addition, split sample instrumental variable methods have been shown to generate estimates that are biased towards the null [58]. Before we can confirm or refute a complete lack of effect of activity levels on adiposity using MR analysis, a well-powered study with strong genetic instruments for physical activity variables is required. Therefore, findings from this secondary analysis do not exclude lower physical activity also leading to increases in adiposity and a ‘‘vicious cycle’’ being initiated [9].
Results of our main analysis suggest that increased adiposity leads to a reduction in physical activity. Although further work is required to determine a more accurate estimate of the causal effect in the reverse direction, this study provides insight into the causal contributions of adiposity to activity levels in children and supports research into the targeting of BMI in efforts to increase childhood activity levels.
Supporting Information
Figure S1 Distribution of the BMI allelic score in this study population.
(TIF)
Figure S2 Distribution ofz-statistics for pair
combina-tions of the 32 SNPs in instrumental variable regres-sions.Blue indicates the distribution of z-statistics for all pair combinations of the 32 SNPs; red indicates the distribution ofz -statistics for combinations of the 32 SNPs where one SNP was the FTO(rs1558902) variant. Median coefficient using pair combina-tions of the 32 SNPs in instrumental variable regression =20.13 SD counts/min per 1-SD increase in BMI. Coefficient using 32-SNP score in instrumental variable regression =20.18 SD counts/ min per 1-SD increase in BMI. Coefficient from observational regression =20.12 SD counts/min per 1-SD increase in BMI. (TIF)
Table S1 Independent genetic variants from a meta-analysis of GWASs for BMI included in weighted allelic score. *[33].6this value ranges from 0 to 1 and indicates the squared correlation between imputed and true genotypes. $SD change in sex- and age-specific BMI per allele increase.
(DOCX)
Table S2 GCTA analysis—physical activity trait vari-ance explained by SNPs.h2, additive heritability, or variance explained by all 500,527 SNPs in the genotypic data for physical activity measures in children, estimated using a restricted maximum likelihood method.p-Value is for a test that the additive heritability calculated is non-zero. *Moderate-to-vigorous physical activity was log transformed for analysis.
(DOCX)
Table S3 Comparison of baseline characteristics be-tween children included in this analysis compared with individuals who did not attend the age 11-y research clinic.*Total sample size varies depending on the availability of the data.aBased on partner with highest social class. bBased on highest Tanner scale developmental stage of breasts and pubic hair for females and pubic hair for males.$Data on individuals in core ALSPAC cohort originally recruited and children later enrolled.
(DOCX)
Table S4 Associations between body mass index, fat mass index, and genotypes and possible confounding factors.Coef, beta coefficient; OR, odds ratio. Per SD effects were obtained for the confounding variables by linear regression with BMI/FMI. Per allele effects were obtained by linear regression with the allelic scores and FTO genotype. Maternal smoking during pregnancy was the only binary outcome variable, and so logistic regression was used to obtain odds ratios for the per SD effects of BMI/FMI and the per allele effects of allelic scores andFTOgenotype. Effects were adjusted for age, and also for BMI in regressions involving genotype. *Sample size varies from 3,121 to 4,098 depending on completeness of data on confounding factors.
(DOCX)
Table S5 Associations between body mass index, fat mass index, and genotypes and components of dietary intake.Coef, beta coefficient; OR, odds ratio. Per SD effect sizes were obtained for the confounding variables by linear regression with BMI/FMI. Per allele effects were obtained by linear regression with the allelic scores andFTOgenotype. Effects were adjusted for age, and also for BMI in regressions involving genotype. *Sample size varies from 2,103 to 3,991 depending on completeness of data on confounding factors.6Excluding dietary under-reporters.
(DOCX)
BMI and Activity Mendelian Randomization Analysis
Table S6 Associations between body mass index/fat mass index and activity levels as tested both by conventional epidemiological approaches and through the application of instrumental variable analysis using a 32-SNP weighted allelic score as an instrument at age 13 y. Regression results were adjusted for age. Coefficients are displayed as sex-specific z-scores for both measures of adiposity and activity levels. P(DWH) is thep-value of the Durbin form of the DWH test, which examines the difference between the estimates from linear regression and instrumental variable analysis. *Moderate-to-vigorous activity was log transformed for analysis. (DOCX)
Table S7 Associations between genome-wide prediction scores and activity measures in independent subgroups.
Regression results were adjusted for age. Per allele effects were obtained by linear regression for all of these continuous variables. Coefficients are based onz-scores for activity levels. *Moderate-to-vigorous activity was log transformed for analysis.
(DOCX)
Table S8 Correlations between genome-wide prediction scores and the BMI allelic score.Pearson product-moment correlation coefficients calculated.
(DOCX)
Table S9 Associations between activity levels and body mass index as tested both by conventional epidemiolog-ical approaches and through the application of instru-mental variable analysis using genome-wide prediction scores for activity levels: meta-analysis for two sets of prediction scores. Regression results were adjusted for age. Coefficients are based onz-scores for activity and adiposity levels. P(DWH) is thep-value of the Durbin form of the DWH test, which examines the difference between the estimates from linear regression and instrumental variable analysis. *Moderate-to-vigorous activity was log transformed for analysis. $Physical activity prediction scores were generated in one subgroup and applied to individuals in a second independent subgroup for instrumental variable analysis.
(DOCX)
Table S10 Associations between activity levels and fat mass index as tested both by conventional epidemiolog-ical approaches and through the application of instru-mental variable analysis using genome-wide prediction scores for activity levels: meta-analysis for two sets of prediction scores. Regression results were adjusted for age. Coefficients are based onz-scores for activity and adiposity levels. P(DWH) is thep-value of the Durbin form of the DWH test, which examines the difference between the estimates from linear regression and instrumental variable analysis. *Moderate-to-vigorous activity was log transformed for analysis.$Physical activity prediction scores were generated in one subgroup and applied to individuals in a second independent subgroup for instrumental variable analysis. (DOCX)
Table S11 Associations between body mass index/fat mass index and activity levels as tested both by
conventional epidemiological approaches and through the application of instrumental variable analysis using a 32-SNP weighted allelic score as an instrument: analysis stratified by sex. Regression results were adjusted for age. Coefficients are displayed as sex-specific z-scores for both measures of adiposity and activity levels. P(DWH) is thep-value of the Durbin form of the DWH test, which examines the difference between the estimates from linear regression and instrumental variable analysis. *Moderate-to-vigorous activity was log transformed for analysis.
(DOCX)
Table S12 Associations between activity levels and body mass index as tested both by conventional epidemiolog-ical approaches and through the application of instru-mental variable analysis using genome-wide prediction scores for activity levels: analysis stratified by sex.
Regression results were adjusted for age. Coefficients are based onz-scores for activity and adiposity levels. P(DWH) is thep-value of the Durbin form of the DWH test, which examines the difference between the estimates from linear regression and instrumental variable analysis. *Moderate-to-vigorous activity was log transformed for analysis. $Physical activity prediction scores were generated in one subgroup and applied to individuals in a second independent subgroup for instrumental variable analysis.
(DOCX)
Table S13 Associations between activity levels and fat mass index as tested both by conventional epidemiolog-ical approaches and through the application of instru-mental variable analysis using genome-wide prediction scores for activity levels: meta-analysis for two sets of prediction scores stratified by sex.Regression results were adjusted for age. P(DWH) is thep-value of the Durbin form of the DWH test, which examines the difference between the estimates from linear regression and instrumental variable analysis. *Moderate-to-vigorous activity was log transformed for analysis.
$
Physical activity prediction scores were generated in one subgroup and applied to individuals in a second independent subgroup for instrumental variable analysis.
(DOCX)
Acknowledgments
We are extremely grateful to all the families who took part in this study, the midwives for their help in recruiting participants, and the whole ALSPAC team, which includes interviewers, computer and laboratory technicians, clerical workers, research scientists, volunteers, managers, receptionists, and nurses.
Author Contributions
Conceived and designed the experiments: RCR NJT GDS. Analyzed the data: RCR GM. Wrote the first draft of the manuscript: RCR. Contributed to the writing of the manuscript: RCR GDS ARN MdH GM NJT. ICMJE criteria for authorship read and met: RCR GDS ARN MdH GM NJT. Agree with manuscript results and conclusions: RCR GDS ARN MdH GM NJT.
References
1. Ness AR, Leary SD, Mattocks C, Blair SN, Reilly JJ, et al. (2007) Objectively measured physical activity and fat mass in a large cohort of children. PLoS Med 4: e97. 2. Ekelund U, Sardinha LB, Anderssen SA, Harro M, Franks PW, et al. (2004) Associations between objectively assessed physical activity and indicators of body fatness in 9- to 10-y-old European children: a population-based study from 4 distinct regions in Europe (the European Youth Heart Study). Am J Clin Nutr 80: 584–590.
3. Dencker M, Thorsson O, Karlsson MK, Linden C, Eiberg S, et al. (2006) Daily physical activity related to body fat in children aged 8–11 years. J Pediatr 149: 38–42.
4. Trost SG, Kerr LM, Ward DS, Pate RR (2001) Physical activity and determinants of physical activity in obese and non-obese children. Int J Obes Relat Metab Disord 25: 822–829.
BMI and Activity Mendelian Randomization Analysis
5. Ortega FB, Ruiz JR, Sjostrom M (2007) Physical activity, overweight and central adiposity in Swedish children and adolescents: the European Youth Heart Study. Int J Behav Nutr Phys Act 4: 61.
6. Jimenez-Pavon D, Kelly J, Reilly JJ (2010) Associations between objectively measured habitual physical activity and adiposity in children and adolescents: systematic review. Int J Pediatr Obes 5: 3–18.
7. Metcalf BS, Hosking J, Jeffery AN, Voss LD, Henley W, et al. (2011) Fatness leads to inactivity, but inactivity does not lead to fatness: a longitudinal study in children (EarlyBird 45). Arch Dis Child 96: 942–947.
8. Luke A, Cooper RS (2013) Physical activity does not influence obesity risk: time to clarify the public health message. Int J Epidemiol 42: 1831–1836. 9. Christiansen E, Swann A, Sorensen TI (2008) Feedback models allowing estimation
of thresholds for self-promoting body weight gain. J Theor Biol 254: 731–736. 10. Cook CM, Schoeller DA (2011) Physical activity and weight control: conflicting
findings. Curr Opin Clin Nutr Metab Care 14: 419–424.
11. Kamath CC, Vickers KS, Ehrlich A, McGovern L, Johnson J, et al. (2008) Behavioral interventions to prevent childhood obesity: a systematic review and metaanalyses of randomized trials. J Clin Endocrinol Metab 93: 4606–4615. 12. Harris KC, Kuramoto LK, Schulzer M, Retallack JE (2009) Effect of
school-based physical activity interventions on body mass index in children: a meta-analysis. CMAJ 180: 719–726.
13. McGovern L, Johnson JN, Paulo R, Hettinger A, Singhal V, et al. (2008) Clinical review: treatment of pediatric obesity: a systematic review and meta-analysis of randomized trials. J Clin Endocrinol Metab 93: 4600–4605. 14. Sun C, Pezic A, Tikellis G, Ponsonby AL, Wake M, et al. (2013) Effects of
school-based interventions for direct delivery of physical activity on fitness and cardiometabolic markers in children and adolescents: a systematic review of randomized controlled trials. Obes Rev 14: 818–838.
15. Riddoch CJ, Leary SD, Ness AR, Blair SN, Deere K, et al. (2009) Prospective associations between objective measures of physical activity and fat mass in 12– 14 year old children: the Avon Longitudinal Study of Parents and Children (ALSPAC). BMJ 339: b4544.
16. Moore LL, Gao D, Bradlee ML, Cupples LA, Sundarajan-Ramamurti A, et al. (2003) Does early physical activity predict body fat change throughout childhood? Prev Med 37: 10–17.
17. Remmers T, Sleddens EF, Gubbels JS, de Vries SI, Mommers M, et al. (2014) Relationship between physical activity and the development of body mass index in children. Med Sci Sports Exerc 46: 177–184.
18. Reichert FF, Baptista Menezes AM, Wells JC, Carvalho Dumith S, Hallal PC (2009) Physical activity as a predictor of adolescent body fatness: a systematic review. Sports Med 39: 279–294.
19. Wilks DC, Sharp SJ, Ekelund U, Thompson SG, Mander AP, et al. (2011) Objectively measured physical activity and fat mass in children: a bias-adjusted meta-analysis of prospective studies. PLoS ONE 6: e17205.
20. Ekelund U, Luan J, Sherar LB, Esliger DW, Griew P, et al. (2012) Moderate to vigorous physical activity and sedentary time and cardiometabolic risk factors in children and adolescents. JAMA 307: 704–712.
21. Hallal PC, Reichert FF, Ekelund U, Dumith SC, Menezes AM, et al. (2012) Bidirectional cross-sectional and prospective associations between physical activity and body composition in adolescence: birth cohort study. J Sports Sci 30: 183–190.
22. Hjorth MF, Chaput JP, Ritz C, Dalskov SM, Andersen R, et al. (2013) Fatness predicts decreased physical activity and increased sedentary time, but not vice versa: support from a longitudinal study in 8- to 11-year-old children. Int J Obes (Lond). E-pub ahead of print.
23. Davey Smith G, Ebrahim S (2003) ‘Mendelian randomization’: can genetic epidemiology contribute to understanding environmental determinants of disease? Int J Epidemiol 32: 1–22.
24. Davey Smith G, Lawlor DA, Harbord R, Timpson N, Day I, et al. (2007) Clustered environments and randomized genes: a fundamental distinction between conventional and genetic epidemiology. PLoS Med 4: e352. 25. Lawlor DA, Harbord RM, Sterne JA, Timpson N, Davey Smith G (2008)
Mendelian randomization: using genes as instruments for making causal inferences in epidemiology. Stat Med 27: 1133–1163.
26. Didelez V, Sheehan N (2007) Mendelian randomization as an instrumental variable approach to causal inference. Stat Methods Med Res 16: 309–330. 27. Timpson NJ, Harbord R, Davey Smith G, Zacho J, Tybjaerg-Hansen A, et al.
(2009) Does greater adiposity increase blood pressure and hypertension risk?: Mendelian randomization using the FTO/MC4R genotype. Hypertension 54: 84–90.
28. Lawlor DA, Harbord RM, Tybjaerg-Hansen A, Palmer TM, Zacho J, et al. (2011) Using genetic loci to understand the relationship between adiposity and psychological distress: a Mendelian randomization study in the Copenhagen General Population Study of 53,221 adults. J Intern Med 269: 525–537. 29. Lawlor DA, Timpson NJ, Harbord RM, Leary S, Ness A, et al. (2008) Exploring
the developmental overnutrition hypothesis using parental-offspring associations and FTO as an instrumental variable. PLoS Med 5: e33.
30. Nordestgaard BG, Palmer TM, Benn M, Zacho J, Tybjaerg-Hansen A, et al. (2012) The effect of elevated body mass index on ischemic heart disease risk: causal estimates from a Mendelian randomisation approach. PLoS Med 9: e1001212.
31. Timpson NJ, Nordestgaard BG, Harbord RM, Zacho J, Frayling TM, et al. (2011) C-reactive protein levels and body mass index: elucidating direction of
causation through reciprocal Mendelian randomization. Int J Obes (Lond) 35: 300–308.
32. Welsh P, Polisecki E, Robertson M, Jahn S, Buckley BM, et al. (2010) Unraveling the directional link between adiposity and inflammation: a bidirectional Mendelian randomization approach. J Clin Endocrinol Metab 95: 93–99.
33. Speliotes EK, Willer CJ, Berndt SI, Monda KL, Thorleifsson G, et al. (2010) Association analyses of 249,796 individuals reveal 18 new loci associated with body mass index. Nat Genet 42: 937–948.
34. Boyd A, Golding J, Macleod J, Lawlor DA, Fraser A, et al. (2013) Cohort profile: the ‘children of the 90s’—the index offspring of the Avon Longitudinal Study of Parents and Children. Int J Epidemiol 42: 111–127.
35. Fraser A, Macdonald-Wallis C, Tilling K, Boyd A, Golding J, et al. (2013) Cohort profile: the Avon Longitudinal Study of Parents and Children: ALSPAC mothers cohort. Int J Epidemiol 42: 97–110.
36. Garn SM, Leonard WR, Hawthorne VM (1986) Three limitations of the body mass index. Am J Clin Nutr 44: 996–997.
37. Prentice AM, Jebb SA (2001) Beyond body mass index. Obes Rev 2: 141–147. 38. Riddoch CJ, Mattocks C, Deere K, Saunders J, Kirkby J, et al. (2007) Objective measurement of levels and patterns of physical activity. Arch Dis Child 92: 963– 969.
39. Mattocks C, Leary S, Ness A, Deere K, Saunders J, et al. (2007) Calibration of an accelerometer during free-living activities in children. Int J Pediatr Obes 2: 218–226.
40. Mattocks C, Ness A, Leary S, Tilling K, Blair SN, et al. (2008) Use of accelerometers in a large field-based study of children: protocols, design issues, and effects on precision. J Phys Act Health 5 (Suppl 1): S98–S111.
41. Li Y, Willer C, Sanna S, Abecasis G (2009) Genotype imputation. Annu Rev Genomics Hum Genet 10: 387–406.
42. Li Y, Willer CJ, Ding J, Scheet P, Abecasis GR (2010) MaCH: using sequence and genotype data to estimate haplotypes and unobserved genotypes. Genet Epidemiol 34: 816–834.
43. Palmer TM, Lawlor DA, Harbord RM, Sheehan NA, Tobias JH, et al. (2012) Using multiple genetic variants as instrumental variables for modifiable risk factors. Stat Methods Med Res 21: 223–242.
44. Reilly JJ, Armstrong J, Dorosty AR, Emmett PM, Ness A, et al. (2005) Early life risk factors for obesity in childhood: cohort study. BMJ 330: 1357–1359. 45. Staiger D, Stock JH (1997) Instrumental variables regression with weak
instruments. Econometrica 65: 557–586.
46. Baum C, Schaffer M, Stillman S (2007) IVENDOG: Stata module to calculate Durbin-Wu-Hausman endogeneity test after ivreg. Statistical Software Compo-nents S494401. Boston: Boston College Department of Economics.
47. Davey Smith G, Ebrahim S (2004) Mendelian randomization: prospects, potentials, and limitations. Int J Epidemiol 33: 30–42.
48. Davey Smith G (2011) Use of genetic markers and gene-diet interactions for interrogating population-level causal influences of diet on health. Genes Nutr 6: 27–43.
49. De Moor MH, Liu YJ, Boomsma DI, Li J, Hamilton JJ, et al. (2009) Genome-wide association study of exercise behavior in Dutch and American adults. Med Sci Sports Exerc 41: 1887–1895.
50. Kim J, Oh S, Min H, Kim Y, Park T (2011) Practical issues in genome-wide association studies for physical activity. Ann N Y Acad Sci 1229: 38–44. 51. Evans DM, Visscher PM, Wray NR (2009) Harnessing the information
contained within genome-wide association studies to improve individual prediction of complex disease risk. Hum Mol Genet 18: 3525–3531. 52. Purcell SM, Wray NR, Stone JL, Visscher PM, O’Donovan MC, et al. (2009)
Common polygenic variation contributes to risk of schizophrenia and bipolar disorder. Nature 460: 748–752.
53. de los Campos G, Gianola D, Allison DB (2010) Predicting genetic predisposition in humans: the promise of whole-genome markers. Nat Rev Genet 11: 880–886.
54. Yang J, Benyamin B, McEvoy BP, Gordon S, Henders AK, et al. (2010) Common SNPs explain a large proportion of the heritability for human height. Nat Genet 42: 565–569.
55. Wray NR, Yang J, Hayes BJ, Price AL, Goddard ME, et al. (2013) Pitfalls of predicting complex traits from SNPs. Nat Rev Genet 14: 507–515.
56. Yang J, Lee SH, Goddard ME, Visscher PM (2011) GCTA: a tool for genome-wide complex trait analysis. Am J Hum Genet 88: 76–82.
57. Purcell S, Neale B, Todd-Brown K, Thomas L, Ferreira MAR, et al. (2007) PLINK: a tool set for whole-genome association and population-based linkage analyses. Am J Hum Genet 81: 559–575.
58. Angrist JD, Krueger AB (1995) Split-sample instrumental variables estimates of the return to schooling. J Bus Econ Stat 13: 225–235.
59. DerSimonian R, Laird N (1986) Meta-analysis in clinical trials. Control Clin Trials 7: 177–188.
60. Cole TJ, Bellizzi MC, Flegal KM, Dietz WH (2000) Establishing a standard definition for child overweight and obesity worldwide: international survey. BMJ 320: 1240–1243.
61. Timpson NJ, Emmett PM, Frayling TM, Rogers I, Hattersley AT, et al. (2008) The fat mass- and obesity-associated locus and dietary intake in children. Am J Clin Nutr 88: 971–978.
62. den Hoed M, Ekelund U, Brage S, Grontved A, Zhao JH, et al. (2010) Genetic susceptibility to obesity and related traits in childhood and adolescence:
BMI and Activity Mendelian Randomization Analysis
influence of loci identified by genome-wide association studies. Diabetes 59: 2980–2988.
63. Bradfield JP, Taal HR, Timpson NJ, Scherag A, Lecoeur C, et al. (2012) A genome-wide association meta-analysis identifies new childhood obesity loci. Nat Genet 44: 526–531.
64. Kilpelainen TO, Zillikens MC, Stancakova A, Finucane FM, Ried JS, et al. (2011) Genetic variation near IRS1 associates with reduced adiposity and an impaired metabolic profile. Nat Genet 43: 753–760.
65. Sallis JF, Prochaska JJ, Taylor WC (2000) A review of correlates of physical activity of children and adolescents. Med Sci Sports Exerc 32: 963–975. 66. Szendroedi J, Roden M (2008) Mitochondrial fitness and insulin sensitivity in
humans. Diabetologia 51: 2155–2167.
67. Janssen I, LeBlanc AG (2010) Systematic review of the health benefits of physical activity and fitness in school-aged children and youth. Int J Behav Nutr Phys Act 7: 40.
68. Strong WB, Malina RM, Blimkie CJ, Daniels SR, Dishman RK, et al. (2005) Evidence based physical activity for school-age youth. J Pediatr 146: 732–737. 69. Leary SD, Ness AR, Davey Smith G, Mattocks C, Deere K, et al. (2008) Physical activity and blood pressure in childhood—findings from a population-based study. Hypertension 51: 92–98.
70. Ekelund U, Brage S, Froberg K, Harro M, Anderssen SA, et al. (2006) TV viewing and physical activity are independently associated with metabolic risk in children: the European Youth Heart Study. PLoS Med 3: 2449–2457. 71. Brage S, Wedderkopp N, Ekelund U, Franks PW, Wareham NJ, et al. (2004)
Objectively measured physical activity correlates with indices of insulin
resistance in Danish children. the European Youth Heart Study (EYHS). Int J Obes 28: 1503–1508.
72. Andersen LB, Riddoch C, Kriemler S, Hills A (2011) Physical activity and cardiovascular risk factors in children. Br J Sports Med 45: 871–876. 73. Luke A, Dugas LR, Durazo-Arvizu RA, Cao GC, Cooper RS (2011) Assessing
physical activity and its relationship to cardiovascular risk factors: NHANES 2003–2006. BMC Public Health 11: 387.
74. Deforche B, Haerens L, de Bourdeaudhuij I (2011) How to make overweight children exercise and follow the recommendations. Int J Pediatr Obes 6: 35–41. 75. Westerterp KR, Speakman JR (2008) Physical activity energy expenditure has not declined since the 1980s and matches energy expenditures of wild mammals. Int J Obes (Lond) 32: 1256–1263.
76. Swinburn B, Sacks G, Ravussin E (2009) Increased food energy supply is more than sufficient to explain the US epidemic of obesity. Am J Clin Nutr 90: 1453– 1456.
77. Stubbe JH, Boomsma DI, De Geus EJ (2005) Sports participation during adolescence: a shift from environmental to genetic factors. Med Sci Sports Exerc 37: 563–570.
78. Franks PW, Ravussin E, Hanson RL, Harper IT, Allison DB, et al. (2005) Habitual physical activity in children: the role of genes and the environment. Am J Clin Nutr 82: 901–908.
79. Fisher A, van Jaarsveld CH, Llewellyn CH, Wardle J (2010) Environmental influences on children’s physical activity: quantitative estimates using a twin design. PLoS ONE 5: e10110.
BMI and Activity Mendelian Randomization Analysis